IVAAP Release 2.7: More Map Search and ArcGIS Features
Highlights from the IVAAP 2.7 release include many advanced search and map capabilities, improved 3D widget filter dialog, new interval curves support, new date/time picker for Cross-Plot widget axis settings, and more!
INT’s GeoToolkit.JS 2020.1 Release Brings Major Features in 2D/3D Visualization and Optimized Rendering in Web Browser
INT is pleased to announce the newest release of GeoToolkit.JS data visualization libraries and toolkit. This major release includes new 3D visualization capabilities—contour 3D, 3D shape highlighting, and better 3D seismic—and new rendering options.
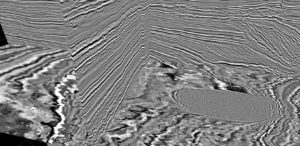
How to Get the Best Performance out of Your Seismic Web Applications
One of the most challenging data management problems faced in the industry is with seismic files. Some oil and gas companies estimate that they acquire a petabyte of data per day or more. Domain knowledge and specific approaches are required to move, access, and visualize that data. In this blog post, we will dive deep into the details of modern technology that can be useful to achieve speed up.
Search, Access, and Visualize OSDU Data with IVAAP
INT has been working with the Open Subsurface Data Universe™ (OSDU) consortium since the beginning of the OSDU forum in 2019. INT made IVAAP available as part of the Demo release of the OSDU platform. The OSDU is a standard data platform for the oil and gas industry which will reduce silos and put data at the center of the subsurface community.
Weatherford, INT Expand Collaboration to Create 2D, 3D Real-Time Well Visualization
Weatherford International plc (OTC Pink: WFTLF) announced a strengthened collaboration with upstream data visualization provider INT to provide next-level, real-time well visualization in both 2D and 3D. Weatherford will embed INT’s IVAAP framework into the Weatherford Centro™ digital well delivery software, advancing its data visualization capabilities.


