• Skip to main content
  • Skip to footer

INT

Empowering Visualization

COMMUNITY BLOG
CONTACT US SUPPORT
MENUMENU
  • Solutions
    • Overview
    • Real-Time Visualization
    • Visualization Components
    • New Energy Visualization
    • OSDU Visualization
    • Machine Learning
    • Developer Tools
    • Cloud Partners
  • Products
    • IVAAP™
          • SOLUTIONS

            Real-Time Visualization

            OSDU Visualization

            Visualization Components

            New Energy Visualization

            Upstream Data Visualization

          • SUCCESS STORIES

            WEATHERFORD
            Well delivery optimization software

            BARDASZ
            Data management, data quality monitoring

            ANPG / SATEC-MIAPIA
            Virtual data room

            MAILLANCE
            High-performance visualization of ML algorithms

            SEE ALL >

          • SUPPORT

            DEVELOPER COMMUNITY
            Join or log in to the INT Developer Community.

            GET SUPPORT
            Log a ticket for an issue or bug.

            CONTACT US

          • DEMOS

            IVAAP DEMOS
            Cloud-Based Demos

            FIRST TIME HERE?
            Register to access our
            IVAAP demos

    • GeoToolkit™
          • SUCCESS STORIES

            CAYROS
            Field development planning

            TOTALENERGIES
            High-performance large dataset reservoir rendering

            IFP ENERGIES NOUVELLES
            Seismic and structural interpretation validation

            SEE ALL >

          • SUPPORT

            DEVELOPER COMMUNITY
            Join or log in to the INT Developer Community.

            GET SUPPORT
            Log a ticket for an issue or bug.

            CONTACT US

          • DEMOS

            GEOTOOLKIT DEMOS
            Geoscience Demos

    • INTViewer™
          • SUCCESS STORIES

            STRYDE
            Fast seismic QA/QC in the field

            SILVERTHORNE SEISMIC
            Efficient 2D/3D seismic data delivery

            WIRELESS SEISMIC
            Drones, IoT, and Advanced Onsite Seismic Data Validation

            SEE ALL >

          • SUPPORT

            GET SUPPORT
            Log a ticket for an issue or bug.

            CONTACT US

          • PLUG-INS

            EXTEND INTVIEWER
            More than 65 plugins available

  • Demos
    • GeoToolkit Demos
    • IVAAP Demos
  • Success Stories
  • Resources
    • Blog
    • Developer Community
    • FAQ
    • INT Resources Library
  • About
    • Overview
    • News
    • Events
    • Careers
    • Meet Our Team
    • About INT

HTML5

Sep 15 2020

Integrating Powerful Map Capabilities into Your Subsurface Web Applications

Map-based search is an integral part of subsurface data visualization. In order to meet usability expectations, developers of subsurface applications in the cloud must add powerful map and map-based search functionalities.

The GeoToolkit map widget simplifies the process, allowing users to get quick and clear insights using common web mapping services. In this blog post, we will cover how to access the map widget in GeoToolkit, how to integrate other Web Services, including ArcGIS, ESRI REST, OpenStreetMap, Google, Microsoft, etc., and more about GeoToolkit’s features, including layering, labeling, symbols, annotations, and more.

map4-web

Features

With GeoToolkit.JS, there are many general functionalities that you can use in your web application. The map, which is based on the Core toolkit, provides two different versions of libraries: it has ECMAScript 6 or if you’re going for a more classical approach, ECMAScript 5. It can be used in part with different UI frameworks like React, Angular, or VUE. Moreover, it has user-friendly functionalities like symbol aggregation, label collision, export to PDF, and imaging formats.

There are also different functionalities that can be available such as axes, titles, and scrollbars. The predefined interaction tools allow you to display crosshair, panning tools, zoom to measure distance, tooltip, rubberband, and more. GeoToolkit.JS map supports a wide range of map formats and services like ArcGIS, GeoJSON, KML, Mapbox, Bing, and so on. It is also compatible with other GeoToolkitJS elements like charts, shapes, and widgets.

Getting Started

import {Map} from '@int/geotoolkit/map/Map';
import {Plot} from '@int/geotoolkit/plot/Plot';
import {Tile} from '@int/geotoolkit/map/layers/Tile';
const map = new Map();
map.addLayer(new Tile({
 'name': 'OpenStreetMap',
 'url': https://demo.int.com/osm_tiles/{z}/{x}/{y}.png
}))
const plot = new Plot({
  'canvaselement': canvas,
  'root': map
});


map3-web


  1. Create a map widget.
  2. Connect DOM canvas with the widget by creating a Plot done like other widgets.
  3. Add a layer (or layers) of interest to the widget.

Web Services: ESRI REST, OpenStreetMap, Google, Microsoft

It is important to consider which types of services can be supported since all of your data is received from different types of servers. Some services hosted include: ESRI Rest, ArcGIS, OpenStreetMap, Google Map, Microsoft, etc.

The ArcGIS Web Map protocol which is used by ArcGIS online is an easy and convenient way to build your map application. You can go to ArcGIS online, create your content, put necessary layers, combine them together, provide the link to our map widget and it will automatically be recognized. Most layers are supported. Image services (ArcGIS Image Service Layer, Image Services Vector Layers, and WMS) and Tile services (Image Service, ArcGIS Tiled Map Service Layer, Web Tiled Layer, OpenStreetMap) are supported. Feature Services include map service (ArcGIS Feature Layer), KML, WFS, and CSV. We also provide some real-time services support like stream services (ArcGIS Stream Layer), GeoRSS, Vector Tiles (VectorTileLayer), and Bing Maps services. Two extra formats that are supported are GeoJSON and GPX.

Map Services

Services cannot be used without visualization. Our part in maps products is to provide visualization for these services. To start visualization, you need to create your map widget and specify different properties. One example of a system is CRS, which is a common coordinate system of displayed data. You can specify map limits if you want to limit the visualization area of interest. You can also set different adornments to your maps like map scale. Zoom settings include min/max with a range of scales available and time/speed to customize the map management to your convenience.

Map Layers

There are four main types of layers supported:

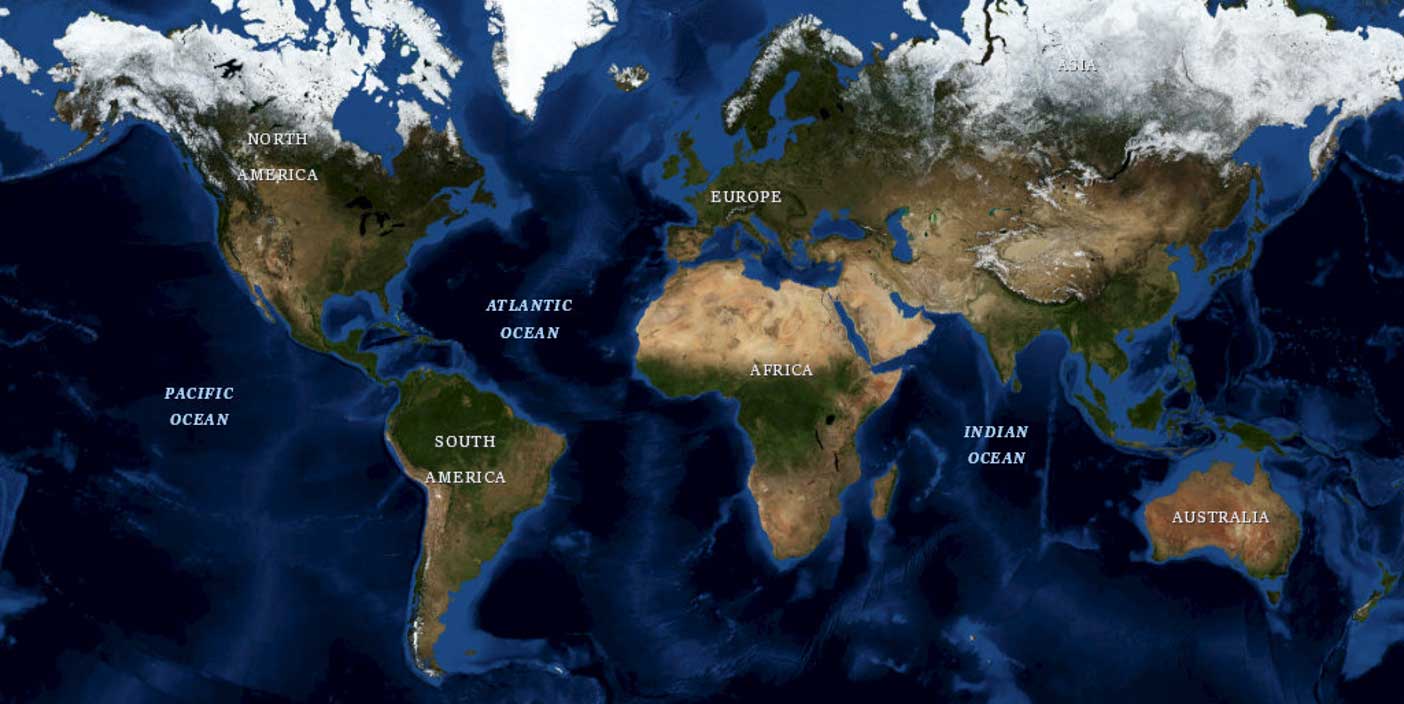
  • Image type that displays a single image received from a server. For example, WMS for Web Maps Services and ArcGISImage supports ArcGIS MapServer and ImageServer services.
  • With Tile layers, the data consists of several images (tiles) painted next to each other and thus forming a complete picture. Tile can be used as a universal layer for any tile service. Bing can be used for all Microsoft Bing Services.
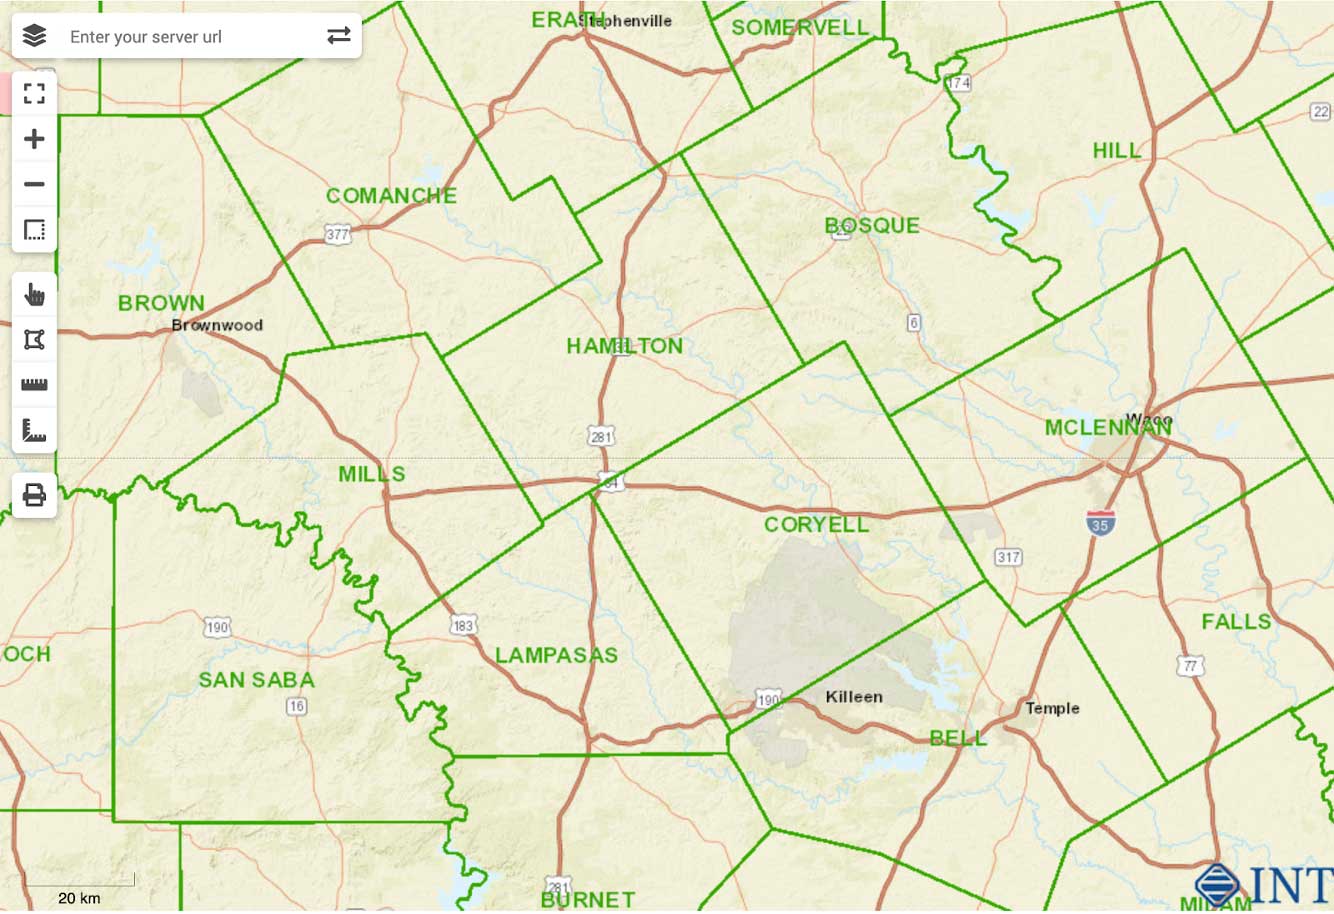
  • Vector layers draw not pictures but vector data (called “features”): points, polygons, and polylines, which depict cities, rivers, islands, and more. Support of different formats includes: GeoJSON, KML, CSV, GeoRSS, Lerc translate their format into the map objects, the ArcGISFeature supports ARCGIS FeatureServer services., WFS for Web Feature Services, and VectorTile.
  • Shape layer is used for compatibility with other GeoToolkitJS elements to display on the map charts, contours, and other complex shapes (or just trivial ones).

Layer Settings

General setting for layers include url to the server or file, data coordinate system (epsg codes are supported), alpha as the value of the layer transparency, layerfilter for setting visibility conditions, tooltip.visible to enable tooltip support by the layer, and tooltip.formatter to generate information (in HTML format) of the tooltip content (can be used in both the basic GeoToolkitJS formatters or a custom one).


Examples of different layers:

map2-web

tsunami-web

map-web

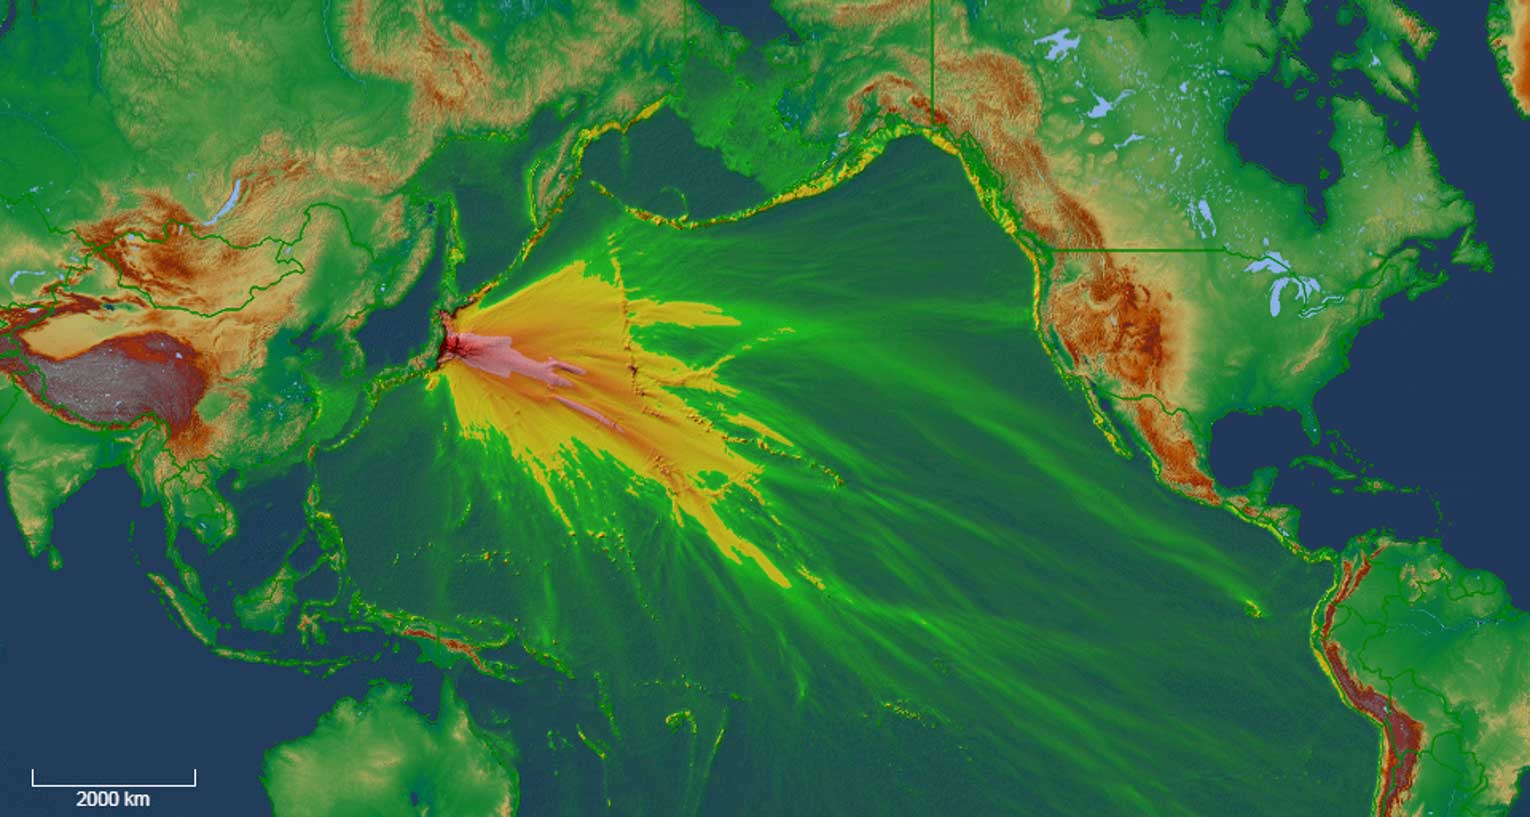
Geo-Reference Images

Geotoolkit provides powerful options like fast WebGL implementation and ImageTransform to help speed up the process to transform any image in your application.
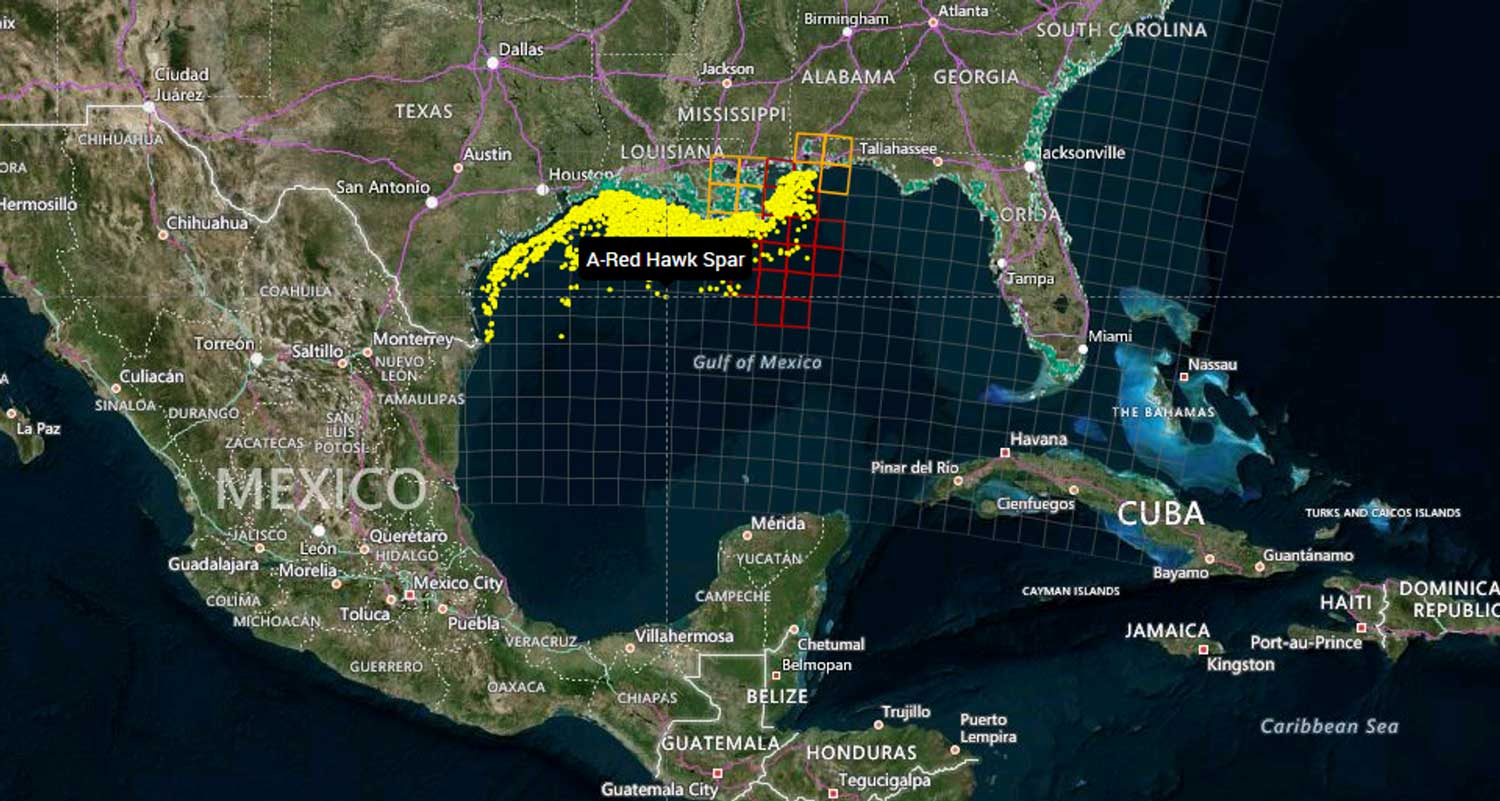
Feature Annotations

In map displays, you can have a lot of different annotations and some of them can potentially overlap. To help filter out the overlapped annotations, you want to use some collision detection to remove unnecessary labels. We provide all of these functionalities which can be configured. The steps to display labels are:

  1. Use annotations.visible layer property to include annotations (hidden by default)
  2. To select annotation info, change the annotation.strategy parameter to the AnnotationByAttribute or AnnotationByRule instance with the attribute name or \expression to display.
  3. Set the text shape for the template to customize annotations drawing styles and textSizeInfo option to dynamically resize annotations.
  4. Annotation filters prevent some information from being written in order to save space, time, etc.

Robust Map Features for Your Subsurface Application

Overall, GeoToolkit’s map widget allows you to integrate many robust map features into your subsurface or exploration applications. We hope this helps you simplify the process, meet usability expectations, and get the insights you need.

For more information on GeoToolkit’s maps widget and its features, please visit our GeoToolkit page.

Want to know more? Check out our webinar: Integrating Powerful Map Capabilities into Your Subsurface Web Applications.


Filed Under: GeoToolkit, HTML5, JavaScript Tagged With: arcgis, Bing, CRS, ESRI, GeoJSON, Google, KML, map, Mapbox, Microsoft, OpenStreetMap, WMS

Sep 16 2019

Bluware and Interactive Network Technologies, Inc. (INT) Secure Strategic Partnership

INT and Bluware Partner to Offer Volume Data Store (VDS) Seismic Data Format as part of Open Subsurface Data Universe (OSDU) Release 2

HOUSTON, TX – September 16, 2019 – Bluware Corp., the digital innovation platform for seismic data, is pleased to announce a strategic partnership with Interactive Network Technologies, Inc. (INT), a leader in multi-domain visualization in exploration and production (E&P).

Bluware and INT are early members in the Open Subsurface Data Universe (OSDU), a forum focused on developing a standard that creates a common data platform for all exploration, development, and well data. The standard will transform the way subsurface data is captured, analyzed, and operated.

INT and Bluware are collaborating to integrate Volume Data Store (VDS), a data format with adaptive streaming technology for seismic data storage, into IVAAP, an upstream data visualization platform.

Bluware has more than 20 years of experience enabling customers to store, access, and utilize large signal datasets. At the core of Bluware’s technology portfolio is VDS, which can intelligently manage all types of seismic data, including pre-stack, post-stack, WAZ, and more as demanded by an organization’s business needs, workflows, and infrastructure requirements. It can also transfer legacy formats such as SEG-Y or SEP using advanced on-the-fly transcoding on-premise or in the cloud.

INT has 30 years of experience in subsurface data visualization. IVAAP is an HTML5 data visualization platform for E&P workflows in the cloud that empowers product owners, developers, and architects to accelerate the delivery of subsurface digital solutions for oil and gas. Rather than develop complex G&G and petrophysical visual workflows from scratch, companies can leverage the IVAAP platform and customize it in a fraction of the time. Deployable in any cloud environment (Azure®, GCP®, AWS®), IVAAP can scale to meet the needs of tens to thousands of users.


“We are excited about this partnership. IVAAP multi-domain data visualization will benefit from the adoption of VDS optimized seismic format. Together, the technologies will significantly increase the velocity at which G&G business decisions can be made,” says Dr. Olivier Lhemann, President and Founder of INT.


This partnership will result in the integration of VDS for current IVAAP customers at the end of October 2019. Later this year, INT will offer IVAAP for OSDU Release 2, which will include full support for OpenVDS, the open source version of VDS.


“We are excited to welcome INT to the Bluware platform. The IVAAP solution is one of the first cloud-native visualization solutions in E&P. INT’s extensive industry experience brings further validation to the Bluware platform. Our partnership expedites digital transformation initiatives for our customers looking for early success in their journey to the cloud,” says Dan Piette, CEO at Bluware.


About Bluware Corp.
Bluware enables oil and gas companies to solve the most challenging objectives in the petrotechnical world. E&P companies use Bluware to achieve previously unthinkable workflows using cloud computing, artificial intelligence, and interactive machine learning for seismic data applications and workflows. For further information, visit www.bluware.com.

About Interactive Network Technologies, Inc. (INT)
For three decades, we’ve created products that help oil and gas companies visualize, monitor, and analyze their data. From customizable widgets to out-of-the-box applications, our expert visualization solutions offer unparalleled flexibility for both scientific industries and business, and our HTML5/web-enabled visualization technologies are rock-solid and network-secure. For further information, visit int.flywheelstaging.com.

For more information about IVAAP or INT’s other data visualization products, please visit int.flywheelstaging.com.

Read the press release on PRWeb.

INT, the INT logo, and IVAAP are trademarks of Interactive Network Technologies, Inc., in the United States and/or other countries.

Open Subsurface Data Universe™ and OSDU™ are trademarks of The Open Group.

Filed Under: HTML5, IVAAP Tagged With: Bluware, ivaap, OSDU, VDS

Footer

Solutions

  • Real-Time Visualization
  • Visualization Components
  • New Energy Visualization
  • OSDU Visualization
  • Machine Learning
  • Developer Tools
  • Cloud Partners
  • Customer Success Stories

Products

  • IVAAP
  • GeoToolkit
  • INTViewer
  • IVAAP Demos
  • GeoToolkit Demos

About

  • News
  • Events
  • Careers
  • Management Team

Resources

  • Blog
  • FAQ

Support

  • JIRA
  • Developer Community

Contact

INT logo
© 1989–2024 Interactive Network Technologies, Inc.
Privacy Policy
  • Careers
  • Contact Us
  • Search

COPYRIGHT © 2025 INTERACTIVE NETWORK TECHNOLOGIES, Inc