• Skip to main content
  • Skip to footer

INT

Empowering Visualization

COMMUNITY BLOG
CONTACT US SUPPORT
MENUMENU
  • Solutions
    • Overview
    • Real-Time Visualization
    • Visualization Components
    • New Energy Visualization
    • OSDU Visualization
    • Machine Learning
    • Developer Tools
    • Cloud Partners
  • Products
    • IVAAP™
          • SOLUTIONS

            Real-Time Visualization

            OSDU Visualization

            Visualization Components

            New Energy Visualization

            Upstream Data Visualization

          • SUCCESS STORIES

            WEATHERFORD
            Well delivery optimization software

            BARDASZ
            Data management, data quality monitoring

            ANPG / SATEC-MIAPIA
            Virtual data room

            MAILLANCE
            High-performance visualization of ML algorithms

            SEE ALL >

          • SUPPORT

            DEVELOPER COMMUNITY
            Join or log in to the INT Developer Community.

            GET SUPPORT
            Log a ticket for an issue or bug.

            CONTACT US

          • DEMOS

            IVAAP DEMOS
            Cloud-Based Demos

            FIRST TIME HERE?
            Register to access our
            IVAAP demos

    • GeoToolkit™
          • SUCCESS STORIES

            CAYROS
            Field development planning

            TOTALENERGIES
            High-performance large dataset reservoir rendering

            IFP ENERGIES NOUVELLES
            Seismic and structural interpretation validation

            SEE ALL >

          • SUPPORT

            DEVELOPER COMMUNITY
            Join or log in to the INT Developer Community.

            GET SUPPORT
            Log a ticket for an issue or bug.

            CONTACT US

          • DEMOS

            GEOTOOLKIT DEMOS
            Geoscience Demos

    • INTViewer™
          • SUCCESS STORIES

            STRYDE
            Fast seismic QA/QC in the field

            SILVERTHORNE SEISMIC
            Efficient 2D/3D seismic data delivery

            WIRELESS SEISMIC
            Drones, IoT, and Advanced Onsite Seismic Data Validation

            SEE ALL >

          • SUPPORT

            GET SUPPORT
            Log a ticket for an issue or bug.

            CONTACT US

          • PLUG-INS

            EXTEND INTVIEWER
            More than 65 plugins available

  • Demos
    • GeoToolkit Demos
    • IVAAP Demos
  • Success Stories
  • Resources
    • Blog
    • Developer Community
    • FAQ
    • INT Resources Library
  • About
    • Overview
    • News
    • Events
    • Careers
    • Meet Our Team
    • About INT

GeoToolkit

Apr 14 2020

GeoToolkit 2020: Top New Features

GeoToolkit is a suite of 2D and 3D data visualization libraries that display well log, seismic, contour, schematics, BHA, maps, and more in JavaScript. Released earlier this year, GeoToolkit.JS 2020 comes with various new features and significant improvements.

Highlights from the latest release include: improved ArcGIS support, faster load times, new tools, multilateral schematics, new gridding algorithms, and improved memory for volumetric rendering.

CARNAC

In Carnac, the base model of GeoToolkit, ES6 harmony modules support has been added. This allows client applications to be reduced in size and allows for a better integration with React and VUE frameworks. It also includes two sets of libraries for ES5 and ES6, two sets of demos and tutorials, two sets of API references, and new TypeScript headers for ES6.

GeoToolkit now also supports NPM. NPM provides local packages for ES5 and ES6 and simplifies the integration of GeoToolkit. Later this year, an INT-based NPM server will be provided (it is currently in the beta testing stage).

We’ve made migrating from ES5 to ES6 easy—just use the command line tool. We’ve also added support for different pyramid images (deep zoom image protocol, OSM, IIIF, and so on) to help with LOD for larger files. And we’ve implemented an Elastic zoom and scroll tool. Another new feature is the DataSheet widget where users can change the look and feel of the data, see table data, modify cells, merge cells, and highlight specific cells.

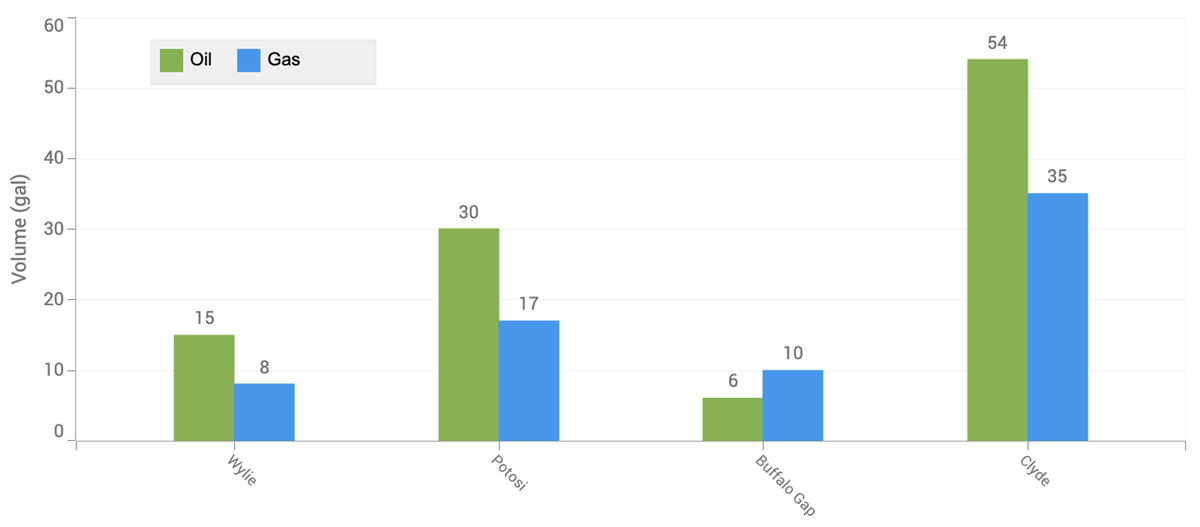
GeoToolkit.JS now also comes with support for automatic calculation of the desired axis size for charts like Bar Chart and support for CSS 2D transform and text transform for nodes based on AbstractNode. We added an HTTP layer to provide an abstraction API to make HTTP requests and integrate with existing API for Seismic, WellLog, and Contour.
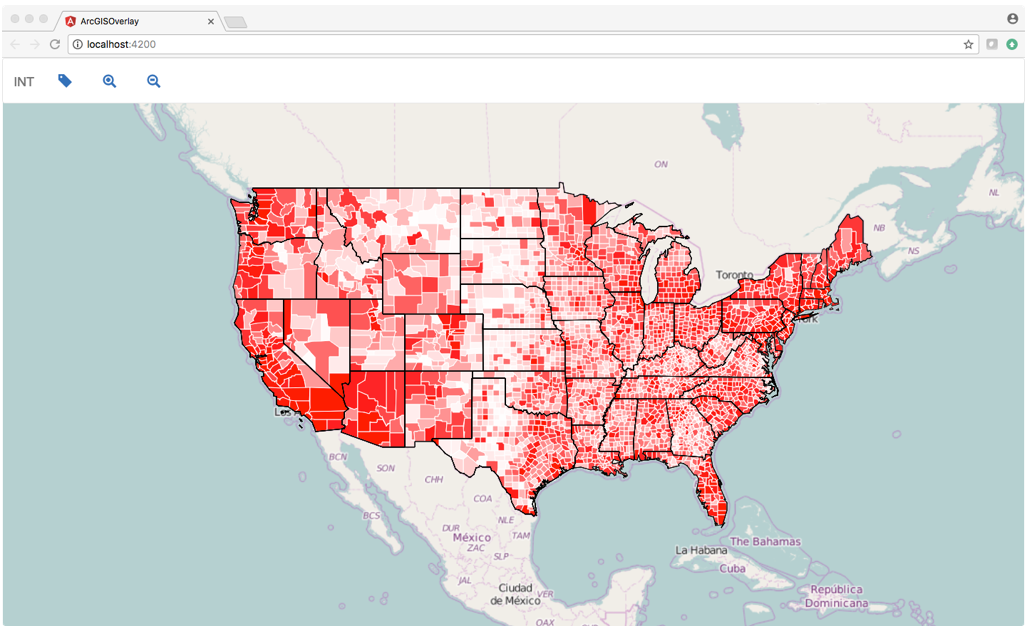
 

MAP

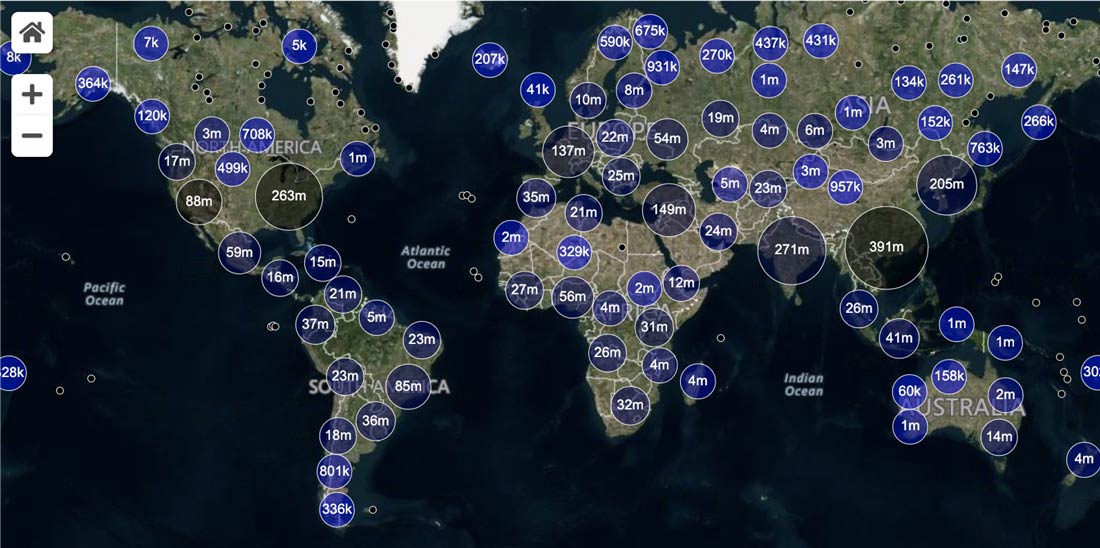
For our map libraries, new features include an infinite horizontal scroll, GPX format support, a tool to measure distances and area, added support for HTTP request headers (to GIS servers), the ability to create layers from configuration using JSON, an optional UI zoom control, improved ArcGIS support with added query/identify/legend API support for ArcGIS servers, added aggregation of symbols, and a create option to display highlighted features in the manipulation layer.
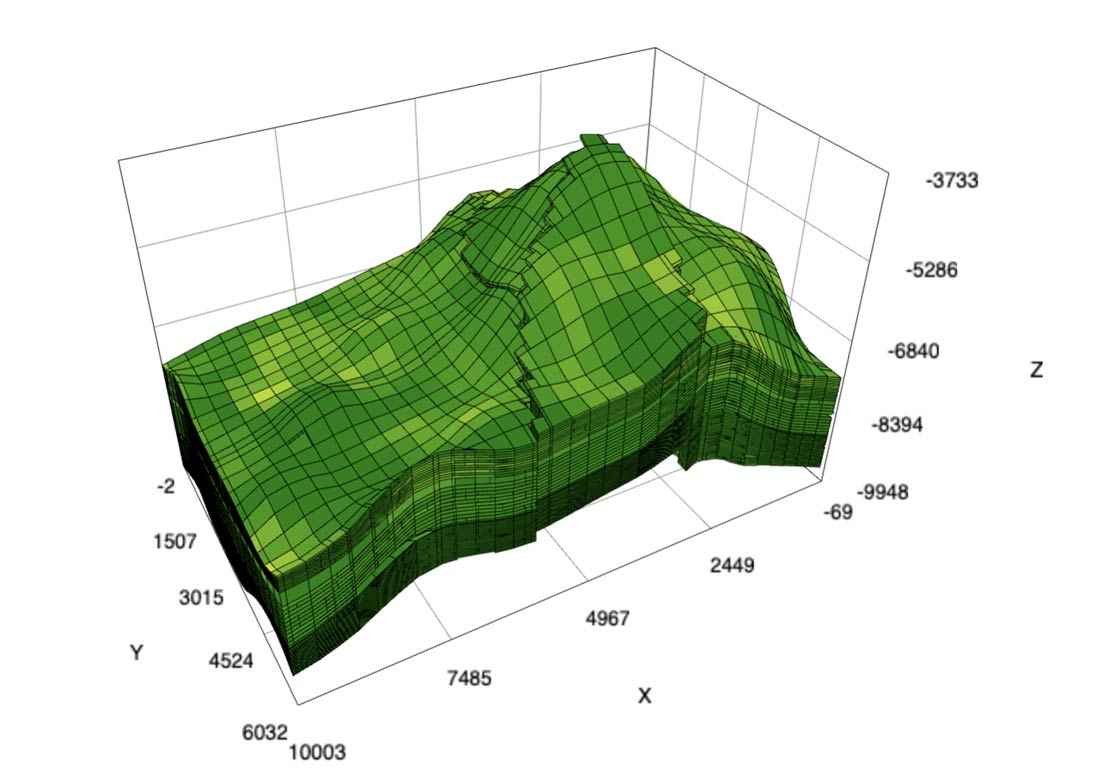


CARNAC 3D

We improved the performance and memory usage for reservoirs, and we introduced the first version of client support for GigaGrid. We added label notations for wellbore as well as the ability to wrap the map on top of the elevation in 3D. Carnac 3D also comes with support for seismic slice in different directions. The Scatter Plot in Carnac 3D is optimized to use a larger number of points, support in picking and highlighting, and support for tooltips.
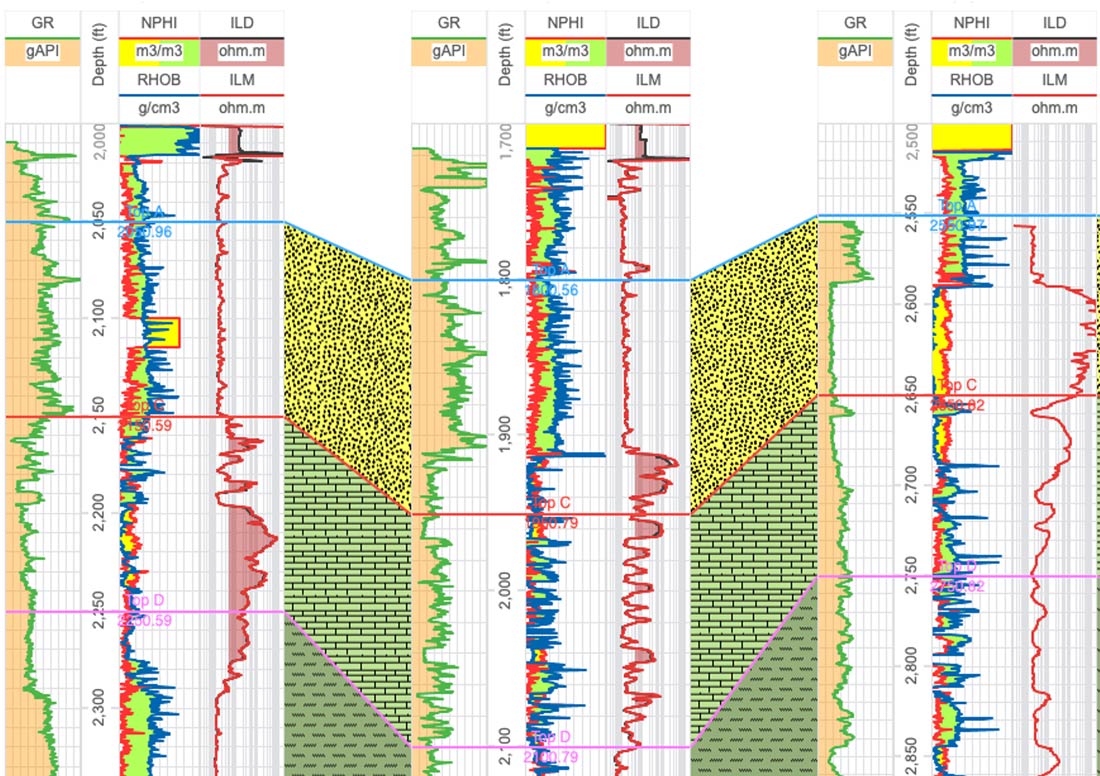


WELLLOG

For the WellLog package, all demos were rewritten for both ES5 and ES6. The MultiWell library was optimized and improved. After multiple requests from customers, support for a ghost tool in deviated tracks has been added. Several modifications were done for the MultiWell widget, including modifying the algorithm for tops alignment, adding method to navigate to track, and implementing GAP Fill and Gap Disconnect for log curve and array log (log2d), and ArrayLog support in deviation.

The new drag and drop tool for MultiWellWidget allows you to drag and drop wells with several methods to mitigate for different positions of your correlation display and different alignments. We’ve updated WellLogWidget and MultiWellWidget to have a similar API so clients can play tracks, remove tracks, and so on the same way with both widgets. We’ve also reduced memory usage and increased performance of log2d visuals when exporting PDFs.
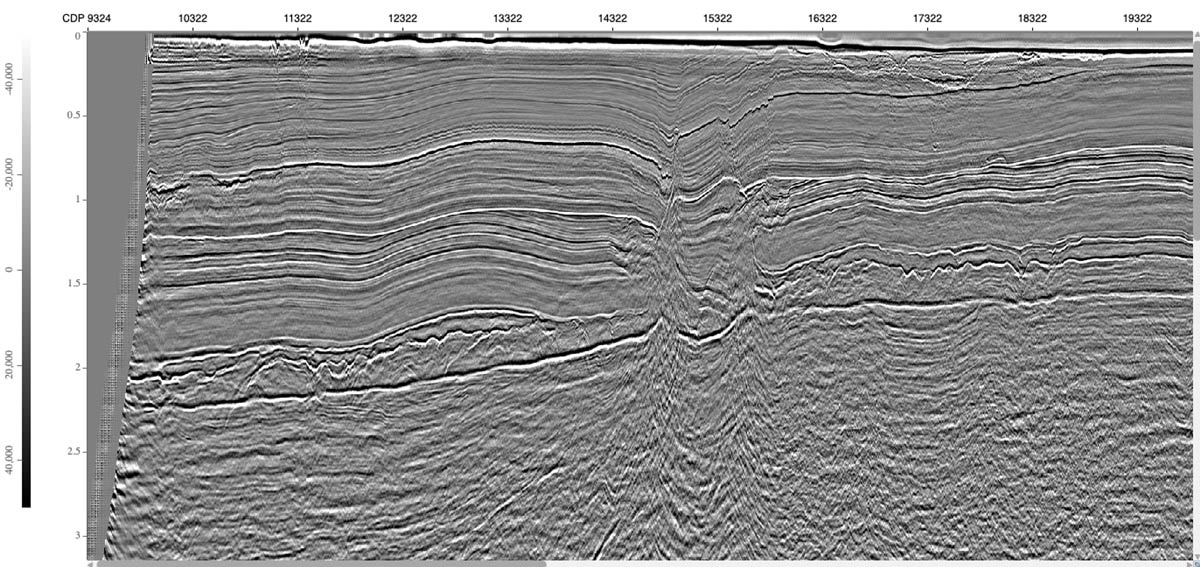


SEISMIC

Seismic still has the same widget, but some elements were redesigned. New features in seismic include highlight of traces, floating elements in SeismicWidget toolbar, improved auxiliary chart, startValue as an option to MemoryReader. You can now also specify density decimation without wiggles and integrate webassembly seismic decompression for IVAAP connectors, which is two times faster compared to the JavaScript version. If your browser supports webassembly, you can automatically switch to webassembly mode for decompression.
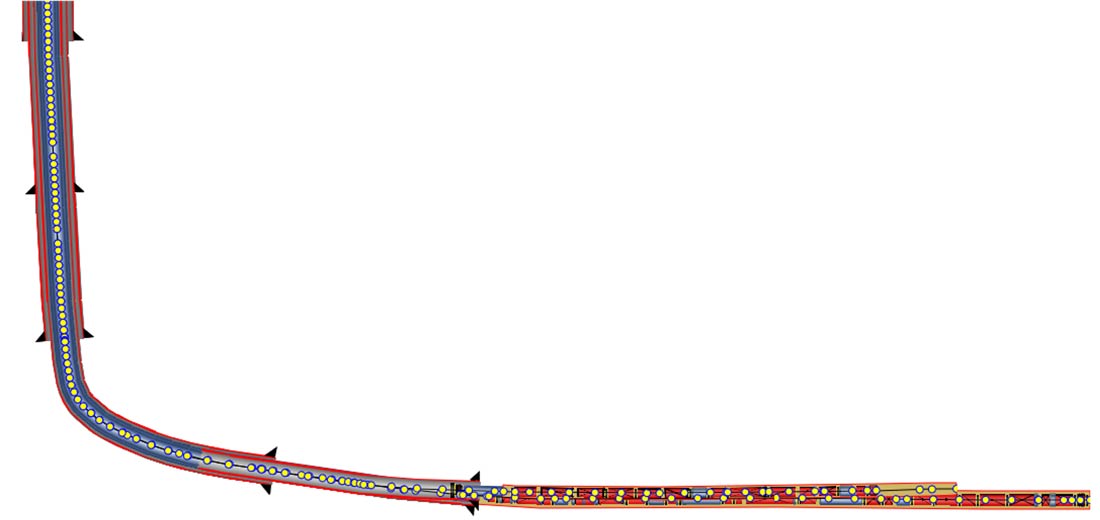
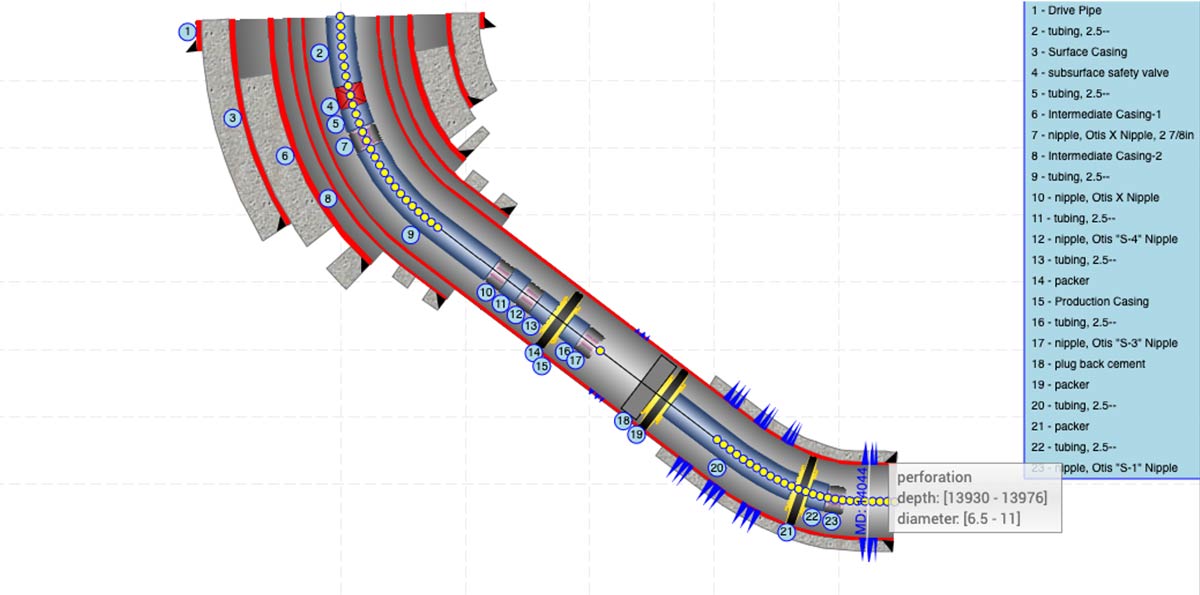


SCHEMATIC

For the Schematic package, two new widgets have been introduced: Multilateral schematics and DeviatedSchematics widgets. There is now also support for units for WellSchematics for your data model and control for different labels and annotations based on components’ IDs that have been implemented.
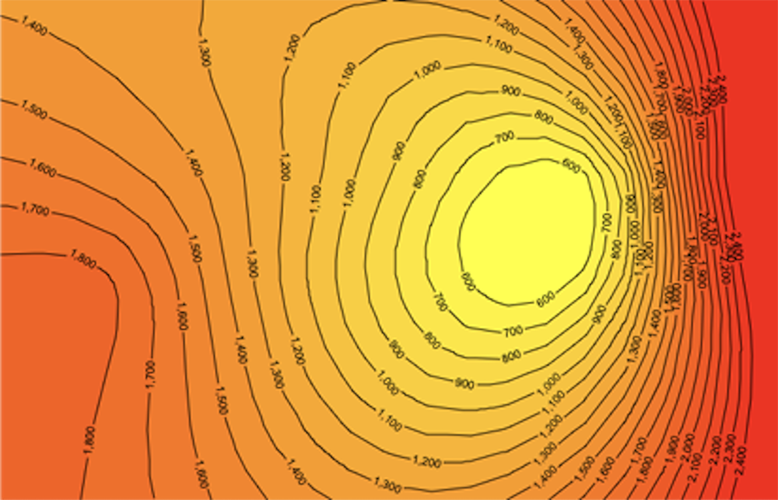


CONTOUR

Gridding algorithms Kriging and ThinPlate have been added to Contour. GeoToolkit.JS can now display one isoline from contour and support multicolor isolines.


We are excited about the release of GeoToolkit.JS 2020 and would love to show you more about it. Contact us for a free trial at info@int.com.


Filed Under: GeoToolkit Tagged With: arcgis, deviated, es5, es6, geotoolkit, multilateral

Jan 30 2023

GeoToolkit Java 3.5, Securing the Future, One Rapid Release at a Time

At INT, we support several versions of our popular developer toolkit, GeoToolkit, including JavaScript, Java, C++, and .NET. Our Java platform is perhaps a bit old, but it is certainly not dead. In fact, it is widely used in current desktop applications and server side as many cloud-based application backends rely on it.

A few years ago, we adopted a rapid release cycle for GeoToolkit Java, and since this change, the first Long-Term Support version (Java 11) was released in late 2018.

It is therefore natural that GeoToolkit Java follows the movement with its new release. Indeed, the 3.5 version is the first step of a new release cycle which will allow our users to base their applications on stable and up-to-date tools.

OpenJDK 11 Support

openjdklogoThe release of Java 11 came with changes to the Oracle license terms. Fortunately, GeoToolkit Java is now compatible with OpenJDK 11, which ensures users the possibility to base their application on a freely available and up-to-date version of the Java platform.

OpenGL 3 Pipeline

OpenGL_170px_June16GeoToolkit Java can use the OpenGL pipeline to speed up rendering. However, GeoToolkit 3.4 used the now deprecated version 2.1 of the OpenGL API. This meant that we couldn’t ensure the viability of this solution on a long-term basis, as some OpenGL implementations already lacked the 2.1 support (OSX, VMWare software implementation, etc.). As part of the new release, we prioritized an update to our OpenGL modules to use OpenGL 3 (and above), again providing a strong base for current and future applications for our customers.

For more information about GeoToolkit, visit our product page or request the latest version.


Filed Under: GeoToolkit Tagged With: geotoolkit, openGL, openJDK

May 15 2019

5 Simple Techniques to Avoid Bugs While Programming

Programming is an activity that requires a special set of cognitive skills. While the industry has developed processes and tools to ensure the quality of software artifacts, the act of writing code is a craft in itself. Developers pride themselves on the “big picture” results they achieve, but the activity of programming is definitely a humbling experience: It’s easy to introduce bugs, and regardless of whether I catch them right away or later in the pipeline, I hate to be reminded I am inherently flawed and have introduced a defect. For this article, I will focus on simple methods to avoid bugs, not before or after you write code, but while you write that code.

Leverage the Hints from the IDE

This one should be obvious to most programmers, but the reality is that the tools we use are a bit smarter than what we give them credit for. It’s easy to miss these hints. They are sometimes buried in build logs, drowned in a sea of flags, visually too subtle to attract our much-needed attention. Listen to your Integrated Development Environment (IDE)—it is telling you something.

One of the most obvious signs that something is up with your code is when the IDE tells you that you are not using a variable you introduced earlier in your code. You had some intent for this variable, but that intent got lost while working on some other aspect. There is certainly a bug lurking there.

Another useful alert is when the IDE detects that there is a logical path for a NullPointerException. Maybe the most common case is well taken care of, but there seems to be a road less-travelled to this ubiquitous exception.

The activity of writing code forces you to concentrate on the text you are typing while keeping a stack of other concerns in mind. This cognitive load is already heavy; I like to reduce it by removing ambiguities. The IDE will tell you when you are using the same variable name for an instance variable and a local variable. I don’t need to risk being confused about which one I am manipulating. I’ll follow my digital assistant’s advice and rename the local variable in question.

Break up Your Content

The brain can only keep so much information. And each coding window only shows you about 50 lines. When the code grows, so does the likelihood of bugs, just from not remembering details implemented a few invisible lines away. One simple technique to avoid such troubles is to break up the code. Keep the methods short. Ideally, a well-focused class shouldn’t have more than 200 lines. It’s not always possible, but where it is, you can avoid bugs when each class has only one responsibility. The class’ code itself is easy to review, and its function is easy to remember in other contexts. If you just wrote a large body of code in one class, it’s time to break it up into smaller pieces.

This is nothing new. When the metric of cyclomatic complexity was developed in 1976, its first applications tried to limit the complexity of each module, splitting them into smaller modules. These modules became easier to write, and easier to test, too. If the most likely place for defects is where complexity lies, reducing complexity automatically reduces the rate of defects.

It’s not just the height of your screen that matters when having “too much to code” might be “too much to cope.” The width matters, too. This is actually a classic source of bugs: a line goes beyond what’s visible without scrolling, meaning it’s not being looked at as often as other lines. Code reviewed less is more likely to be incorrect. Long lines are also bug candidates when overly confident IDEs autofill their content over the developer’s watchful eyes. The simple solution is to break up these long lines, for example, inserting carriage returns when they go over 120 characters. The IDE will often show you this limit graphically.

Use the Java Type System

Object-oriented programming is a great way to abstract sequential instructions into relationships and behaviors. The Java type system is quite powerful. When two pieces of code interact, the parameters of this interaction typically need to meet specific type requirements, so the compiler will prevent code being typed from using the wrong object type in the wrong context.

You can use this type checking to your advantage to reduce opportunities for bugs. Writing a program often requires code where mundane objects are being passed around—a collection of names, an Integer identifying a record, etc. If you inadvertently pass the wrong list of Strings, the compiler won’t be any help. Instead of passing List<String> or Integer, create your own objects, such as “NamesCollection” and “RecordId.” By forcing the passing of functional objects instead of generic ones, you will know immediately, as you type, that you just picked up the wrong collection or the wrong number.

Don’t Leave Your Code to Chance

I have seen many cases where two (or more) classes have the exact same name. They have different package names, but package names are hidden away at the very beginning of each class that uses another class. It’s a good idea to give classes unique names across your code base. This will make sure there is no ambiguity around which one a developer is using. Murphy’s law is not your friend—you will inevitably pick the wrong one otherwise.

The behavior of HashMaps may also be a source of hard-to-troubleshoot bugs. The Java Virtual Machine tends to optimize the behavior of HashMaps when the application load grows. What this means for developers is that you will observe one behavior during development, and a different behavior in production. To avoid this kind of head-scratching riddle, I have learned to use LinkedHashMaps even when not needed as they will always return entries in a consistent manner. This is a trick to use wisely: the performance cost of using LinkedHashMaps should be weighed against the risk of having to solve a problem that only happens in production.

Reuse Existing Code

At the end of the day, there is so much to keep track of, just writing code is doomed to produce bugs. The simplest way to avoid writing bugs is not write any code at all, and leverage some other battle-tested component instead.

Reusing code is the ultimate simplification technique, but I am not just talking about integrating other people’s work into your own software. The code you already have is the result of many refactorings. It has real-world experience you are missing (or that you forgot). Use the code you already have as your template. If the quality of your template is not what you need, refactor this code, then reuse it. There shouldn’t be in your program “two best patterns” to do the same thing.

As I implement a new feature, I typically look at similar code doing similar things: how classes, methods, and variables are (meaningfully) named, which properties and behaviors are exposed, how objects interact with each other, etc. In all the bodies of code I have maintained for several years, I have found that consistency is the easiest constraint to follow, to teach, and the one that brings the most benefits in terms of overall quality.

Filed Under: GeoToolkit, HTML5Viewer, INTViewer, IVAAP Tagged With: developing, IDE, java, programming

Apr 15 2019

TotalEnergies to Use INT’s Data Visualization and Analysis Platform and Libraries Software for the Next Five Years

TotalEnergies and INT have recently announced a long-term corporate agreement that will give TotalEnergies access to INT’s GeoToolkit, the most widely adopted JavaScript-based data visualization technology software in Oil and Gas.

TotalEnergies will also be able to take advantage of IVAAP, one of the leading Data Visualization software platforms for digital subsurface projects deployed in the web or private cloud.

“With the growth of Big Data and IoT, the E&P industry needed a solution that would empower companies to combine and utilize vast amounts of incredibly useful, yet disparate domain data easily, in one powerful software,” said Dr. Olivier Lhemann, founder and CEO, Interactive Network Technologies.

“Fortunately, our unique expertise and position in the industry allowed us to recognize and respond to this need quickly, so we developed IVAAP. Now, we’re proud to partner with TotalEnergies to empower domain experts with the right digital tools they need to gain valuable, timely insights from their data.”

With this agreement, TotalEnergies Exploration & Production will gain access to GeoToolkit and IVAAP’s fully extensible platform, cloud-based architecture, and comprehensive set of data connectors to current systems such as WITSML, PPDM, OSIsoft, PI, and many others.

For more information on INT’s products and services, visit our products page or email us to discuss how we can help you visualize your upstream data.

View the press release

Learn more about INT’s products


Filed Under: GeoToolkit, Uncategorized Tagged With: geotoolkit, ivaap, TotalEnergies

Feb 15 2018

How to Add Overlay to Visualize Data from ArсGIS Feature Service

GeoToolkit.JS provides a set of libraries that display seismic, log, schematic, contour, real-time data, and more, and it includes a lightweight widget to display geographical data as layers from web map tile services (WMTS) like Google Map, OpenStreetMap, ESRI, MapQuest, and others and vector data from web map feature services (WFS).

WFS services can provide data in popular formats such as GeoJSON and ArcGIS ESRI Feature Layer format, KML. In this post, we consider how to display data, which includes geometry and nonspatial information like names, from ArcGIS ESRI services using the GeoToolkit.JS Map Widget and WMTS data from OpenStreetMap. The release of GeoToolkit.JS 2.5 is a good opportunity to tour basic map options.

First, we need to have the latest version of the GeoToolkit.JS library in our system. We will use Angular framework and TypeScript to be more realistic to real-world web application. Also Angular CLI is used to simplify creation of this application. The following screenshot demonstrates a simple map application with three layers: WMTS with world map, ArcGIS Feature layer of states, and ArcGIS Feature layer of U.S. counties from public service.

Single map application

The full source code of this example can be found here on Github.

Let’s start writing application. If general initialization of Angular application is not relevant to you, then start with section 3.

Install the Necessary Software

This step can be skipped if you have Angular-cli and node.js on your computer.

Verify that you have node.js and npm in your system using the following command in console:

node -v

If installation does not exist, then go here and install the last LTS distribution.

The next step is to install the last version of Angular-cli in your system.

npm install -g @angular/cli

Create the Application

We start creation of the application using Angular-cli commands ng new

ng new ArgGISOverlay
cd ArgGISOverlay
ng serve

If it works, then create a folder called ArcGISOverlay\src\libs\geotoolkit and copy all files from the bin folder of GeoToolkit.JS installation.

Add a section in the .angular-cli.json file

“scripts”: [
“libs/geotoolkit/geotoolkit.adv.js”,
“libs/geotoolkit/geotoolkit.controls.adv.js”,
“libs/geotoolkit/geotoolkit.svg.adv.js”,
“libs/geotoolkit/geotoolkit.data.adv.js”,
“libs/geotoolkit/geotoolkit.pdf.adv.js”,
“libs/geotoolkit/geotoolkit.widgets.adv.js”,
“libs/geotoolkit/geotoolkit.map.adv.js”
],

Add a new component to display the map. Let’s call it OverlayComponent

ng g component overlay

Add CSS file to define application styles and add to styles.css

Add the following lines to app.component.html

<div class="content">
<app-overlay></app-overlay>
</div>

Add the following lines to overlay-component.html to specify HTML% canvas element to be used to render map. Parent div is used to control size of our map.

<div #parent class='plothost'>
 <canvas #map class='plot' oncontextmenu='return false'></canvas>
</div>

Add Layers

A map widget can support any number of layers. In our example, we add three layers.

The first is the WMTS layer which points to INT OpenStreetMap server.

return new geotoolkit.map.layers.WMTSLayer({
   'server': ['https://demo.int.com/osm_tiles/'],
   'minlod': 0,
   'maxlod': 19,
   'formatterfunction': function (z, x, y) {
     return z + '/' + y + '/' + x + '.png';
   }
 });

Second, add two ArcGIS overlays with data from the public URL of ArcGIS Feature Layer services. A layer initialization to load states looks like:

return new geotoolkit.map.layers.ArcGISFeatureLayer({
    'system': geotoolkit.map.GeodeticSystem.LatLon,
    'idfield': 'state_name',
    'server': service_url     
     });
};

It has three properties: the input coordinate system, unique field id, and server url. The second layer is similar.

If a source has a field, which defines a unique id of the feature, then it can be specified. This information can be found on page with service description. In our case, one layer has id, another doesn’t have it. If id is not specified, then artificial id is assigned for each feature.

In additional to geometry, each feature layer can provide nonspatial attributes. By default, layer loads all attributes for each feature. If you don’t need it, then you can declare them using property requestfields like this requestfields: [‘name’, ‘population]

In the next step, create a map widget and add three layers into it.

let map = new geotoolkit.map.Map({});
map.addLayer(this.createWMTSLayer());
map.addLayer(this.createCountiesLayer());
map.addLayer(this.createStatesLayer());

The last step is to initialize GeoToolkit.JS plot to render map layers on underlying HTML5 Canvas element, and the application is ready.

Customize the Feature Layer

In this section, we show how to change the graphical properties of the loaded Feature Layer. For example, we would like to color counties based on population. We just use one attribute of the counties layer “pop2000”, which represents a population of each county in 2000. A feature in ArcGISFeatureLayer can be rendered with shape template, which can be polygon, polyline, symbol, or any custom representation. For example, pie chart.

As a rule, it has only one instance of template for the sample type of features. In our case, we sort existing features by population and replace shape template, which is responsible for rendering particular features with custom shape with specified attributes. The result of this operation can be seen if you press the “Classify” button on the toolbar of this application. The source code looks like this:

this.countiesLayer.setTemplate(country, template);

We tell the application to use a new template for this feature instance. This application can be optimized if we group features by colors, but we will save that for a future post.

For more information about GeoToolkit, visit the GeoToolkit product page, or contact us for a free trial.


Filed Under: GeoToolkit Tagged With: arcgis, geotoolkit

  • « Go to Previous Page
  • Page 1
  • Page 2
  • Page 3

Footer

Solutions

  • Real-Time Visualization
  • Visualization Components
  • New Energy Visualization
  • OSDU Visualization
  • Machine Learning
  • Developer Tools
  • Cloud Partners
  • Customer Success Stories

Products

  • IVAAP
  • GeoToolkit
  • INTViewer
  • IVAAP Demos
  • GeoToolkit Demos

About

  • News
  • Events
  • Careers
  • Management Team

Resources

  • Blog
  • FAQ

Support

  • JIRA
  • Developer Community

Contact

INT logo
© 1989–2024 Interactive Network Technologies, Inc.
Privacy Policy
  • Careers
  • Contact Us
  • Search

COPYRIGHT © 2025 INTERACTIVE NETWORK TECHNOLOGIES, Inc