• Skip to main content
  • Skip to footer

INT

Empowering Visualization

COMMUNITY BLOG
CONTACT US SUPPORT
MENUMENU
  • Solutions
    • Overview
    • Real-Time Visualization
    • Visualization Components
    • New Energy Visualization
    • OSDU Visualization
    • Machine Learning
    • Developer Tools
    • Cloud Partners
  • Products
    • IVAAP™
          • SOLUTIONS

            Real-Time Visualization

            OSDU Visualization

            Visualization Components

            New Energy Visualization

            Upstream Data Visualization

          • SUCCESS STORIES

            WEATHERFORD
            Well delivery optimization software

            BARDASZ
            Data management, data quality monitoring

            ANPG / SATEC-MIAPIA
            Virtual data room

            MAILLANCE
            High-performance visualization of ML algorithms

            SEE ALL >

          • SUPPORT

            DEVELOPER COMMUNITY
            Join or log in to the INT Developer Community.

            GET SUPPORT
            Log a ticket for an issue or bug.

            CONTACT US

          • DEMOS

            IVAAP DEMOS
            Cloud-Based Demos

            FIRST TIME HERE?
            Register to access our
            IVAAP demos

    • GeoToolkit™
          • SUCCESS STORIES

            CAYROS
            Field development planning

            TOTALENERGIES
            High-performance large dataset reservoir rendering

            IFP ENERGIES NOUVELLES
            Seismic and structural interpretation validation

            SEE ALL >

          • SUPPORT

            DEVELOPER COMMUNITY
            Join or log in to the INT Developer Community.

            GET SUPPORT
            Log a ticket for an issue or bug.

            CONTACT US

          • DEMOS

            GEOTOOLKIT DEMOS
            Geoscience Demos

    • INTViewer™
          • SUCCESS STORIES

            STRYDE
            Fast seismic QA/QC in the field

            SILVERTHORNE SEISMIC
            Efficient 2D/3D seismic data delivery

            WIRELESS SEISMIC
            Drones, IoT, and Advanced Onsite Seismic Data Validation

            SEE ALL >

          • SUPPORT

            GET SUPPORT
            Log a ticket for an issue or bug.

            CONTACT US

          • PLUG-INS

            EXTEND INTVIEWER
            More than 65 plugins available

  • Demos
    • GeoToolkit Demos
    • IVAAP Demos
  • Success Stories
  • Resources
    • Blog
    • Developer Community
    • FAQ
    • INT Resources Library
  • About
    • Overview
    • News
    • Events
    • Careers
    • Meet Our Team
    • About INT

IVAAP

Jul 06 2021

Rethinking ML Integration to Deliver a User Experience with a True End-to-End Geoscience Workflow

For E&P companies, the next challenge in their digital transformation — once their data has been properly stored, indexed, enriched, and cataloged in the cloud — is to make it available in a collaborative way where users can easily interact with the data through exploration, computation, and analysis. To create this digital workspace, companies must fully integrate machine learning, along with advanced data visualization, in a single platform where users can search, select data from multiple data sources, execute models, and visualize the results.

Accelerating the Transition from R&D to Operations
While many companies have begun the shift toward using machine learning, many have not seamlessly integrated ML. Implementing ML is the goal, but many get stuck along the way, weighed down by cumbersome processes or siloed systems. So the first challenge is transitioning the ML process from R&D to operations, where the model is fully deployed and used by data scientists.

ML-chart
Source: World Wide Technology


In a typical process, once the data is prepared and cleaned, it is split and labeled for training in order to understand whether the model is working properly or not. Then the model is moved into operations, data is fed into it, and finally, the user can see the output. The process from development to production, R&D to operations is very, very slow, even with continuous integration and deployment pipelines. This is where a centralized solution can help to eliminate the need to move data from one system to another or have to build another application to consume, compute, and visualize the data.

Screen Shot 2021-07-06 at 2.55.27 PM
SOURCE: State of Data Science 2020. Anaconda. www.anaconda.com/state-of-data-science-2020.

The Drivers for Centralizing Data Exploration, ML Execution, and Domain Visualization
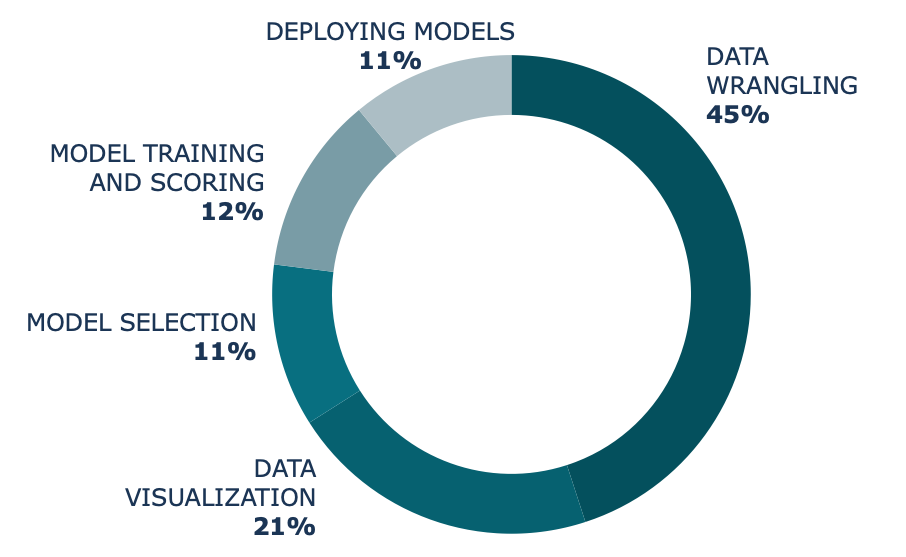
Integrating machine learning into geoscience workflows has traditionally posed many challenges for data scientists, from siloed, incomplete data to disjointed, disconnected systems. Even now, once geoscientists spend up to 45% of their time ensuring that the data is uniform, organized, and labeled correctly, they must then switch to another application to execute the model, another to view the results, and yet another to share the results with their team. By combining these processes in one place, companies can get the most from their data — the most accurate models, with the most accurate business insights.


The Emergence of New Visualization Technologies Leveraging ML to Power Data-Driven Decisions
For true ML integration, companies are challenged to rethink the user experience and find a way to utilize a single platform that can simplify this process, from collecting and cleaning data to training and evaluating the model to using the model to power data-driven business decisions. This is why many companies are looking at “re-platforming” existing apps or simply rebuilding new apps that can combine features spread across multiple applications. However, companies do not need to go down that path anymore with the emergence of a new generation of data visualization cloud-native platforms such as IVAAP.

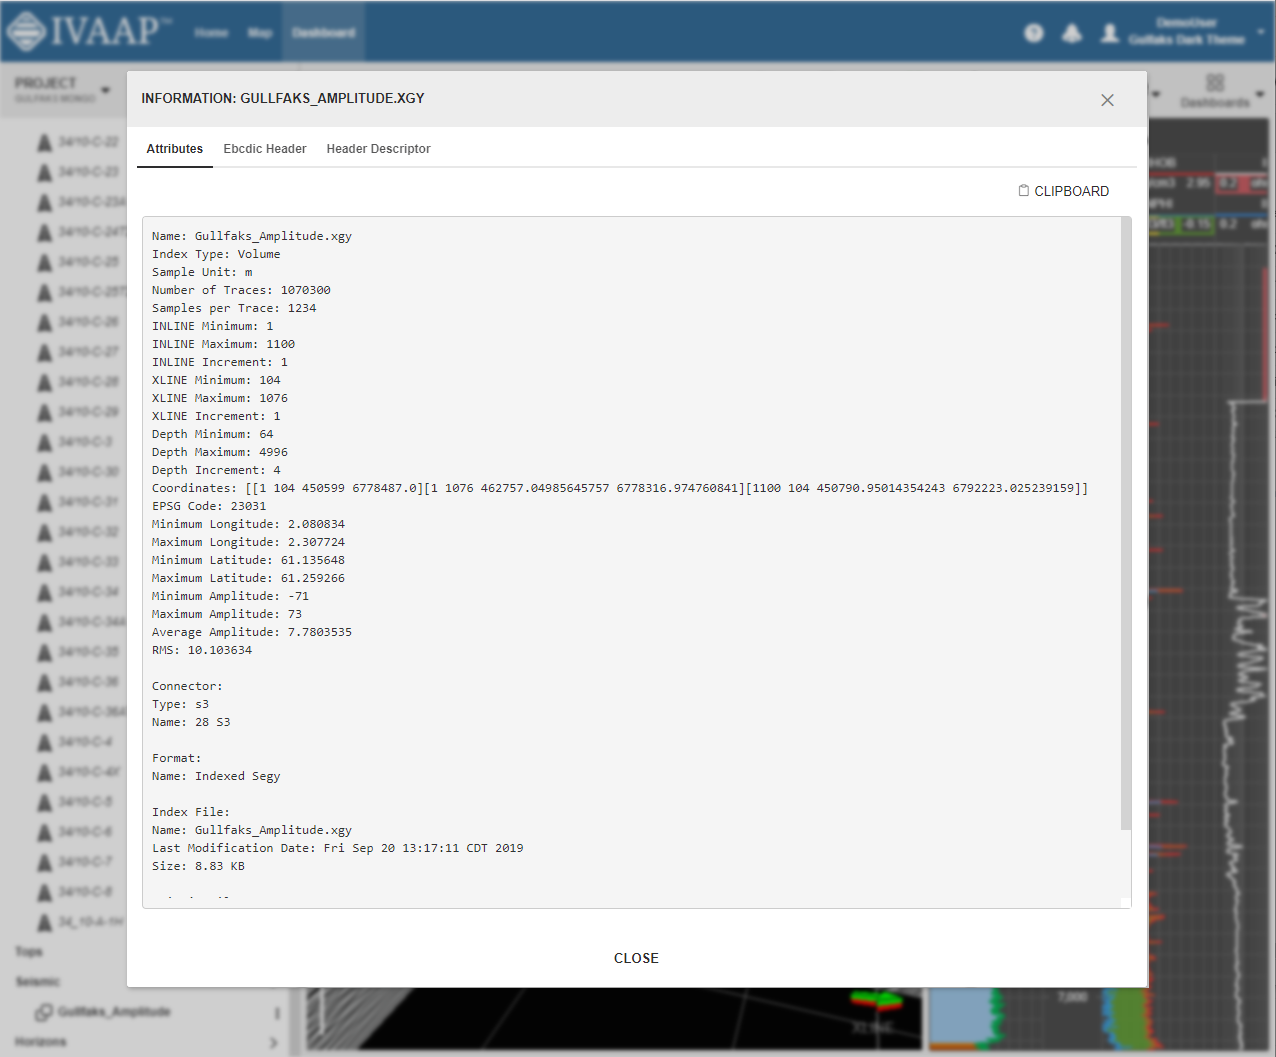
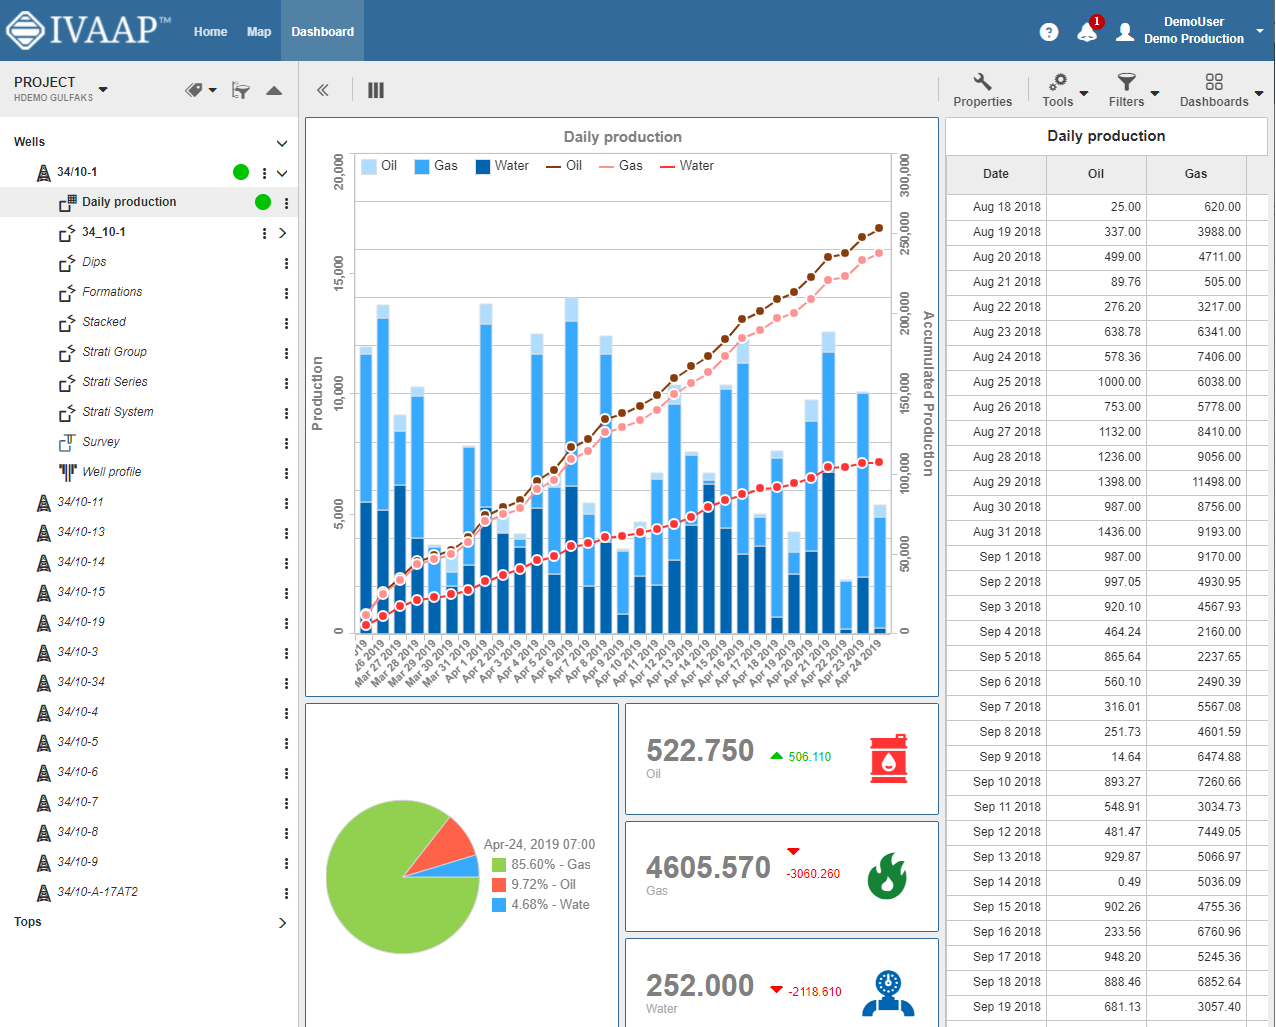
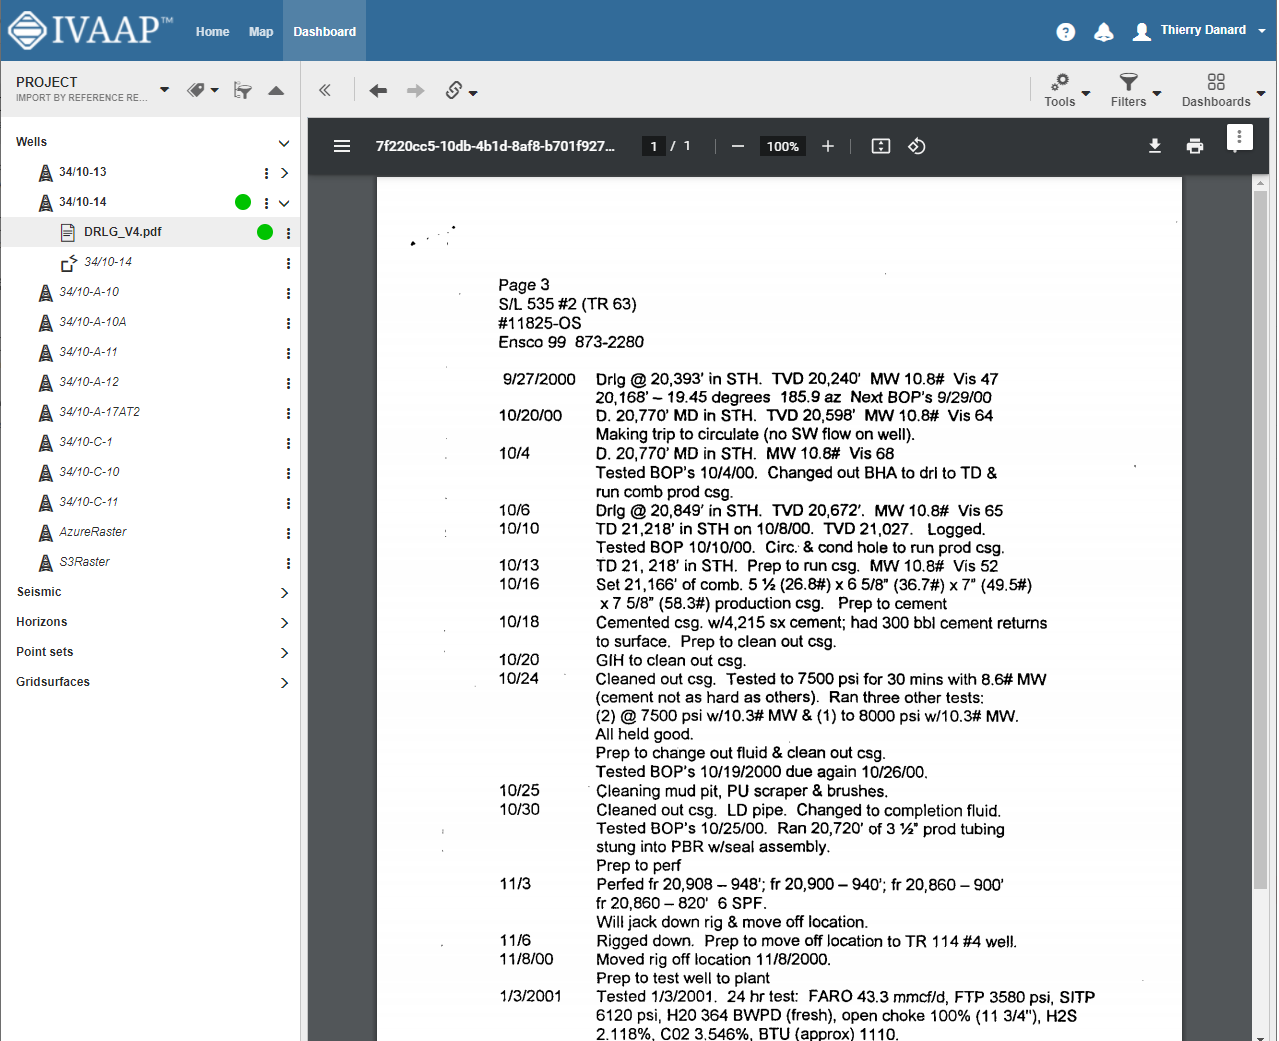
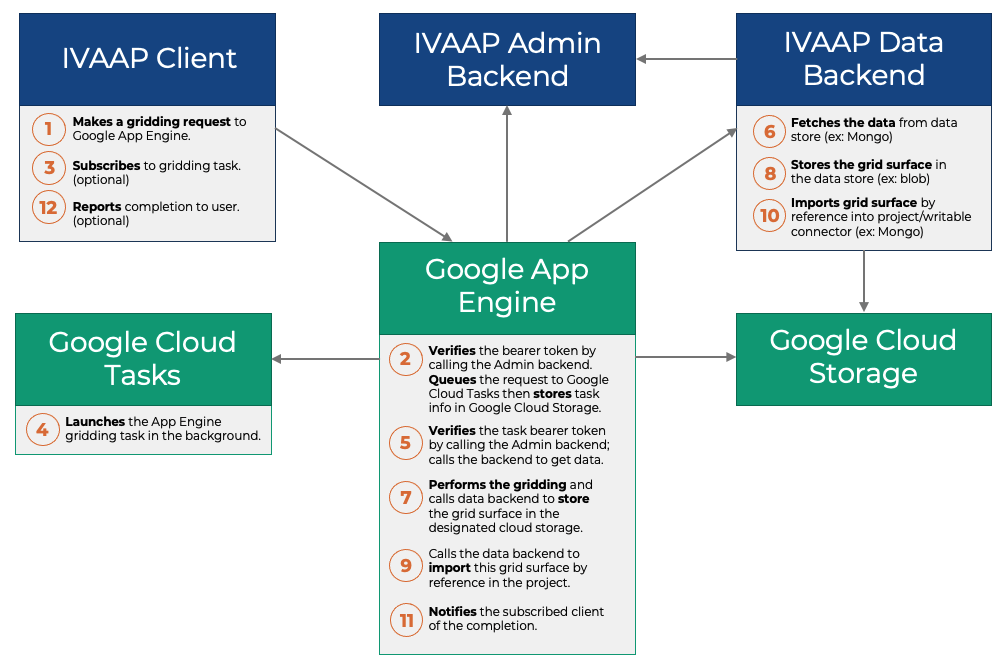
IVAAP is a new way to connect the dots. The cloud-native client is creating a single place for users such as geoscientists and data scientists to conduct all necessary steps in MLOps: data exploration, ML execution, and visualization. The platform offers a digital workspace connecting to the various back-end systems seamlessly for end-end users.

Screen Shot 2021-07-06 at 8.50.54 AM
INT’s IVAAP integrates with ML Service and Data Storage


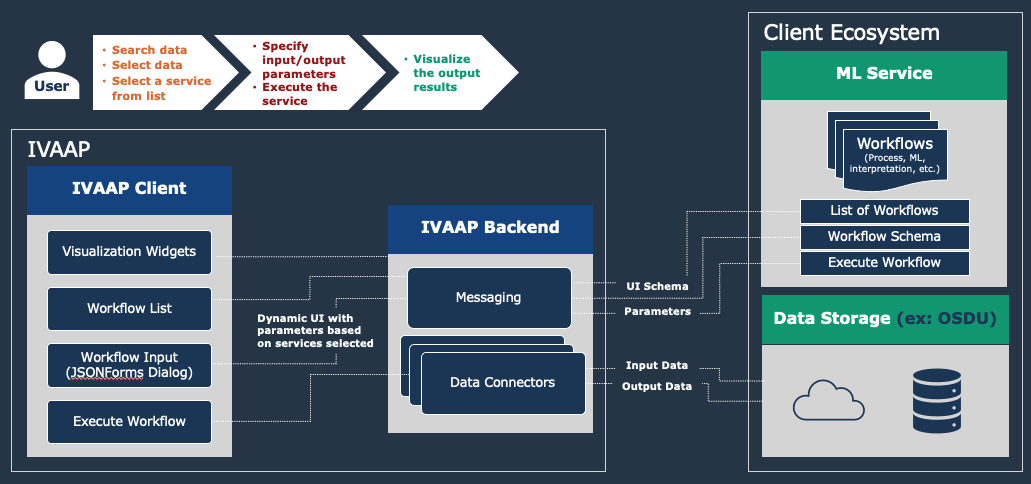
In the example above, the user can access search functions, data sources, and various ML environments such as AWS SageMaker to create a true end-to-end machine learning integration. Streamlining and simplifying the geoscience workflow starts with the end-user experience: the user can be presented with specific data input/output dynamically based on the processing function or ML programs he is executing. IVAAP’s dynamic UI delivers a powerful way for data scientists to execute ML in geoscience.

If you are interested in learning more, you can also check out the recent AWS/INT webinar for a deeper dive into how the technology works, dynamic UI, and ML integration.

Learn more about IVAAP here or contact us at info@int.com.


Filed Under: IVAAP Tagged With: data visualization, ivaap, machine learning, streamline workflows

Jun 17 2021

How to Extend the IVAAP Data Model with the Backend SDK

The IVAAP Data Backend SDK’s main purpose is to facilitate the integration of INT customers’ data into IVAAP. A typical conversation between INT’s technical team and a prospective customer might go like this:

Can I visualize my data in IVAAP?

Yes, the backend SDK is designed to make this possible, without having to change the UI or even write web services.

What if my data is stored in a proprietary data store?

The SDK doesn’t make any assumptions on how your data is stored. Your data can be hidden away behind REST services, in a SQL database, in files, etc.

What are the steps to integrate my data?

The first step is to map your data model with the IVAAP data model. The second step is to identify, for each entity of that data model, how records are identified uniquely. The third step is to plug your data source. The fourth and final step is to implement, for each entity, the matching finders.

What if I want to extend the IVAAP data model?

My typical answer to this last question is “it depends”. The SDK has various hooks to make this possible. Picking the right “hook” depends on the complexity of what’s being added.

Using Properties

The IVAAP data model was created after researching the commonalities between the industry data models. However, when we built it, we kept in mind that each data store carries its own set of information, information that is useful for users to consume. This is why we made properties a part of the data model itself. From an IVAAP SDK point of view. Properties is a set of name-value pairs that you can associate with specific entities within the IVAAP Data Model.

For example, if a well dataset is backed by an .LAS file in Amazon S3 or Microsoft Azure Blob Storage, knowing the location of that file is a valuable piece of information as part of a QC workflow. But not all data stores are backed by files, a file location is not necessarily relevant to a user accessing data from PPDM. As a result, the set of properties shown when opening a dataset backed by Azure will typically be different from a set coming from PPDM, even for the same well.


properties dialog example
An example of properties dialog, showing multiple properties of a seismic dataset stored in Amazon S3.


Calling the properties a set of name-value pairs does not do justice to its flexibility. While a simple name+value is the most common use, you can create a tree of properties and attach additional attributes to each name-value pair. The most common additional attribute is a unit, qualifying the value to make this property more of a measurement.  Another attribute allows name-value pairs to be invisible to users. The purpose of invisible properties is to facilitate the integration with other systems than the IVAAP client. For example, while a typical user might be interested in the size of a file, this size should be rounded and expressed in KB, MB or GB. An external software consuming the IVAAP Properties REST services would need the exact number of bytes.

One of the benefits of using properties to carry information is that it’s simple to implement your own property finder, and it requires no additional work. No custom REST services to write, and no widget to implement to visualize these properties. The IVAAP HTML5 client is designed to consume the IVAAP services of the data backend, and show these properties in the UI.

Adding Your Own Tables and Documents

One of the limitations of properties is they don’t provide much interaction. Users can only view properties. The simplest way to extend the IVAAP model in a way that users can interact with that data is to add tables. For example, the monthly production of a well is an easy table  to make accessible as a node under a well. Once the production of a well is accessible as a table, users have multiple options to graph this production: as a 2D Plot, as a pie chart, as an histogram, etc. And this chart can be saved as part of a dashboard or a template, making IVAAP a portal.

The IVAAP Data Backend SDK has been designed to make the addition of tables a simple task. Just like for properties, the HTML5 Viewer of IVAAP doesn’t need to be customized to discover and display these tables. It’s the services of the data backend that direct the viewer on how to build the data tree shown to users. And while the data backend might advertise many reports, only non-empty reports will be shown as nodes by the viewer. 


tabular reports
An example of tabular reports related to a well.


In the many customization projects that I’ve been involved in, the tabular features of IVAAP have been used the most. I have seen dozens of reports under wells. The IVAAP Data Backend makes no assumptions about where this production data is stored relative to where the well is stored. For example, you can mix the schematics from Peloton WellView with the production reports from Peloton ProdView. From a user point of view, the source of the data is invisible, IVAAP combines the data from several sources in a transparent way. Extending the IVAAP data model doesn’t just mean exposing more data from your data source, it also means enriching your data model with data from other sources.

Data enrichment is sometimes achieved just by making accessible the documents associated with a well. For example, for Staatsolie’s portal, the IVAAP UI was giving direct access to the documentation of a well, stored in Schlumberger’s ESearch.


PDF document related to a well
An example of PDF document related to a well.


Adding Your Own Entities and Services

When data cannot be expressed as properties, tables or documents, the next step is to plug your own model. The API of the Backend SDK makes it possible to plug your own entities under any existing entity of the built-in data model. In this use case, not only code to access data needs to be developed, but also code to expose this data to the viewer. The IVAAP data model is mature, so this is a rare occurrence.

There are hundreds of services implemented with the IVAAP Data Backend SDK, developers who embark on a journey involving adding their own data types can be reassured by the fact that the path they follow is the same path the INT developers follow every day as we augment the IVAAP data model. INT makes use of its own SDK every day.


IVAAP Data Backend SDK Homepage
Home page of the website dedicated to the IVAAP Data Backend SDK.


Whether IVAAP customers need to pepper the IVAAP UI with proprietary properties or their own data types, these customers have options. The SDK is designed to make extensions straightforward, not just for INT’s own developers, but for INT customers as well. You do not need to contract INT’s services to roll your own extensions. You can, but you don’t have to. When IVAAP gets deployed, we don’t just give you the keys to IVAAP as an application, we also give you the keys to IVAAP as a platform, where you can independently control its capabilities.

For more information on IVAAP, please visit int.flywheelstaging.com/products/ivaap/


Filed Under: IVAAP Tagged With: backend, data, html5, ivaap, SDK

May 20 2021

Deploying IVAAP Services to Google App Engine

One of the productivity features of the IVAAP Data Backend SDK is that the services developed with this SDK are container-agnostic. Practically, it means that a REST service developed on your PC using your favorite IDE and deployed locally to Apache Tomcat will run without changes on IVAAP’s Play cluster.

While the Data Backend SDK is traditionally used to serve data, it is also a good candidate when it comes to developing non-data-related services. For example, as part of IVAAP 2.8, we worked on a gridding service. In a nutshell, this service computes a grid surface based upon the positions of a top across the wells of a project. When we tested this service, we didn’t deploy it to IVAAP’s cluster; it was deployed as a standalone application, as a servlet, on a virtual machine (VM).

Deploying Apache Tomcat on a virtual machine is “old school”. Our customers are rapidly moving to the cloud, and while VMs are often a practical choice, other options are sometimes available. One of these options is Google App Engine. Google App Engine is a bit of a pioneer of cloud-based deployments. It was the first product that allowed servlet deployments that scale automatically, without having to worry about the underlying infrastructure of virtual machines. This “infinite” scalability comes with quite a few constraints, and I was curious to find out whether services developed with the IVAAP Data Backend SDK could live within these constraints (spoiler alert: it can).

Synchronous Servlet Support

The first constraint was the lack of support for asynchronous servlets. Google App Engine doesn’t support asynchronous servlets and the IVAAP servlet shipped with the SDK is strictly asynchronous. Supporting the synchronous requirements of Google App Engine didn’t take much time. The main change was to modify the concrete implementation of
com.interactive.ivaap.server.servlets.async.AbstractServiceRequest.waitForResponse
and wait on a java.util.concurrent.CountDownLatch instead of calling javax.servlet.startAsync().

Local File Access

The second constraint was the lack of a local file system. Google App Engine doesn’t let developers access the local files of the virtual machine where an application is deployed. The IVAAP Data Backend SDK typically doesn’t make much use of the local file system, except at startup when it reads its service configuration. To authorize users, the services developed with the IVAAP Data Backend SDK need to know how to validate Bearer tokens, and this validation requires the knowledge of the host name of the IVAAP Admin Backend. The Admin Backend exposes REST services for the validation of Bearer tokens. To support Google App Engine, I had to make the discovery of these configuration files pluggable so that they can be read from the WEB-INF directory of the servlet instead of a directory external to that servlet.

Persistence Mechanism

The third constraint was the lack of persistence. Google App Engine doesn’t provide a way to “remember” information between two HTTP calls. To effectively support computing services, a REST API cannot make an HTTP client “wait” for the completion of this computing. The computation might take minutes, even hours. The REST API of a computing service has to give a “ticket” number back to the client when a process starts, and provide a way for this client to observe the progress of that ticket, all the way to the completion. In a typical servlet deployment, there are many options to achieve this: the service can use the Java Heap to store the ticket information or use a database. To achieve the same result with Google App Engine, I needed to pick a persistence mechanism. For simplicity’s sake, I picked Google Cloud Storage. The state of each ticket is stored as a file in that storage. 

Background Task Executions

The fourth constraint was the lack of support for background executions. Google App Engine by itself doesn’t allow processes to execute in the background. Google however provides integration with another product called Google Cloud Tasks. Using the Google Cloud Tasks API, you can submit HTTP requests to a queue, and Google Cloud Tasks will make sure these requests get executed eventually. Essentially, when the gridding service receives an HTTP request, it creates a ticket number, submits this HTTP request immediately to Google Cloud Tasks, which in turn calls back Google App Engine. The IVAAP service recognizes that the call comes from Google Cloud Tasks and stores the result to a file in Google Cloud Storage instead of the servlet output stream. It then notifies the client that the process has completed.

Here’s a diagram that describes the complete workflow: 

INT_GCP_Workflow

Constraints and Considerations

While the SDK did provide the API to implement this workflow out of the box, getting this to work took a bit of time. I had to learn 3 Google products at once to get it working. Also, I encountered obstacles that I will share here so that other developers benefit:

  1. The first obstacle was that the Java SDK for Google App Engine requires the Eclipse IDE. There is no support for the NetBeans IDE. I am more proficient with NetBeans.
  2. The second obstacle was that I had to register my Eclipse IDE with Google so I can deploy code from that environment. It just happened that that day, the Google registration server was having issues, blocking me from making progress.
  3. The third obstacle was the use of Java 8. The Google Cloud SDK required Java 8, but Eclipse defaulted to Java 11. It took me a while to understand the arcane error messages thrown at me.
  4. The fourth obstacle was that I had to pick a flavor of Google App Engine, either “Standard” or “Flexible”. The “Standard” option is cheaper to run because it doesn’t require an instance running at all times. The “Flexible” option has less warmup time because there is always at least one instance running. There are many more differences, not all of them well documented. The two options are similar, but do not share the same API. You don’t write the same code for both environments. In the end, I picked the “Standard” option because it was the most constraining, better suited to a proof of concept.
  5. The fifth obstacle was the confusion due to the word “Promote” used by the Google SDK when deploying an instance. In this context, “Promote” doesn’t mean “advertising”, it means “production”. For a while, I couldn’t figure out why my application wouldn’t show any changes where I expected them. The answer was that I didn’t “promote” them.
  6. The last obstacle was the logging system. Google has a “Google Logging” product to access logs produced by your application. Logging is essential to debugging unruly code that you can’t run locally. Despite several weeks of use, I still haven’t figured out how this product really works. It is designed to be used to monitor an application in production, not so much for debugging. Debugging with logs is difficult. There might be several reasons why you can’t find a log. The first possibility is that the code doesn’t go where you think it’s going, and the log is not produced. The second possibility is that the log was produced, but I am too impatient, there is a significant delay and it hasn’t shown up yet. The third possibility is that it has shown up, but is nested inside some obscure hierarchy, and you won’t see it unless you expand the entire tree of logs. The log search doesn’t help much and has some strange UI quirks. I found that the most practical way to explore logs is to download them locally, then use the search capabilities of a text editor. Because the running servlet is not local to your development environment, debugging a Google App Engine application is a time-consuming activity.

In the end, the IVAAP Data Backend SDK passed this proof of concept with flying colors. Despite the constraints and obstacles of the environment, all the REST services that were written with the IVAAP Cluster in mind are compatible with Google App Engine, without any changes. Programming is hard, it’s an investment in time and resources. Developing with the IVAAP Data Backend SDK preserves your investment because it makes a minimum amount of assumptions on how and where you will run this code.

For more information or for a free demo of IVAAP, visit int.com/products/ivaap/.


Filed Under: IVAAP Tagged With: API, cloud, Google, Google App Engine, ivaap, SDK

May 11 2021

IVAAP Data Visualization Platform Unlocks the Power of Energy Data with New Connector for Machine Learning and Processing Services

Rapidly connect IVAAP to ANY processing service or model to give end-users instant control over input/output, execution, and visualization of their data science.

Houston, TX — May 11, 2021 —INT is pleased to announce the newest release of its enterprise data visualization platform, IVAAP™ 2.8. This release includes new, game-changing machine learning capabilities utilizing IVAAP’s services-based architecture to quickly plug new processes and workflows into IVAAP’s data visualization admin. 

As energy companies are in the process of ingesting data and migrating to the cloud to empower search and work with their energy data, one key piece — leveraging machine learning and processing — becomes even more important to help them automate their workflows. 

IVAAP can now connect to any machine learning or processing service, allowing users to execute a complete, end-to-end workflow all in one platform. For data scientists, this means they can easily connect the dots — they can consume data, trigger and execute processing or machine learning models in a simple way, and visualize the results of their data science quickly. Once complete, the workflow can write the results back to the selected cloud storage and the output can be visualized instantly. 

Product owners can offer their end users a robust, web-based platform with a dynamic UI leveraging self-describing JSON technology to generate dialogs on the fly without a costly rebuild or time-intensive redeploy. These model dialogs mean users can select relevant data and parameters, start processing, and visualize the process output, all in one platform. 


“Machine learning and AI are at the forefront of the current data revolution, so it was important for us to explore and create new ways to interact with data science and deliver intuitive user experience that developers can easily build,” said Hugues Thevoux-Chabuel, Vice President, Cloud Solutions at INT. “Many of our clients have asked how to easily connect to their existing models and programs to consume their data without having these services hard-coded and difficult to invoke and maintain.”


This IVAAP release also features a new basemap widget, a reporting widget, improvements to IVAAP’s schematics display, including new 2D deviated schematics plus additional visualization in 3D, such as perforations, casing, casing shoe, and tubing. IVAAP supports integration with all major cloud providers — AWS, Microsoft Azure, Google Cloud Platform, and IBM — and supports on-premise installations. 

IVAAP is an upstream visualization platform that enables search and visualization of energy, geophysical and production data in the cloud. It allows product owners, developers, and architects to rapidly build next-level subsurface digital solutions anywhere without having to start from scratch. 

Read the press release on PRWeb.

For more information, please visit int.flywheelstaging.com or contact us at intinfo@int.com.

Visit us online at int.com/ivaap for a preview of IVAAP or for a demo of INT’s other data visualization products. 


____________

ABOUT INT:

INT software empowers the largest energy and services companies in the world to visualize their complex subsurface data (seismic, well log, reservoir, and schematics in 2D/3D). INT offers a visualization platform (IVAAP) and libraries (GeoToolkit) developers can use with their data ecosystem to deliver subsurface solutions (Exploration, Drilling, Production). INT’s powerful HTML5/JavaScript technology can be used for data aggregation, API services, and high-performance visualization of G&G and petrophysical data in a browser. INT simplifies complex subsurface data visualization.

For more information about IVAAP or INT’s other data visualization products, please visit https://int.flywheelstaging.com.

INT, the INT logo, and IVAAP are trademarks of Interactive Network Technologies, Inc., in the United States and/or other countries.

Filed Under: IVAAP, Press Release Tagged With: cloud, connector, energy, machine learning, subsurface data visualization

Apr 15 2021

INT to leverage IBM, Red Hat Open Technologies to Enhance Efficiencies in Oil & Gas Exploration and Drilling Workflows

The latest version of INT’s data visualization platform, IVAAP, integrates with IBM Open Data for Industries, IBM’s hybrid cloud implementation of the Open Group OSDU data.

HOUSTON, TX — April 15, 2021 — INT today announced that IVAAP — a leading enterprise subsurface data visualization platform — integrates with IBM Open Data for Industries for Cloud Pak for Data built on Red Hat OpenShift. These open technologies will enable the upstream industry to visualize exploration and drilling data across hybrid cloud environments to drive efficiencies and speed decision making.

As the oil and gas industry undergoes unparalleled transformation, members of the value chain are seeking solutions to maximize digital opportunities across their operations. Data is a critical asset and when leveraged with artificial intelligence, can yield mission-critical insights and competitive advantage.  However, quite often, domain-specific data exists in silos — limiting workflow efficiencies that leverage data insights for real-time decision-making.

Today’s announcement focuses on open technologies for the IVAAP platform that remove these barriers:

  • IVAAP leverages IBM Open Data for Industries for IBM Cloud Pak for Data, a data platform enabling seamless integration of data sources with the flexibility to deploy across any infrastructure that leverages The Open Group OSDU Forum data standard. The Open Group OSDU Forum is an industry organization that brings together technology leaders, producers and members of the oil and gas value chain to build a data foundation based on data standards making subsurface data easier to find, combine, and use across geoscience workflows.
  • IVAAP integrates with IBM Open Data for Industries for IBM Cloud Pak for Data powered by Red Hat OpenShift, the industry’s leading open source Kubernetes platform. This will enable INT customers to run IVAAP on-premise, unlocking speed and agility for local operations as well as remote locations through the cloud, yet all with one consistent architecture. This provides upstream operators greater value and flexibility for real-time operational decision-making, as well as consistency to the enterprise operations.

“We are extremely excited about the work we are engaging in with The Open Group OSDUTM Forum and our collaboration with IBM. For clients who manage hybrid cloud environments, our goal is to bring the technology to where they need it — in the cloud and in their locally hosted environment.”

— Olivier Lhemann, President of INT.


“Our collaboration with INT enables choice and flexibility in deploying subsurface data visualization across hybrid cloud environments. By leveraging IBM Open Data for Industries for IBM Cloud Pak for Data, INT and the oil and gas community can leverage an enterprise-grade, open-source platform based on the OSDU data foundation, improving access to subsurface data across any infrastructure, including public cloud, local country cloud and on-prem,” says Dariusz Piotrowski, Global Solutions Leader,
IBM Industrial Sector.

IVAAP is a sophisticated domain visualization and analytics platform that provides central access to data regardless of where it is — stored in the cloud and on-premise. Users can access, view, search, visualize, and analyze their subsurface data — wellbore, seismic, schematics, log, and more — in a web browser.

About INT:

INT software empowers the largest Oil & Gas (IOC/NOC) and services companies in the world to visualize their complex subsurface data (seismic, well log, reservoir, and schematics in 2D/3D). INT offers a visualization platform (IVAAP) and libraries (GeoToolkit) developers can use with their data ecosystem to deliver subsurface solutions (Exploration, Drilling, Production). INT’s powerful HTML5/JavaScript technology can be used for data aggregation, API services, high-performance visualization of G&G and petrophysical data in a browser. INT simplifies complex subsurface data visualization.

Read the press release on PRWeb.

For more information about IVAAP or INT’s other data visualization products, please visit https://int.flywheelstaging.com.

INT, the INT logo, and IVAAP are trademarks of Interactive Network Technologies, Inc., in the United States and/or other countries.

Red Hat, the Red Hat logo and OpenShift are trademarks or registered trademarks of Red Hat, Inc. or its subsidiaries in the U.S. and other countries.


Filed Under: IVAAP, Press Release Tagged With: IBM, ivaap, log, OSDU, schematics, seismic, subsurface data visualization, wellbore

  • « Go to Previous Page
  • Page 1
  • Interim pages omitted …
  • Page 3
  • Page 4
  • Page 5
  • Page 6
  • Page 7
  • Interim pages omitted …
  • Page 10
  • Go to Next Page »

Footer

Solutions

  • Real-Time Visualization
  • Visualization Components
  • New Energy Visualization
  • OSDU Visualization
  • Machine Learning
  • Developer Tools
  • Cloud Partners
  • Customer Success Stories

Products

  • IVAAP
  • GeoToolkit
  • INTViewer
  • IVAAP Demos
  • GeoToolkit Demos

About

  • News
  • Events
  • Careers
  • Management Team

Resources

  • Blog
  • FAQ

Support

  • JIRA
  • Developer Community

Contact

INT logo
© 1989–2024 Interactive Network Technologies, Inc.
Privacy Policy
  • Careers
  • Contact Us
  • Search

COPYRIGHT © 2025 INTERACTIVE NETWORK TECHNOLOGIES, Inc