• Skip to main content
  • Skip to footer

INT

Empowering Visualization

COMMUNITY BLOG
CONTACT US SUPPORT
MENUMENU
  • Solutions
    • Overview
    • Real-Time Visualization
    • Visualization Components
    • New Energy Visualization
    • OSDU Visualization
    • Machine Learning
    • Developer Tools
    • Cloud Partners
  • Products
    • IVAAP™
          • SOLUTIONS

            Real-Time Visualization

            OSDU Visualization

            Visualization Components

            New Energy Visualization

            Upstream Data Visualization

          • SUCCESS STORIES

            WEATHERFORD
            Well delivery optimization software

            BARDASZ
            Data management, data quality monitoring

            ANPG / SATEC-MIAPIA
            Virtual data room

            MAILLANCE
            High-performance visualization of ML algorithms

            SEE ALL >

          • SUPPORT

            DEVELOPER COMMUNITY
            Join or log in to the INT Developer Community.

            GET SUPPORT
            Log a ticket for an issue or bug.

            CONTACT US

          • DEMOS

            IVAAP DEMOS
            Cloud-Based Demos

            FIRST TIME HERE?
            Register to access our
            IVAAP demos

    • GeoToolkit™
          • SUCCESS STORIES

            CAYROS
            Field development planning

            TOTALENERGIES
            High-performance large dataset reservoir rendering

            IFP ENERGIES NOUVELLES
            Seismic and structural interpretation validation

            SEE ALL >

          • SUPPORT

            DEVELOPER COMMUNITY
            Join or log in to the INT Developer Community.

            GET SUPPORT
            Log a ticket for an issue or bug.

            CONTACT US

          • DEMOS

            GEOTOOLKIT DEMOS
            Geoscience Demos

    • INTViewer™
          • SUCCESS STORIES

            STRYDE
            Fast seismic QA/QC in the field

            SILVERTHORNE SEISMIC
            Efficient 2D/3D seismic data delivery

            WIRELESS SEISMIC
            Drones, IoT, and Advanced Onsite Seismic Data Validation

            SEE ALL >

          • SUPPORT

            GET SUPPORT
            Log a ticket for an issue or bug.

            CONTACT US

          • PLUG-INS

            EXTEND INTVIEWER
            More than 65 plugins available

  • Demos
    • GeoToolkit Demos
    • IVAAP Demos
  • Success Stories
  • Resources
    • Blog
    • Developer Community
    • FAQ
    • INT Resources Library
  • About
    • Overview
    • News
    • Events
    • Careers
    • Meet Our Team
    • About INT

IVAAP

Aug 18 2020

Weatherford, INT Expand Collaboration to Create 2D, 3D Real-Time Well Visualization

INT’s IVAAP framework provides next-level real-time well visualization in 2D and 3D for Weatherford’s Centro digital well delivery software.

HOUSTON, TX – August 18, 2020 – Weatherford International plc announced a strengthened collaboration with upstream data visualization provider INT to provide next-level, real-time well visualization in both 2D and 3D. Weatherford will embed INT’s IVAAP framework into the Weatherford Centro™ digital well delivery software, advancing its data visualization capabilities.


“Weatherford’s selection of the IVAAP framework for their Centro software is extremely exciting for INT,” said Dr. Olivier Lhemann, President of INT, Inc. “Centro is leading the industry-wide digital transformation as part of a new generation of applications built fully in HTML5. It is both highly collaborative and powerful, but still very user-friendly. INT has worked with Weatherford for many years and we are proud to be part of their innovative approach to integrating data and analytics within a single platform.”


Weatherford Centro digital well delivery software offers exceptional workflows that seamlessly integrate every element of an operator’s well data, allowing team members from any global location to access, share, and store all vital project information at any time. Combining Centro’s advanced data visualization capabilities with the IVAAP framework provides next-level real-time well visualization in 2D and 3D.


“Weatherford provides digital solutions that help our customers reduce costs and increase operational efficiency,” said Gustavo Urdaneta, Drilling Software Global Manager at Weatherford. “The proven E&P data visualization and open architecture design was a critical factor in selecting the IVAAP framework to enhance the value of user centric visualizations in our well delivery software.”


Weatherford has been at the forefront of software innovation, especially in drilling and production. Both companies have built a strong relationship by embedding advanced HTML5 domain visualizations libraries and modules from INT in several Weatherford software applications.

Read the full press release on PRWeb.

Visit int.com/ivaap/ to learn more or contact INT at intinfo@int.com.


About INT

INT is a software provider of Data Visualization solutions and platforms used in Upstream E&P and other technical industries. INT Software uses the latest technologies, such as HTML5 and JavaScript, to enable cloud-enabled and mobile-responsive solutions. For more than 25 years, INT visualization libraries, widgets, and frameworks have been used by the leading Oil & Gas and Service companies to empower best-in-class business applications for seismic, geoscience, well intelligence, drilling ops, utilities, manufacturing, and asset management.

About Weatherford

Weatherford is a leading wellbore and production solutions company. Operating in more than 80 countries, the Company answers the challenges of the energy industry with its global talent network of approximately 19,000 team members and 600 locations, which include service, research and development, training, and manufacturing facilities. Visit weatherford.com for more information or connect on LinkedIn, Facebook, Twitter, Instagram, or YouTube.
Filed Under: IVAAP, Press Release Tagged With: 2D, 3D, ivaap, weatherford

Jun 02 2020

INT Brings OpenVDS Java Binding to the OSDU Community

Recently, INT announced our partnership with Bluware and our integration of Bluware’s OpenVDS format into IVAAP, our enterprise data visualization platform. We are very excited about this partnership, as well as our collaboration with OSDU. This new format was designed to empower users to browse seismic data in the cloud with high performance and lower cost.

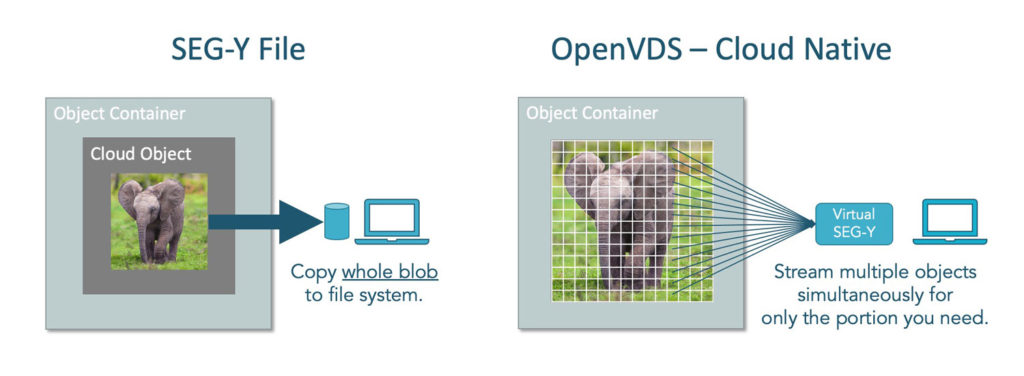
If you are not familiar with its capabilities: OpenVDS is a cloud-native way to store seismic data in the cloud. Unlike SEG-Y, which is linear, OpenVDS data is broken into small objects and stored in the cloud object store to provide very fast access to any part of the data. OpenVDS is serverless and supports any type of seismic data, including pre-stack.

Here’s an example of how seismic data can be stored in the cloud:

seismic-data-cloud
Graphic courtesy of Bluware Corp.


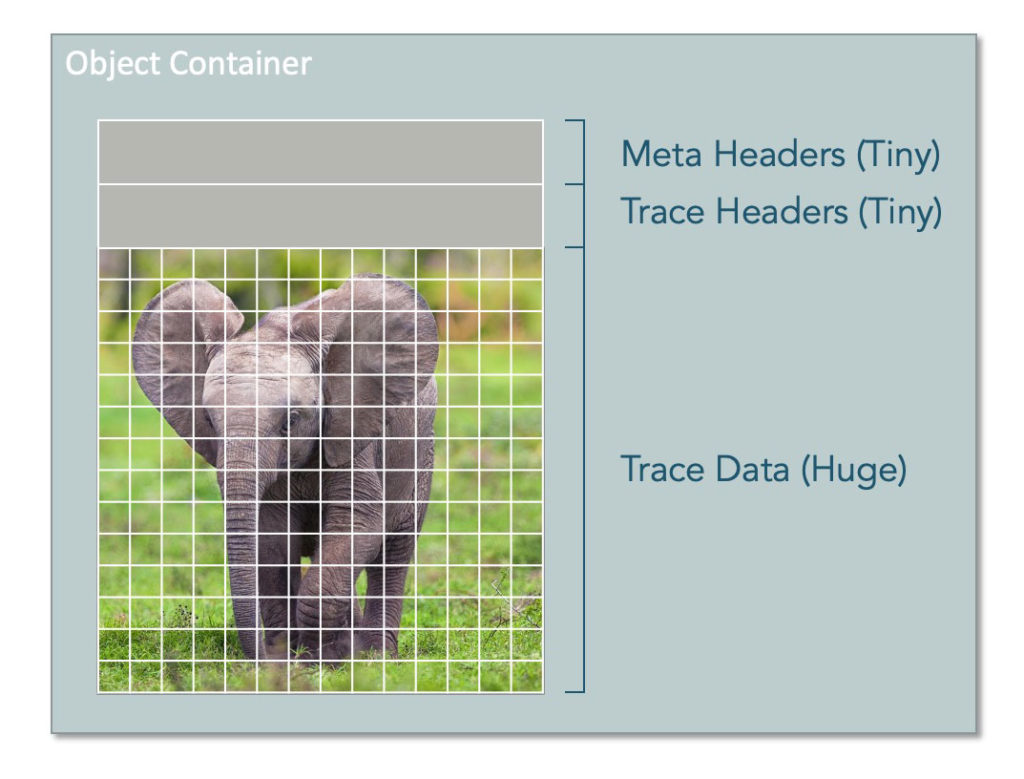
But with OpenVDS, you have the option to store headers in the hot tier and trace data in the cold or cool tier (to restore as needed).

openvds-anatomy
Graphic courtesy of Bluware Corp.
 

Through our process of integrating this format, we realized that we could offer a bit more functionality to help more users adopt OpenVDS by offering also a JAVA binding option. Here’s a timeline of our process:

Late March 2020

After completing the VDS integration into IVAAP, we started work on OpenVDS compatibility.

Unfortunately, there was no Java binding for OpenVDS at the time. With Java being the most popular platform for complex web application backends, it seemed it would be profitable to all if the OpenVDS technology was easily usable in these environments.

Thus, we decided to bring our expertise to the community and started working on an open-source Java binding.

April 2020

Our expert team worked on the binding. After testing different approaches, we decided to avoid automatic binding technologies (Swig, …) and to write the JNI code manually.

This decision would allow us to ensure finer control over memory management, allowing us to reduce the cost of memory transfers between Java and native C++ worlds.

We also paid particular attention to the stability and error management since this library is to be used in server backends with huge uptimes.

May 18, 2020

We’re done! We are proud to announce that the work of our experts has been accepted and merged into the OpenVDS repository.

A special thank you to Bluware for their support and to Roman Matyaschuk, Ilia Mikhailichenko, and Camille Perin with INT for making this a success story.

For more information on IVAAP, please visit int.flywheelstaging.com/products/ivaap/


Filed Under: IVAAP Tagged With: Bluware, cloud, ivaap, openVDS, OSDU, seismic data

May 07 2020

Interactive Network Technologies, Inc. (INT) Integrates Bluware Corp. Volume Data Store (VDS) into IVAAP

INT and Bluware are partnering to empower their upstream clients with true lossless, serverless storage and advanced data visualization in the cloud.

HOUSTON, TX – May 4, 2020 – Interactive Network Technologies, Inc. (INT) a leader in advanced domain visualization in digital exploration and production (E&P) and Bluware Corp., the digital platform that enables the oil and gas industry to accelerate digital transformation initiatives and adopt cloud computing for subsurface data, are pleased to announce the integration of Volume Data Store (VDS), a data format with adaptive streaming technology for seismic data storage, into IVAAP, an upstream data visualization platform. 

IVAAP is an HTML5 data visualization and collaborative platform for large Geoscience and petrophysical data sets in the cloud that empowers product owners, developers, and architects to accelerate the delivery of subsurface digital solutions for oil and gas. Deployable in any cloud environment (Azure®, GCP®, AWS®), IVAAP can scale to meet the needs of tens to thousands of users.


“Companies are pushed to the extreme in terms of remote collaboration and access, and, especially in the case of seismic visualization, finding the right tool to handle large datasets in the cloud can be even more challenging,” says Dr. Olivier Lhemann, President and Founder of INT. “Partnering with Bluware means INT can offer our clients true serverless, lossless storage to visualize their upstream data in the cloud.”


Bluware VDS manages all types of seismic data, including pre-stack, post-stack, WAZ, and more as demanded by an organization’s business needs, workflows, and infrastructure requirements. It can also transfer legacy formats such as SEG-Y or SEP using advanced on-the-fly transcoding on-premise or in the cloud.


“Bluware VDS cloud-native seismic data environment will provide customers with quick, cost-effective, remote access to their data, which is becoming imperative for organizations,” says Dan Piette, CEO at Bluware.


Read the press release on PRWeb >

About Bluware Corp.

Bluware enables oil and gas companies to solve the most challenging objectives in the petrotechnical world. E&P companies use Bluware to achieve previously unthinkable workflows using cloud computing, and artificial intelligence for subsurface data applications and workflows. For more information, visit www.bluware.com.

Filed Under: IVAAP Tagged With: AWS, Azure, Bluware, digital transformation, gcp, ivaap, seismic

Apr 23 2020

Opening IVAAP to Your Proprietary Data Through the Backend SDK

When doing demos of IVAAP, the wow factor is undeniably its user interface, built on top of GeoToolkit.JS. What users of IVAAP typically don’t see is the part accessing the data itself, the IVAAP backend. When we designed the IVAAP backend, we wanted our customers to be able to extend its functionalities. This is one of the reasons we chose Java for its programming language—customers typically have access to Java programmers.

Java is the programming language; it is a well-known, generic-purpose language, but the IVAAP Backend Software Development Kit (SDK) is typically only discovered during an IVAAP evaluation. In previous articles, I described the Lookup API (How to Empower Developers with à la Carte Deployment in IVAAP Upstream Data Visualization Platform) and the use of scopes (Using Scopes in IVAAP: Smart Caching and Other Benefits for Developers). As the SDK has grown, I thought it would be a good time to review what else this SDK provides.

One Optimized Use Case: Plugging Your Own Data

The most common question that I get is: “I see that you can access a WITSML datasource, a PPDM database. I have my own proprietary store for geoscience data, what do I need to do to make IVAAP visualize the data for my data store?” This is where the SDK comes into play. You do not need to modify IVAAP backend’s code to add your own data. In a nutshell, you just need to write a few Java classes, compile them, and add them to your IVAAP deployment.

The Java classes you write need to meet the Application Programming Interface (API) that the SDK defines. If you are a developer, this answer is not enough, this is the textbook definition of a SDK. What makes the IVAAP Backend SDK efficient for our use case is that you only need to write the API for the data you have. Since IVAAP’s built-in data model allows the visualization of maybe 30 different aspects of a well (log curves, deviations, tubing sets, mud logs, raster logs, etc), you only need to write classes for the data you have. For example, to visualize log curves, regardless of how these curves are stored, you only need to write about a dozen classes for a complete implementation.

The next question I get at this point is: “How do I know what to write?”. There is a large amount of documentation available. During the evaluation process, you are granted access to our developers site. This site is a reference used by all INT developers working on the IVAAP backend, whether they are developing IVAAP itself, or creating plugins for customers. It’s a Wiki and gets updated regularly. When I get support questions about the SDK, I typically will write an article in that Wiki and share the link. This is not the only piece of documentation available. There is a classic JavaDoc documentation that details the API in a formal manner. And there is also sample code. We created a sample connector to a SQL database storing well curves, trajectories, well locations and schematics as a practical example on how to use the SDK.

An Extensive Geoscience Data Model to Leverage

Lots of work has been done in IVAAP to facilitate workflows associated with wells, whether they are drilling workflows, production monitoring workflows, or just to manage an inventory. Specifically, IVAAP has a data model to expose the location of wells, log curves, deviation curves, mud logs, schematics, fracking, core images, raster logs, tops and any type of well documentation. Wells are not the only data models that IVAAP includes. Other models exist for seismic data and reservoirs. Several types of surfaces are also supported such as faults, grid surfaces, triangle meshes and seismic horizons.

These data models were built over-time based upon the common denominator between models coming from different systems. For example, if you are familiar with WITSML, you will find that the definition of a well log resembles what WITSML provides, but is flexible enough to also support LAS and DLIS files. From a developer perspective, the data model is exposed through the SDK’s API, without making any assumption on how this data is stored. The data model works for data stored in the cloud, on a file system, in a SQL database, and even data exposed only through a web service. While most of IVAAP’s connectors access one form of data store at a time, some connectors mix storages to combine data from web services and cloud storages. IVAAP’s data model is storage-agnostic, and the services to expose this data model to the HTML5 client are storage-agnostic as well.

IVAAP covers the most common data types found in geoscience. It provides the services to access this data, and the UI to visualize it. When starting an IVAAP development project, most developers should only have to focus on plugging their data, expressing through the SDK’s API on how to retrieve this data.

An API to Customize Entitlements

There is one more way that the IVAAP SDK makes the developer experience seamless when plugging a proprietary datastore. Not only does no code have to be written to expose this data to the viewer, but no code has to be written to control who has access to which data. Both aspects are built-in into the code that will call your implementation. You only have to write the data access layer, and not worry about entitlements or web services. By default, entitlements are based upon the information entered in the IVAAP Administration application.

This separation between data access and entitlements saves development time, but there are cases when a data store controls both data and access to this data. When IVAAP needs to access such an integrated system, the entitlement checks layer needs to be performed by the data access code. The entitlement API allows these checks to be performed at the data level.

The entitlement API is actually very fine-grained. You can customize the behavior of each service to limit access to specific data points. For example, the default behavior of IVAAP is to grant access to all curves of a well when you have been granted access to that well. Depending on your business rules, you might elect to restrict access to specific log curves. The SDK doesn’t force you into an “all or nothing” decision.

An API to Implement Your Own REST Services

Another typical use case is when you need to give access to data that doesn’t belong to the IVAAP built-in data model. In this particular situation, you need to extend IVAAP by adding custom widgets, and ad-hoc web services are needed to expose the relevant data to this widget. There is of course an API for this. External developers use the same API as INT developers to implement web services. INT has developed more than 500 REST services using this API, and external developers benefit from this experience.

Most services are JSON-based, and IVAAP uses the jackson libraries to create JSON content. To advertise capabilities to the HTML5 client, the IVAAP backend uses HATEOAS links. For example, if the JSON description of a well has a link to the mud logs services, then this well has mud logs. If this link is not present, the HTML5 client understands that this well doesn’t contain mud logs, and will adapt its UI accordingly. If you were to add your own service exposing more data associated with a well, you would typically want to add your own HATEOAS to the description of wells. Adding HATEOAS links to existing services is possible by plugging so-called Entity classes. You do not need to modify the code of this service to modify its behavior.

IVAAP’s REST services follow the OpenAPI specifications. There is actually a built-in web service whose only purpose is to expose the available services in the classic Swagger format. IVAAP’s SDK uses annotations similar to the Swagger Annotations API. If you are familiar with this API, documenting your own REST services should be a breeze.

Most of the REST services are JSON-based, but sometimes binary streams are used instead for performance reasons. Binary streams are typically used in IVAAP to expose seismic data, but also surfaces. The SDK uses events to implement such streaming services.

An API to Implement Your Own Real Time Feeds

The service API is not limited to REST services. An API is also available to communicate with the IVAAP HTML5 client through websockets. The WebSockets API is typically used to implement real time communications between the client and the server. For example, when a user opens a well, the user interface uses websockets to send a subscription message to the backend, requesting to be notified if this well changes. This enables a whole set of capabilities, such as real time monitoring. This is the API we use to monitor wells from WITSML datasources. The SDK includes an entire set of hooks so that customers can write their own feeds, including subscription, unsubscription and broadcast of messages.

When you write REST services, the container details are abstracted away and you only need to worry about implementing domain-related code. A REST service working in a Tomcat based development environment will work without any modification in a Play cluster. Likewise, feeds developed with the SDK work seamlessly in both Tomcat and Play. On a developer station, the SDK will use end points from the Servlet API to carry messages. In a Play cluster, the SDK will use ActiveMQ. ActiveMQ allows scalability and reliability features that servlets miss, such as high-rate of messages, and reliable delivery of messages. The use of ActiveMQ is transparent to the developers of feeds.

Utilitarian APIs

There is more to the IVAAP SDK than its APIs to access data, write services or customize entitlements. There are a few other APIs worth mentioning. One of them is the API to perform CRS conversions. Its default implementation uses Apache SIS, but the API itself is generic in nature. CRS conversions are often needed in geoscience, for example to visualize datasets on a map, on top of satellite imagery. Years of work has been built into the Apache SIS library, and virtually no work is needed by IVAAP developers to leverage this library when the SDK is used.

There are also APIs to execute code at startup and to query the environment that IVAAP is running on. The Lookup API gives access to the features that are plugged. The DataSource API indicates which data sources are configured to run in the JVM. The Hosted Services API provides an inventory of the external services that an IVAAP instance needs to interact with. A hosted service could be the REST service that evaluates formulas, or the machine learning system that IVAAP feeds its data to.

A “Developer-Friendly” Development Environment

We made lots of efforts to make sure the development process would be as simple as possible. Developers with experience with Java Servlets will be at ease with their IVAAP development environment. They will use tools they are familiar with such as Eclipse and Tomcat. A production instance of IVAAP doesn’t use servlets, it uses the Play framework. By following the SDK’s API, it is virtually transparent to developers that their code will be deployed in a cluster.

There are a few instances where awareness of the cluster environment is needed. For example, when caching is involved, you want to make sure that all caches are cleared across all JVMs when data gets updated. The IVAAP SDK includes an API to send and receive cluster events, and to create your own events. Since events are serialized from/to JSON, instances in the cluster do not need to share the same build version to interact with each other. This was a deliberate design choice so that you can upgrade your cluster while it’s running, without service interruption.

Caching is a large topic, outside of the scope of this article. IVAAP’s SDK proposes a “DistributedStore” API that hides the complexity of sharing state across JVMs. As long as you use this API, code that caches data will work without any modification in a single-JVM development environment and a multiple-JVMs production environment.

Finally, the SDK’s API is designed to allow fast iterative development. For example, once you have implemented the two classes that define how to list wells in your datastore, you can test them right away with Postman. Earlier I wrote that plugging your own log curves requires about a dozen classes. There is no need to write all twelve to start seeing results. Actually, you do not need to launch Postman to test your web services. You can test services using JUnit. A REST service written with the SDK can be tested with JUnit. This saves time by eliminating the need to launch Tomcat.

When you evaluate IVAAP, you might not have enough time to grasp the depth of the IVAAP SDK. Hopefully, this guide will help you get started.


Filed Under: IVAAP Tagged With: API, geoscience, ivaap, java, REST, SDK

Apr 01 2020

INT’s Leading Upstream Data Visualization Platform, IVAAP 2.5, Gets Major Update in Latest Release

Improvements facilitate collaboration and remote access to large volumes of subsurface data.

HOUSTON, TX – March 31, 2020 – INT is pleased to announce the latest release of its enterprise upstream visualization platform, IVAAP™ 2.5.

This version includes new production dashboards to enhance analysis and monitoring. Support for curve dictionaries and aliases makes it easier to build powerful log templates. IVAAP now fully supports the display of raster logs in well and correlation views (with support for TGS SmartRASTER® format).

Improved synchronization between widgets makes it easier to navigate complex dashboards between wells, and shared dashboards and templates mean smoother, faster collaboration between users. This release also includes improvements to handle, visualize, and correlate large volumes of wells efficiently.

In 2019, INT joined the Open Subsurface Data Universe™ (OSDU) consortium, and with this latest release, IVAAP is able to support R2 out of the box, including support for SEG-Y and OpenVDS.


“The latest release of IVAAP shows our continued deep commitment to supporting clients through all of their subsurface digital needs. In the current context, the timing of this release is important for companies that now have an imperative to provide rapid, cost-effective, remote access to their data. INT consistently demonstrates the potential to go beyond conventional thinking and push the boundaries for cloud-based visualization. I’m proud of my team and their ability to switch to working remotely without disruption to keep the planned release date and provide exemplary customer service, no matter the circumstances,” said Olivier Lhemann, founder and president of INT.


IVAAP is an upstream visualization platform that enables search and visualization of geophysical, petrophysical, and production data in the cloud. It allows product owners, developers, and architects to rapidly build next-level subsurface digital solutions anywhere without having to start from scratch.

INT is the industry standard, providing upstream data visualization libraries and enterprise platforms for 30 years.

Learn more at int.com/ivaap for a preview of IVAAP or for a demo of INT’s other data visualization products.

About Interactive Network Technologies, Inc. (INT)
For three decades, we’ve created products that help oil and gas companies visualize, monitor, and analyze their data. From customizable widgets to out-of-the-box applications, our expert visualization solutions offer unparalleled flexibility for both scientific industries and business, and our HTML5/web-enabled visualization technologies are rock-solid and network-secure. For further information, visit int.flywheelstaging.com.

Read the press release on PRWeb >

INT, the INT logo, and IVAAP are trademarks of Interactive Network Technologies, Inc., in the United States and/or other countries.

Open Subsurface Data Universe™ and OSDU™ are trademarks of The Open Group.

Filed Under: IVAAP Tagged With: ivaap, OSDU

  • « Go to Previous Page
  • Page 1
  • Interim pages omitted …
  • Page 6
  • Page 7
  • Page 8
  • Page 9
  • Page 10
  • Go to Next Page »

Footer

Solutions

  • Real-Time Visualization
  • Visualization Components
  • New Energy Visualization
  • OSDU Visualization
  • Machine Learning
  • Developer Tools
  • Cloud Partners
  • Customer Success Stories

Products

  • IVAAP
  • GeoToolkit
  • INTViewer
  • IVAAP Demos
  • GeoToolkit Demos

About

  • News
  • Events
  • Careers
  • Management Team

Resources

  • Blog
  • FAQ

Support

  • JIRA
  • Developer Community

Contact

INT logo
© 1989–2024 Interactive Network Technologies, Inc.
Privacy Policy
  • Careers
  • Contact Us
  • Search

COPYRIGHT © 2025 INTERACTIVE NETWORK TECHNOLOGIES, Inc