• Skip to main content
  • Skip to footer

INT

Empowering Visualization

COMMUNITY BLOG
CONTACT US SUPPORT
MENUMENU
  • Solutions
    • Overview
    • Real-Time Visualization
    • Visualization Components
    • New Energy Visualization
    • OSDU Visualization
    • Machine Learning
    • Developer Tools
    • Cloud Partners
  • Products
    • IVAAP™
          • SOLUTIONS

            Real-Time Visualization

            OSDU Visualization

            Visualization Components

            New Energy Visualization

            Upstream Data Visualization

          • SUCCESS STORIES

            WEATHERFORD
            Well delivery optimization software

            BARDASZ
            Data management, data quality monitoring

            ANPG / SATEC-MIAPIA
            Virtual data room

            MAILLANCE
            High-performance visualization of ML algorithms

            SEE ALL >

          • SUPPORT

            DEVELOPER COMMUNITY
            Join or log in to the INT Developer Community.

            GET SUPPORT
            Log a ticket for an issue or bug.

            CONTACT US

          • DEMOS

            IVAAP DEMOS
            Cloud-Based Demos

            FIRST TIME HERE?
            Register to access our
            IVAAP demos

    • GeoToolkit™
          • SUCCESS STORIES

            CAYROS
            Field development planning

            TOTALENERGIES
            High-performance large dataset reservoir rendering

            IFP ENERGIES NOUVELLES
            Seismic and structural interpretation validation

            SEE ALL >

          • SUPPORT

            DEVELOPER COMMUNITY
            Join or log in to the INT Developer Community.

            GET SUPPORT
            Log a ticket for an issue or bug.

            CONTACT US

          • DEMOS

            GEOTOOLKIT DEMOS
            Geoscience Demos

    • INTViewer™
          • SUCCESS STORIES

            STRYDE
            Fast seismic QA/QC in the field

            SILVERTHORNE SEISMIC
            Efficient 2D/3D seismic data delivery

            WIRELESS SEISMIC
            Drones, IoT, and Advanced Onsite Seismic Data Validation

            SEE ALL >

          • SUPPORT

            GET SUPPORT
            Log a ticket for an issue or bug.

            CONTACT US

          • PLUG-INS

            EXTEND INTVIEWER
            More than 65 plugins available

  • Demos
    • GeoToolkit Demos
    • IVAAP Demos
  • Success Stories
  • Resources
    • Blog
    • Developer Community
    • FAQ
    • INT Resources Library
  • About
    • Overview
    • News
    • Events
    • Careers
    • Meet Our Team
    • About INT

Products

Aug 10 2023

INT Simplifies Machine Learning and Processing and Augments Analytics Capabilities with Latest Release of IVAAP Data Visualization Platform

The latest release of IVAAP by INT introduces an array of exciting new features and enhancements, providing users with unparalleled capabilities to extract deeper insights from their subsurface data.

Houston, TX — August 10, 2023 — INT announced today the launch of IVAAP™ 2.11, the latest version of our Universal Cloud Data Visualization Platform. With powerful features and enhanced capabilities, IVAAP™ 2.11 takes subsurface data exploration and visualization to new heights, empowering users to make critical decisions with confidence and efficiency.

Some of the key highlights include: 

  1. External Workflows to Support Machine Learning and Data Processing: With IVAAP™ 2.11, users can now seamlessly integrate external processing workflows and ML capabilities, unlocking the true potential of their data through advanced analytics and data automation.
  2. Unit System Management: IVAAP™ introduces Unit System Management, offering users enhanced control over data consistency and clarity by efficiently managing unit conversions.
  3. WellLog Enhancements: WellLog module sees significant improvements, including support for stacked patterns curve, curve editing, lithology editing, and discrete raster files.
  4. Dynamic Range Intervals: Selected depth intervals can be highlighted in multiple widgets like cross-plot, pie charts, histograms, and more. Moving intervals along the depth are reflected automatically across all widgets.
  5. OSDU™ Data Platform Compatibility: IVAAP now offers full support for perforation intervals, stratigraphic columns, well-core images, hole sections, and collections on the OSDU Data Platform. Additionally, KPIs are now available on the IVAAP Home page.

“IVAAP 2.11 represents a significant milestone in our journey towards providing the oil and gas industry with the most advanced and comprehensive data visualization platform. With the introduction of external workflow support for machine learning and data processing and full compatibility with the OSDU Data Platform, IVAAP continues to empower geoscientists and engineers to explore, visualize, and automate their data like never before,” said Hugues Thevoux, VP of Cloud Solutions at INT. “This release underscores our commitment to delivering cutting-edge solutions that drive efficiency, foster innovation, and enable our clients to make smarter decisions with confidence.”


IVAAP 2.11 is now available for all existing users. To experience the power of IVAAP or to schedule a personalized demo, visit int.com/demo-gallery/ivaap/ or contact our sales team at intinfo@int.com.

To learn more about IVAAP 2.11, please visit int.com/products/ivaap/ or contact us at intinfo@int.com.

Read the IVAAP 2.11 Release Notes.
Read the press release on PRWeb.

____________

ABOUT IVAAP:

IVAAP™ is a Universal Cloud Data Visualization Platform where users can explore domain data, visualize 2D/3D G&G data (wells, seismic, horizons, surface), and perform data automation by integrating with external processing workflows and ML.

ABOUT INT:

INT software empowers the largest energy and services companies in the world to visualize their complex subsurface data (seismic, well log, reservoir, and schematics in 2D/3D). INT offers a visualization platform (IVAAP) and libraries (GeoToolkit) developers can use with their data ecosystem to deliver subsurface solutions (Exploration, Drilling, Production). INT’s powerful HTML5/JavaScript technology can be used for data aggregation, API services, and high-performance visualization of G&G and petrophysical data in a browser. INT simplifies complex subsurface data visualization.

For more information about IVAAP or INT’s other data visualization products, please visit https://int.flywheelstaging.com.

INT, the INT logo, and GeoToolkit are trademarks of Interactive Network Technologies, Inc., in the United States and/or other countries.
Filed Under: IVAAP, Press Release, Uncategorized Tagged With: cloud, Data Processing, data visualization, ivaap, machine learning, ml, OSDU, welllog

Jul 19 2023

Introducing INT’s GeoToolkit.JS 2023: The Latest Release Packed with Cutting-Edge Features to Enhance User Experience

The GeoToolkit.JS 2023 release innovation includes TypeScript migration, React Native support for mobile devices, improved composite schematics widget, added horizontal mode for MultiWellWidget, and more.

Houston, TX — July 19, 20223 — Today, INT proudly announces the release of GeoToolkit.JS 2023, the most advanced version of the company’s comprehensive set of high-performance tools and libraries for visualization of upstream data. GeoToolkit.JS 2023 comes with a wide range of exciting features and enhancements designed to revolutionize the user experience and empower developers to create exceptional applications.

The GeoToolkit.JS 2023 release introduces several notable highlights:

  1. TypeScript Migration and Public API Review: We migrated the entire GeoToolkit.JS library to TypeScript, resulting in improved code maintainability and enhanced developer productivity. Additionally, the Public API has undergone a comprehensive review, ensuring a more intuitive and streamlined development process.
  2. Seismic 2D Wiggle Anti-Aliasing: With our new anti-aliasing feature, based on Xiaolin Wu, seismic 2D wiggle displays are now visually smoother and more accurate, enabling geoscientists to analyze seismic data with unprecedented clarity.
  3. High-Level ChartWidget Class: GeoToolkit.JS 2023 introduces the ChartWidget class, simplifying the creation and customization of charts. This high-level abstraction allows developers to effortlessly integrate interactive charts into their applications, providing rich visualizations to end-users to support multiples series, union/stacked model space, and more.
  4. React Native Support for Mobile Development: We understand the importance of mobile application development, and with this release, we are excited to offer React Native support. Developers can now leverage the power of GeoToolkit.JS to build geoscience applications for both iOS and Android platforms, reaching a wider audience.
  5. Well Log Correlation Display Optimization: Our optimization efforts have resulted in lightning-fast performance when displaying over 10,000+ wells. Users can now visualize and analyze vast amounts of well log data within seconds, facilitating faster decision-making and improving productivity. Additionally, we have introduced a new feature called horizontal mode for MultiWellWidget. With this new mode, users can view and interact with the well log data in a horizontal layout, providing a different perspective and enabling more efficient analysis. Whether users prefer the traditional vertical view or the new horizontal mode, our optimized display and performance ensure a seamless experience even with large datasets.

These highlights are just a glimpse of what GeoToolkit.JS 2023 has to offer. Our commitment to continuous innovation and user-centric development ensures that the latest release meets the evolving needs of the geoscience community.


“For this release, it was important for us to incorporate features that would make our users’ lives easier and improve the level of applications — both web and mobile — that they can create with GeoToolkit,” said Dr. Dmitriy Lukyanenko, Director of Software Development at INT. “We work closely with our Developer Community to understand and respond to their needs, and we think this release really delivers on that promise.”


To learn more about GeoToolkit.JS 2023, please visit int.com/products/geotoolkit/ or contact us at intinfo@int.com.

Read the GeoToolkit.JS 2023 Release Notes.
Read the press release on PRWeb.

____________

ABOUT GEOTOOLKIT:

GeoToolkit™ is a comprehensive set of high-performance tools and libraries to display 2D/3D seismic, well log, schematics, contour, maps, charts, and more. Perfect for developers who want to build advanced domain-oriented software quickly.

ABOUT INT:

INT software empowers the largest energy and services companies in the world to visualize their complex subsurface data (seismic, well log, reservoir, and schematics in 2D/3D). INT offers a visualization platform (IVAAP) and libraries (GeoToolkit) developers can use with their data ecosystem to deliver subsurface solutions (Exploration, Drilling, Production). INT’s powerful HTML5/JavaScript technology can be used for data aggregation, API services, and high-performance visualization of G&G and petrophysical data in a browser. INT simplifies complex subsurface data visualization.

For more information about GeoToolkit or INT’s other data visualization products, please visit https://int.flywheelstaging.com.

INT, the INT logo, and GeoToolkit are trademarks of Interactive Network Technologies, Inc., in the United States and/or other countries.

Filed Under: Carnac 2D, Carnac 3D, GeoToolkit, GeoToolkit (Geoscience), HTML5Viewer, JavaScript, Press Release

Jun 12 2023

How to Use the Nimbus Library to Authenticate Users with OpenID Connect

OpenID Connect (OIDC) is an authentication protocol using a third-party site to provide single-sign-on capabilities to web applications. For example, before you can visualize OpenSDU data in IVAAP, your browser is redirected to a login page hosted by Microsoft or Amazon. After completion of the two-factor authentication, your browser is redirected to IVAAP. The sequence of steps between IVAAP and external authentication servers follows the OpenID Connect protocol.

OIDC is built on top of Oauth2. It was created in 2014, superseding Open ID 2.0. Over the years, it has become a widely used standard for consumer and enterprise-grade applications. While simpler than OpenID 2.0, most developers will need to use a library to integrate OIDC with their applications.

In IVAAP’s case, since the Admin Backend is written in Java, we use the OIDC Nimbus library identified by this maven configuration:

<dependency>
    <groupId>com.nimbusds</groupId>
    <artifactId>oauth2-oidc-sdk</artifactId>
    <version>10.1</version>
</dependency>

While this Nimbus library doesn’t provide a full implementation of the OpenID Connect workflow, it contains pieces that can be reused in your code. IVAAP being a platform, it comes with an SDK to plug your own authentication. Nimbus fits the concept of an SDK where most of the work is already done for developers, and you only need to implement a few hooks. In our case, the hooks identify mainly what to do when the /login, /callback, /refresh, and /logout services are called. Let’s dive a little further into how Nimbus helps developers implement these services.

The Login Service

The main purpose of the /login service is to redirect the browser to an external authentication page. The login URL changes slightly each time it’s called for security reasons. It contains various information such as the scope, a callback URL, a client ID, a state, and a nonce. The scope, callback URL, and client ID typically don’t change, but the state and nonce are always new.

ClientID clientID = new ClientID(this.clientId);
URI callback = new URI(this.callbackURL);

Nonce nonce = new Nonce();
Scope authScope = new Scope();
String[] split = this.scope.split(" ");
for (String currentToken : split) {
    authScope.add(currentToken);
}

AuthenticationRequest request = new AuthenticationRequest.Builder(
            ResponseType.CODE,
            authScope,
            clientID,
            callback)
            .endpointURI(new URI(this.authURL))
            .state(state)
            .nonce(nonce)
            .prompt(new Prompt("login"))
            .build();
return request.toURI();

Since OIDC was released, a more secure variation called PKCE (pronounced pixy) has been added. PKCE introduces a code challenge instead of relying on a client secret used in the /callback service. The same code looks like this when PKCE is used:

ClientID clientID = new ClientID(this.clientId);
URI callback = new URI(this.callbackURL);
this.codeVerifier = new CodeVerifier();

Nonce nonce = new Nonce();
Scope authScope = new Scope();
String[] split = this.scope.split(" ");
for (String currentToken : split) {
    authScope.add(currentToken);
}

AuthenticationRequest request = new AuthenticationRequest.Builder(
            ResponseType.CODE,
            authScope,
            clientID,
            callback)
            .endpointURI(new URI(this.authURL))
            .state(state)
            .codeChallenge(codeVerifier, CodeChallengeMethod.S256)
            .nonce(nonce)
            .prompt(new Prompt("login"))
            .build();
return request.toURI();

The Callback Service

When the /callback service is called after successful authentication, the callback URL contains a state and a code that identifies the authentication that was just performed. The following lines extract this code from the callback URL:

AuthenticationResponse response = AuthenticationResponseParser.parse(
                new URI(callbackUrl));
State state = response.getState();
AuthorizationCode code = response.toSuccessResponse().getAuthorizationCode();

The state should match the state created when the /login service was called.

This “authorization code” can be exchanged with authentication tokens calling the OIDC token service.

     URI tokenEndpoint = new URI(this.tokenURL);
     URI callback = new URI(this.callbackURL);
      AuthorizationGrant codeGrant = new AuthorizationCodeGrant(code, callback);
      ClientID clientID = new ClientID(this.clientId);
      Secret secret = new Secret(this.clientSecret);
      Scope authScope = new Scope();
      String[] split = this.scope.split(" ");
      for (String currentToken : split) {
          authScope.add(currentToken);
      }
      ClientAuthentication clientAuth = new ClientSecretBasic(clientID, secret);
      TokenRequest request = new TokenRequest(tokenEndpoint, clientAuth, codeGrant, authScope); 
      HTTPRequest toHTTPRequest = request.toHTTPRequest();
      TokenResponse tokenResponse= OIDCTokenResponseParser.parse(toHTTPRequest.send());
OIDCTokenResponse successResponse = (OIDCTokenResponse) tokenResponse.toSuccessResponse();
  JWT idToken = successResponse.getOIDCTokens().getIDToken();
  AccessToken accessToken = successResponse.getOIDCTokens().getAccessToken();
  RefreshToken refreshToken = successResponse.getOIDCTokens().getRefreshToken();

If PKCE is enabled, this code is simpler. It doesn’t require a client’s secret to be passed:

           URI tokenEndpoint = new URI(this.tokenURL);
           URI callback = new URI(this.callbackURL);
            AuthorizationGrant codeGrant = new AuthorizationCodeGrant(code, callback, this.codeVerifier);
            ClientID clientID = new ClientID(this.clientId);
            TokenRequest  request = new TokenRequest(tokenEndpoint, clientID, codeGrant);
authScope); 
            HTTPRequest toHTTPRequest = request.toHTTPRequest();
            TokenResponse tokenResponse= OIDCTokenResponseParser.parse(toHTTPRequest.send());
      OIDCTokenResponse successResponse = (OIDCTokenResponse) tokenResponse.toSuccessResponse();
        JWT idToken = successResponse.getOIDCTokens().getIDToken();
        AccessToken accessToken = successResponse.getOIDCTokens().getAccessToken();
        RefreshToken refreshToken = successResponse.getOIDCTokens().getRefreshToken();

The OpenID Connect token service gives us 3 tokens:

  • An access token
  • A JSON Web Token (JWT) token, also known as an ID token or bearer token
  • A refresh token

The access token is the token that typically grants access to data. It expires, and a new access token can be retrieved, passing the refresh token to the OIDC refresh service.

The JWT token is the token that identifies the user. Unlike the access token, it doesn’t expire. While a JWT token may be parsed to get user info, the access token is typically used instead. A user info OIDC service typically needs to be called with the access token to get the user details.

            URI userInfoURI = new URI(this.userInfoURL);
            HTTPResponse httpResponse = new UserInfoRequest(userInfoURI, accessToken)
                    .toHTTPRequest()
                    .send();
            UserInfoResponse userInfoResponse = UserInfoResponse.parse(httpResponse);
            UserInfo userInfo = userInfoResponse.toSuccessResponse().getUserInfo();
String email = (String) userInfo.getClaim("email");

For OpenSDU, a more complex API involving claim verifiers needs to be used to get user details.

Set<String> claims = new LinkedHashSet<>();
claims.add("unique_name");
ConfigurableJWTProcessor<SecurityContext> jwtProcessor = new DefaultJWTProcessor<>();
jwtProcessor.setJWSTypeVerifier(new DefaultJOSEObjectTypeVerifier<>(new JOSEObjectType("JWT")));
JWKSource<SecurityContext> keySource = new RemoteJWKSet<>(...));
JWSAlgorithm expectedJWSAlg = JWSAlgorithm.RS256;
JWSKeySelector<SecurityContext> keySelector = new JWSVerificationKeySelector<>(expectedJWSAlg, keySource);
jwtProcessor.setJWTClaimsSetVerifier(new DefaultJWTClaimsVerifier(new JWTClaimsSet.Builder().issuer(...).build(),
        claims));
jwtProcessor.setJWSKeySelector(keySelector);
JWTClaimsSet claimsSet = jwtProcessor.process(accessToken.getValue(), null);
Map<String, Object> userInfo = claimsSet.toJSONObject();
String email = (String) userInfo.getClaim("unique_name");

The Refresh Service

In IVAAP’s case, the UI’s role is to call the /refresh service before an access token expires. When this refresh service is called with the last issued refresh token, new access and refresh tokens are obtained by calling the OIDC token service again.

    RefreshToken receivedRefreshToken = new RefreshToken(…);
    AuthorizationGrant refreshTokenGrant = new RefreshTokenGrant(receivedRefreshToken);
    URI tokenEndpoint = new URI(this.tokenURL);
    ClientID clientID = new ClientID(this.clientId);
    Secret secret = new Secret(this.clientSecret);
    ClientAuthentication clientAuth = new ClientSecretBasic(clientID, secret);
    Scope authScope = new Scope();
    String[] split = this.scope.split(" ");
    for (String currentToken : split) {
        authScope.add(currentToken);
    }
    TokenRequest  request = new TokenRequest(tokenEndpoint, clientAuth, refreshTokenGrant, authScope);

HTTPResponse httpResponse = request.toHTTPRequest().send();
AccessTokenResponse successResponse = response.toSuccessResponse();
Tokens tokens = successResponse.getTokens();
AccessToken accessToken = tokens.getAccessToken();
RefreshToken refreshToken = tokens.getRefreshToken();

If PKCE is enabled, this code is simpler. It doesn’t require a client secret to be passed:

RefreshToken receivedRefreshToken = new RefreshToken(…);
AuthorizationGrant refreshTokenGrant = new RefreshTokenGrant(receivedRefreshToken);
URI tokenEndpoint = new URI(this.tokenURL);
ClientID clientID = new ClientID(this.clientId);
TokenRequest request = new TokenRequest(tokenEndpoint, clientID, refreshTokenGrant);
HTTPResponse httpResponse = request.toHTTPRequest().send();
AccessTokenResponse successResponse = response.toSuccessResponse();
Tokens tokens = successResponse.getTokens();
AccessToken accessToken = tokens.getAccessToken();
RefreshToken refreshToken = tokens.getRefreshToken();

The Logout Service

As OpenID Connect doesn’t provide a standard for logging out, no Nimbus API generates the logout URL. The logout URL has to be built manually depending on the OpenID provider (Microsoft or Amazon). This logout URL is sometimes provided by the content behind the discovery URL of an OpenID provider.

Going Beyond

For simplicity’s sake, I didn’t include in the code samples the handling of errors. While the OpenID Connect protocol is well-defined, there are a few variations between cloud providers. For example, the fields stored in tokens may vary. This article doesn’t describe what happens after the /callback service is called: once tokens are issued, how are they passed to the viewer? These implementation details may be implemented differently by each application. When I was tasked with integrating OpenID Connect, I found the Nimbus website clear and simple to use, showing sample code front and center. I highly recommend this library.

Visit us online at int.com/ivaap for a preview of IVAAP or for a demo of INT’s other data visualization products. 

For more information, please visit int.flywheelstaging.com or contact us at intinfo@int.com.

____________

ABOUT INT

INT software empowers energy companies to visualize their complex data (geoscience, well, surface reservoir, equipment in 2D/3D). INT offers a visualization platform (IVAAP) and libraries (GeoToolkit) that developers can use with their data ecosystem to deliver subsurface solutions (Exploration, Drilling, Production). INT’s powerful HTML5/JavaScript technology can be used for data aggregation, API services, and high-performance visualization of G&G and energy data in a browser. INT simplifies complex subsurface data visualization.

INT, the INT logo, and IVAAP are trademarks of Interactive Network Technologies, Inc., in the United States and/or other countries.


Filed Under: IVAAP Tagged With: ivaap, java, oauth2, OIDC, OpenID, PKCE, URL

May 08 2023

Production Geology Workflows with IVAAP

In this blog post, we will explore how IVAAP, a platform developed by INT, is revolutionizing the production geology workflow for geoscientists. GeomodL International, a consultancy based in the UAE, specializes in this field and has been utilizing IVAAP to enhance its production geology workflow. In this blog post, Raffik Lazar, founder and principal at GeomodL International, will share his insights on how IVAAP has helped streamline their production geology workflow, allowing them to visualize and cross-visualize various data sets in a single location, leading to better decision-making, cost-saving, and optimization of development plans.

Reservoir Lifecycle and Production Geology Workflow 

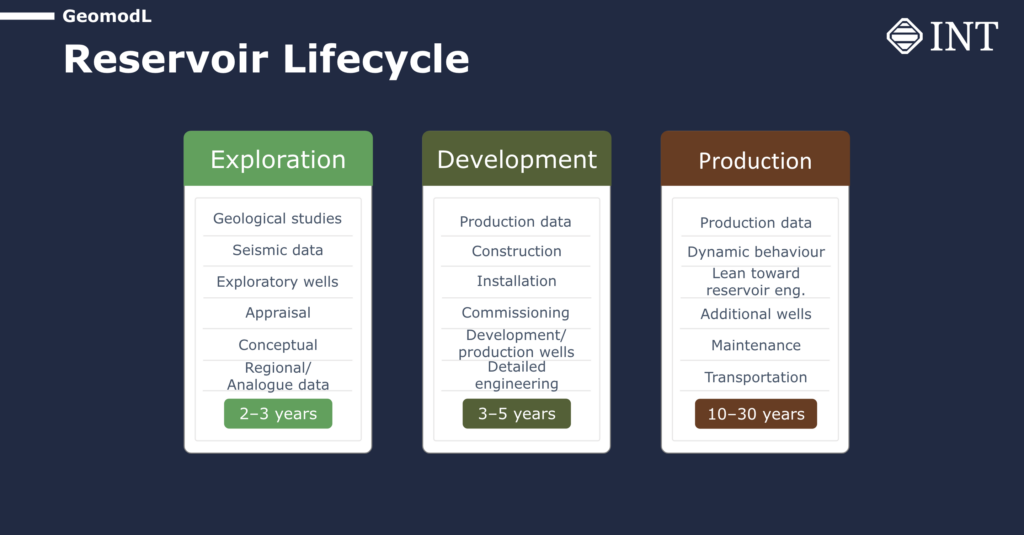
As many of you know, the reservoir lifecycle typically starts with exploration, which can take two to three years. During this phase, geoscientists rely heavily on seismic data to understand the basin’s geology. Exploration wells are drilled, and projections of the reservoir are developed. Once an asset is identified to be commercially relevant, the project transitions into the development phase, which can take three to five years on average. During this phase, wells are drilled, and surface structures are commissioned. Production data starts to become available, providing insights into the behavior of the reservoir. The production phase, which can last for 10 to 30 years, involves drilling additional wells within the same field based on the dynamic behavior of the reservoir and refining the static model with the help of geology and geophysics (G&G) data and production data.

pic 1_GeomodL

Challenges in Production Geology Workflow

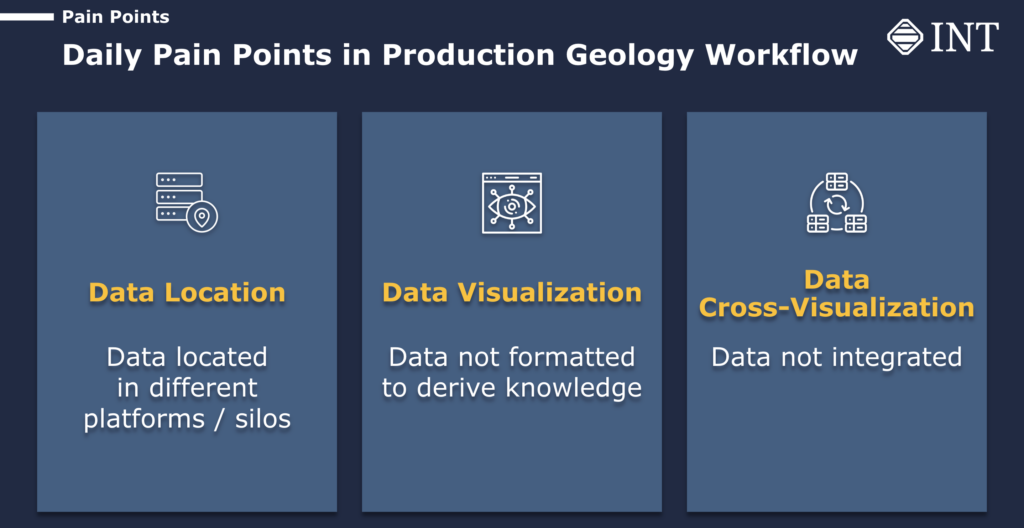
One of the challenges in the production geology workflow is the fragmented nature of data, which is typically located in different platforms or silos. Production data is often in Excel formats, while G&G data may be stored in Petrel or other data sets, making it difficult to visualize and analyze the data in an integrated manner. Additionally, the time-consuming process of manually cross-visualizing data from different sources hinders the geoscientists’ ability to gain insights and make informed decisions quickly.

Pic 2_GeomodL

The Power of Data Visualization with IVAAP 

IVAAP, a web-based platform developed by INT, has emerged as a game-changer in production geology. It provides geoscientists with a single platform to access and visualize various data sets, including production data, G&G data, and 3D models, all in one location. This eliminates the need to manually search for and integrate data from different sources, saving time and effort. With IVAAP, geoscientists can easily cross-visualize data, allowing them to gain insights far more effectively than looking at each data set in isolation. The ability to visualize data in a comprehensive and integrated manner enables geoscientists to understand the behavior of the reservoir better and make informed decisions for development plans, leading to cost-saving and optimization of resources.

Pic 3_GeomodL

Case Study: Coevorden Field 

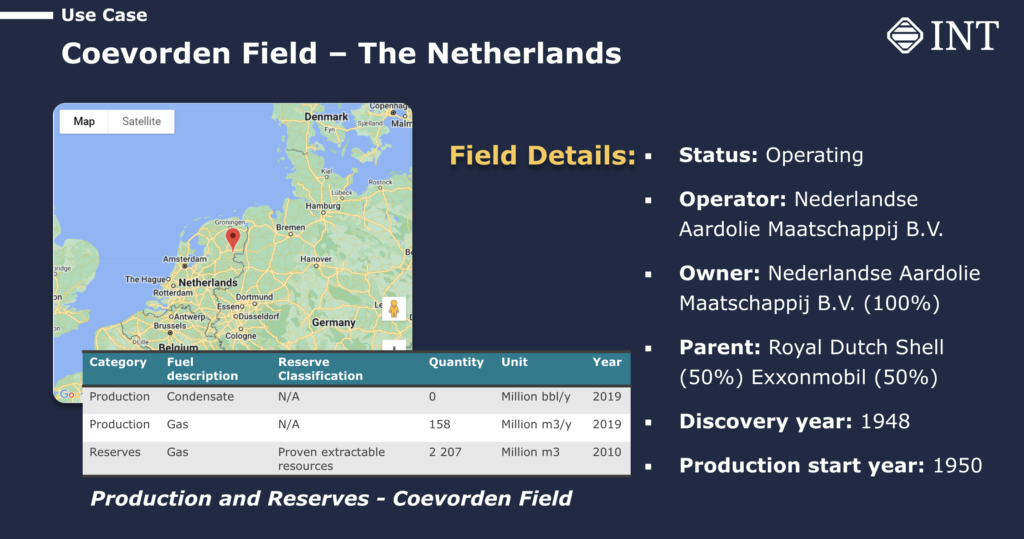
To illustrate the power of IVAAP in streamlining the production geology workflow, let’s look at the case study of the Coevorden Field, a gas field in the Netherlands. This field is still operating as a joint venture between Shell and ExxonMobil and is considered a very mature field with significant gas reserves. GeomodL International used IVAAP to analyze the production data, G&G data, and 3D models of the Coevorden Field.

Pic 4_GeomodL

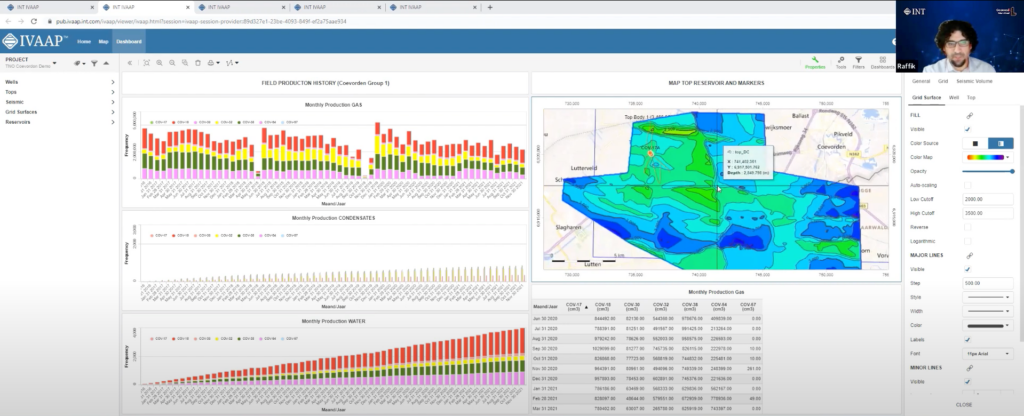
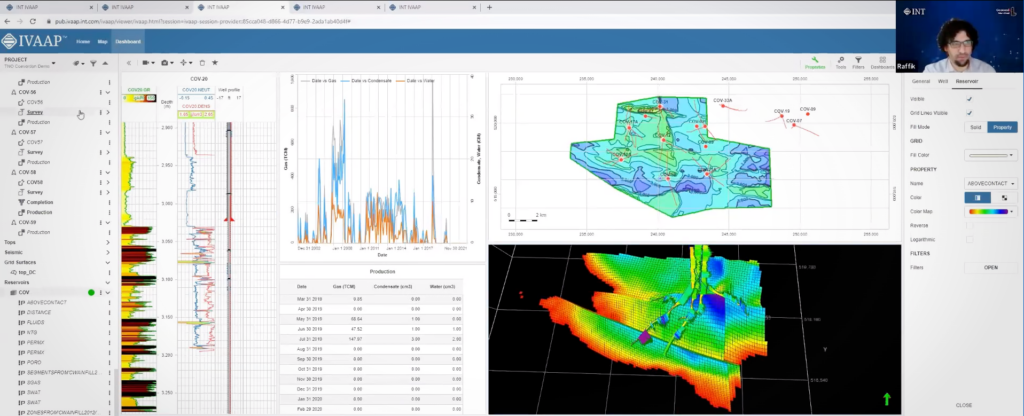
IVAAP is a web-based platform accessible through a modern browser that supports HTML5 and WebSockets, eliminating the need for specific hardware or a powerful machine to perform complex analyses. Upon launching IVAAP, users are greeted with dashboards that can be opened individually to access various tools and functionalities. The dashboards are organized with data on the left, parameters and settings on the right, and widgets such as charts, maps, and 3D windows in the middle.

The first dashboard that proves beneficial for geologists is the production dashboard. It allows users to visualize the performance of wells in the field over time. Users can adjust settings such as the time period and view production data for individual wells or groups of wells. For example, users can track the cumulative production of a group of wells on a monthly or yearly basis and even compare gas production with condensate and water production. The dashboard provides interactive tools to manipulate and analyze the data, such as adjusting time periods to understand the production trends in the field comprehensively.


Pic X_GeomodL

Watch the complete use case here.


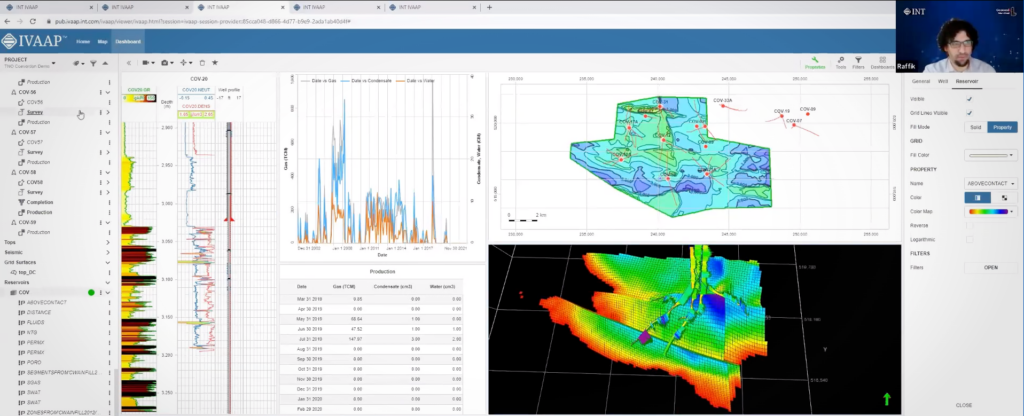
The second dashboard in IVAAP provides more detailed well-level information. Users can access individual well data, including production curves, well logs, and 3D models of the reservoir. The 3D window allows for seamless zooming in and out, and users can interact with the well logs and maps in a synchronized manner. For example, users can view the location of perforations and casing shoes in the well schematic and simultaneously see the corresponding changes in the well logs. This integrated approach allows geologists to analyze production data in the context of the reservoir model, enabling a more comprehensive understanding of the field’s performance.

One of the notable features of IVAAP is its ability to provide a holistic view of the field’s data under the same roof. Geologists and reservoir engineers can access 3D models, top reservoir maps, well schematics, well logs, and production data in one platform. This integrated approach streamlines the analysis process and allows for a more efficient workflow, saving time and resources.


Pic 3_GeomodL

Watch the complete use case here.

As the industry continues to evolve and face new challenges, platforms like IVAAP provide a cutting-edge solution for geoscientists to manage complex data and make informed decisions effectively. By harnessing the power of technology, geoscientists can unlock the full potential of their reservoirs, leading to improved exploration, appraisal, and development strategies. With IVAAP, geoscientists can confidently navigate the reservoir life cycle from exploration to mature fields and drive greater success in oil and gas operations, all from a single point of access.

Visit us online at int.com/ivaap for a preview of IVAAP or for a demo of INT’s other data visualization products. 

For more information, please visit int.flywheelstaging.com or contact us at intinfo@int.com.

____________

ABOUT INT

INT software empowers energy companies to visualize their complex data (geoscience, well, surface reservoir, equipment in 2D/3D). INT offers a visualization platform (IVAAP) and libraries (GeoToolkit) that developers can use with their data ecosystem to deliver subsurface solutions (Exploration, Drilling, Production). INT’s powerful HTML5/JavaScript technology can be used for data aggregation, API services, and high-performance visualization of G&G and energy data in a browser. INT simplifies complex subsurface data visualization.

INT, the INT logo, and IVAAP are trademarks of Interactive Network Technologies, Inc., in the United States and/or other countries.

Filed Under: IVAAP Tagged With: data, data visualization, drilling, Geology, Geoscientists, ivaap, Production, Production geology

May 01 2023

How the Admin Backend Provides Flexibility to IVAAP Customers

The P of IVAAP stands for Platform. As a platform, IVAAP is designed to be modified by INT’s own customers to meet their specific (and sometimes proprietary) needs. Over the years, most of the focus of my blog articles has been on the Data Backend. The Data Backend is the core component of IVAAP that accesses data and makes it available in a standardized form—the IVAAP viewer. The Data Backend is highly specialized for geoscience data. There is, however, another backend, the Admin Backend, that is more generic in nature and that typically doesn’t get as much attention. The goal of this article is to shed some light on how this “other backend” can be customized or consumed to meet customer needs.

Roles of the Admin Backend

The Admin Backend has multiple roles. Some see the Admin Backend as a component managing IVAAP projects. An IVAAP project is essentially an arbitrary grouping of datasets, where each dataset is accessible through the Data Backend. Indeed, the Admin Backend manages projects and all their members. Each member is identified by a URL and often carries metadata, such as its name or location. The actual storage of this information is a PostgreSQL database. The IVAAP Admin Backend provides a simple REST API to the UI to manage project data.

Describing the Admin Backend as a store for projects doesn’t do it justice. It also manages many types of IVAAP entities such as connectors, cloud services, users, groups, dashboards, templates, formulas, and queries. Other data types are geoscience-related, such as curve dictionaries. The Admin Backend is also in charge of providing an audit trail when data is added, updated, or removed. All these features are implemented based on a documented Java API so that INT’s customers can plug their own implementations. Developers are not limited by the REST services that the Admin provides, they can add their own. While the Admin SDK has multiple customization points, the use cases below are the most common.

Customization Use Cases

The first use case of the Admin SDK is the customization of authentication. By default, IVAAP supports two types of authentication. A simple OAUTH2-based authentication, and OpenID Connect. IVAAP customers often have their own authentication system, and IVAAP needs to use that system. To make this possible, the Admin SDK provides a way to customize how users are authenticated, and how sessions are managed and tracked.

The next use case is the customization of key services, typically collection services. For example, the Admin Backend has a service that lists all active users. This service is used by the UI when a template is shared with others. IVAAP customers can plug their own service that will list potential users, for example, listing them from an LDAP server instead of IVAAP’s own PostgreSQL database.

The third use case is the customization of entitlements. Each time a dataset is opened, the Admin Backend is queried to check whether the currently logged-in user has access to this dataset. The default implementation relies on group memberships, but customers can plug their own rules. These rules can be fine-grained, for example, making determinations at the well log levels instead of the well levels.

External Integration Use Cases

The integration of the Admin Backend with other systems goes beyond authentication. The Admin REST services are designed to be called either by a human or a computer. Unlike humans, computers can’t easily log in to a system that requires two-factor authentication. This is why the Admin provides a “Circle of Trust” REST API that allows computers to access its data without the need for a login or password, but rather by a secure exchange of keys. This feature opens new integration use cases.

The first use case for the “Circle of Trust” is the automated retrieval of user activities. Some INT customers require monitoring of user sessions to assess how much IVAAP is used. The REST API for listing user activities is straightforward to use and can be leveraged by a tool outside of IVAAP.

Another use case for the “Circle of Trust” is the automated registration of external workflows. INT customers might have hundreds of machine learning (ML) workflows that are hosted on various systems. With “Circle of Trust” credentials, the endpoints for these workflows can be registered automatically so that they appear as options to IVAAP users.

A Single SDK for Two Backends

The Admin Backend has about 200 REST services, and these services were developed with the same SDK as the Data Backend SDK. It’s the same INT developers who maintain the Data Backend that also maintains the Admin Backend, with no additional training required. It’s not just INT that benefits, but our customers benefit, too. Together, the Data Backend and the Admin Backend provide a unified experience for all Java developers customizing IVAAP servers.

Visit us online at int.com/ivaap for a preview of IVAAP or for a demo of INT’s other data visualization products. 

For more information, please visit int.flywheelstaging.com or contact us at intinfo@int.com.


Filed Under: IVAAP Tagged With: API, backend, developer, ivaap, java, OpenID, SDK, URL

  • « Go to Previous Page
  • Page 1
  • Page 2
  • Page 3
  • Page 4
  • Interim pages omitted …
  • Page 18
  • Go to Next Page »

Footer

Solutions

  • Real-Time Visualization
  • Visualization Components
  • New Energy Visualization
  • OSDU Visualization
  • Machine Learning
  • Developer Tools
  • Cloud Partners
  • Customer Success Stories

Products

  • IVAAP
  • GeoToolkit
  • INTViewer
  • IVAAP Demos
  • GeoToolkit Demos

About

  • News
  • Events
  • Careers
  • Management Team

Resources

  • Blog
  • FAQ

Support

  • JIRA
  • Developer Community

Contact

INT logo
© 1989–2024 Interactive Network Technologies, Inc.
Privacy Policy
  • Careers
  • Contact Us
  • Search

COPYRIGHT © 2025 INTERACTIVE NETWORK TECHNOLOGIES, Inc