• Skip to main content
  • Skip to footer

INT

Empowering Visualization

COMMUNITY BLOG
CONTACT US SUPPORT
MENUMENU
  • Solutions
    • Overview
    • Real-Time Visualization
    • Visualization Components
    • New Energy Visualization
    • OSDU Visualization
    • Machine Learning
    • Developer Tools
    • Cloud Partners
  • Products
    • IVAAP™
          • SOLUTIONS

            Real-Time Visualization

            OSDU Visualization

            Visualization Components

            New Energy Visualization

            Upstream Data Visualization

          • SUCCESS STORIES

            WEATHERFORD
            Well delivery optimization software

            BARDASZ
            Data management, data quality monitoring

            ANPG / SATEC-MIAPIA
            Virtual data room

            MAILLANCE
            High-performance visualization of ML algorithms

            SEE ALL >

          • SUPPORT

            DEVELOPER COMMUNITY
            Join or log in to the INT Developer Community.

            GET SUPPORT
            Log a ticket for an issue or bug.

            CONTACT US

          • DEMOS

            IVAAP DEMOS
            Cloud-Based Demos

            FIRST TIME HERE?
            Register to access our
            IVAAP demos

    • GeoToolkit™
          • SUCCESS STORIES

            CAYROS
            Field development planning

            TOTALENERGIES
            High-performance large dataset reservoir rendering

            IFP ENERGIES NOUVELLES
            Seismic and structural interpretation validation

            SEE ALL >

          • SUPPORT

            DEVELOPER COMMUNITY
            Join or log in to the INT Developer Community.

            GET SUPPORT
            Log a ticket for an issue or bug.

            CONTACT US

          • DEMOS

            GEOTOOLKIT DEMOS
            Geoscience Demos

    • INTViewer™
          • SUCCESS STORIES

            STRYDE
            Fast seismic QA/QC in the field

            SILVERTHORNE SEISMIC
            Efficient 2D/3D seismic data delivery

            WIRELESS SEISMIC
            Drones, IoT, and Advanced Onsite Seismic Data Validation

            SEE ALL >

          • SUPPORT

            GET SUPPORT
            Log a ticket for an issue or bug.

            CONTACT US

          • PLUG-INS

            EXTEND INTVIEWER
            More than 65 plugins available

  • Demos
    • GeoToolkit Demos
    • IVAAP Demos
  • Success Stories
  • Resources
    • Blog
    • Developer Community
    • FAQ
    • INT Resources Library
  • About
    • Overview
    • News
    • Events
    • Careers
    • Meet Our Team
    • About INT

Products

Feb 02 2023

INT Joins SLB Digital Platform Partner Program, Integrating with the DELFI Platform and OSDU Data Platform

INT membership in the SLB digital program enables data-driven decisions across customers’ organizations in one platform, providing a cloud-based digital solution for drilling, wellbore, seismic, production, and reservoir solutions.

Houston, TX—INT today announced it has joined the SLB Digital Platform Partner Program. Joining the program means the IVAAP™ advanced data visualization platform will be accessible to customers through the DELFI™ digital E&P platform from SLB. IVAAP applications will be integrated with the DELFI platform and the OSDU™ Data Platform. This helps solve the challenge of storing, organizing, migrating, and accessing subsurface data, delivering flexibility in the use of the customers’ data between applications and domains.

SLB DELFI
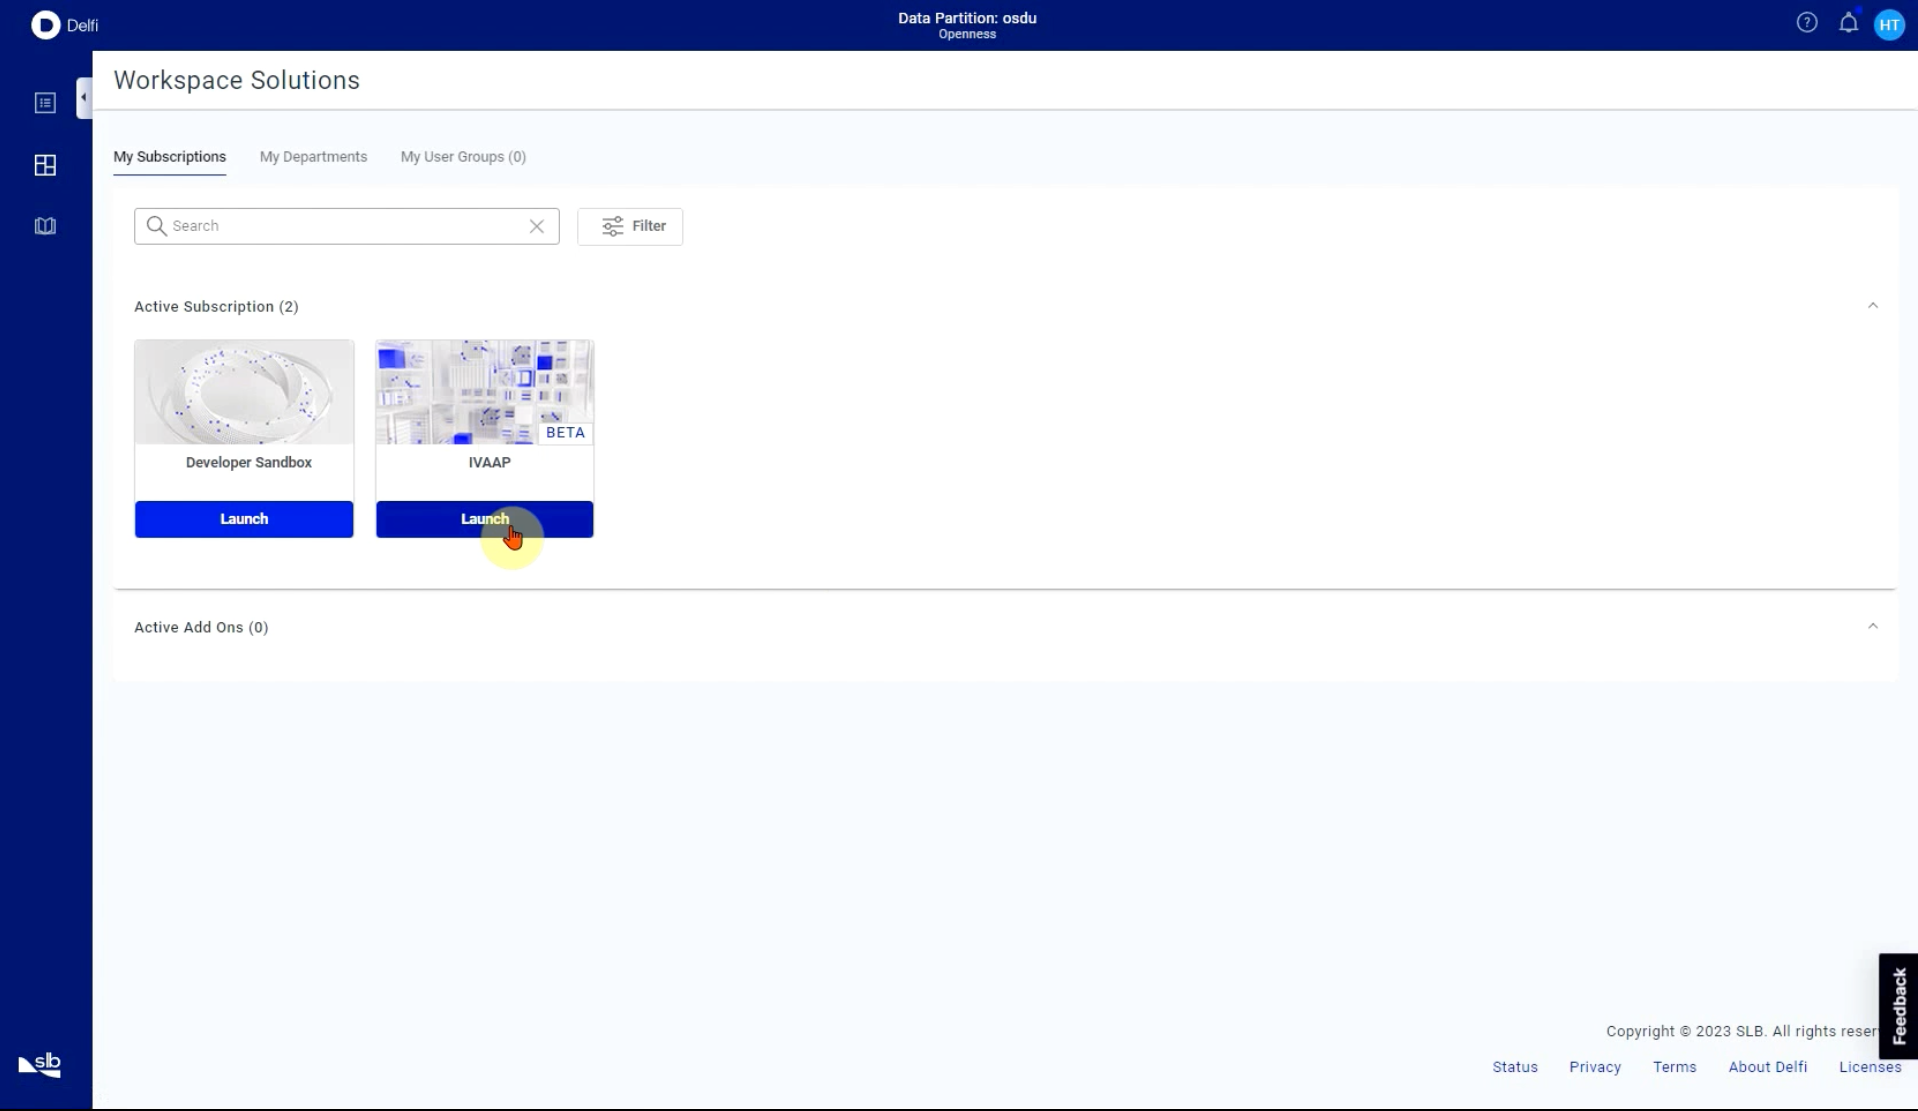
Launch IVAAP directly from the SLB DELFI Portal 

Deploying IVAAP through the DELFI platform creates integration capabilities that were not possible before. Data is liberated across systems to accelerate quality decision-making, fast-track automation with artificial intelligence and machine learning, and optimize cost.

IVAAP - DELFI
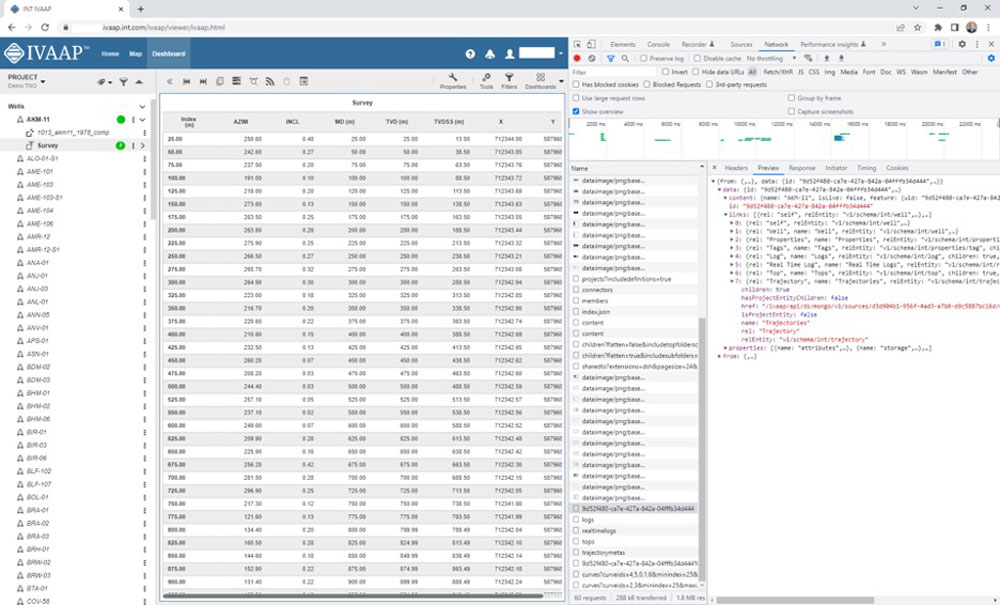
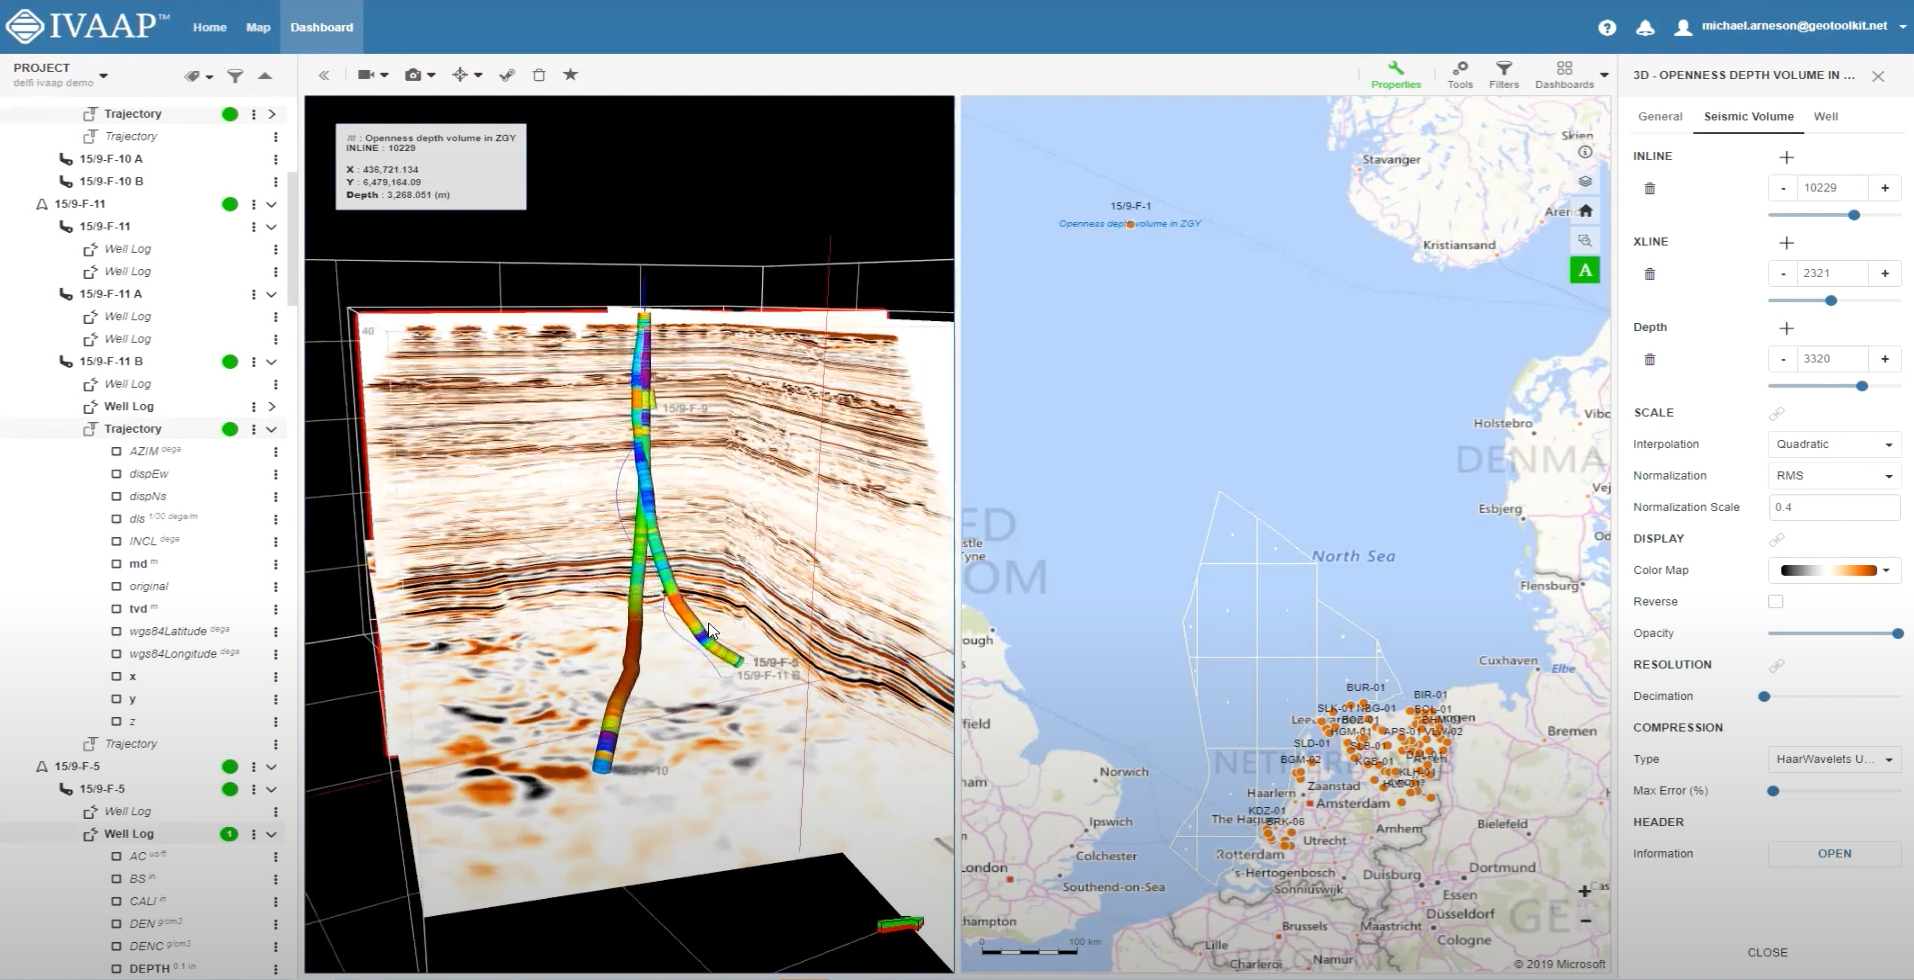
Explore your 2D/3D seismic data — view horizons, faults, trajectories, and more within the same 3D view

This interoperability helps companies rapidly advance their digital transformation and extract maximum value from their data. With 2D and 3D upstream data visualization, IVAAP empowers energy companies to quickly build cloud-based digital solutions for drilling, wellbore, seismic, production, and reservoir solutions.


“The digital transformation of E&P workflows has become a reality for everyone. Having the INT IVAAP™ data visualization app on the DELFI platform gives customers flexibility with advanced visualization, delivering deep insights from their subsurface environment and enabling them to interact and collaborate with their subsurface data; they can work better, smarter, and faster. The DELFI platform with the IVAAP app and the OSDU™ Data Platform enables geoscientists, data scientists, and engineers to visualize and interact with large datasets, build data collections, as well as implement their own workflows. The DELFI platform, OSDU, and IVAAP are a great fit!”

—Dr. Olivier Lhemann, Founder and President, INT


By becoming part of the SLB Digital Platform Partner Program and integrating IVAAP with the DELFI platform, INT and SLB demonstrate full commitment to OSDU standards and openness to support operators, national oil companies (NOCs), and international oil companies (IOCs) to transform and successfully undertake the challenges of the energy transition.

Visit us online at int.com/ivaap for a preview of IVAAP or for a demo of INT’s other data visualization products. 

For more information, please visit int.flywheelstaging.com or contact us at intinfo@int.com.

____________

ABOUT INT

INT software empowers energy companies to visualize their complex data (geoscience, well, surface reservoir, equipment in 2D/3D). INT offers a visualization platform (IVAAP) and libraries (GeoToolkit) that developers can use with their data ecosystem to deliver subsurface solutions (Exploration, Drilling, Production). INT’s powerful HTML5/JavaScript technology can be used for data aggregation, API services, high-performance visualization of G&G and energy data in a browser. INT simplifies complex subsurface data visualization.

For more information about IVAAP or INT’s other data visualization products, please visit https://int.flywheelstaging.com.

INT, the INT logo, and IVAAP are trademarks of Interactive Network Technologies, Inc., in the United States and/or other countries.


Filed Under: IVAAP Tagged With: DELFI, ivaap, OSDU, Schlumberger, SLB

Oct 11 2022

Microsoft and INT Deploy IVAAP for OSDU Data Platform on Microsoft Energy Data Services

This post was co-authored by Kadri Umay, Principal Program Manager, Microsoft.

Energy companies are currently going through a massive transformation by moving hundreds of applications to monitor, interpret, and administer their data into the cloud. In addition, they have embarked on adopting a common data standard, the OSDU™ Data Platform, to simplify interoperability between applications to facilitate data access, exchange, and collaboration.

With Microsoft Energy Data Services, energy companies can leverage new cloud-based advanced data visualization capabilities for geoscientists provided by INT and Microsoft Energy Data Services.

Microsoft Energy Data Services is a data platform fully supported by Microsoft, that enables efficient data management, standardization, liberation, and consumption in energy exploration. The solution is a hyperscale data ecosystem that leverages the capabilities of the OSDU Data Platform and Microsoft’s secure and trustworthy cloud services with our partners’ extensive domain expertise.

INT is proud to be among the early adopters who have been involved since the preview of Microsoft Energy Data Services. INT is a very active member of the OSDU Forum that offers IVAAP™, an advanced data visualization platform that allows geoscientists to easily access, interact with, and visualize data to create dashboards within Microsoft Azure, leveraging Microsoft Energy Data Services.

The IVAAP data visualization platform helps geoscientists and data scientists simplify their data work with the following features:

  • Access to the OSDU Data Platform is already supported (well, seismic, reservoir), and any other data sources from a single application in the cloud.
  • Full interoperability, which means data types aligned with the OSDU Data Platform can be extended to support custom formats and aggregate custom DDMS.
  • Intuitive, user-defined dashboards for engineers, geophysicists, and managers to visualize and interact with large datasets of well logs and seismic schematics, build data collections, and launch their machine learning—all from one place.
  • Many standard data connectors, powerful APIs, and SDKs that provide developers and architects ways to implement their own workflow easily.
  • Accelerated delivery of geoscience, drilling, and production cloud-enabled solutions with seamless support on Microsoft Azure.

“Providing a reliable, trusted platform as a service that accelerates the deployment of the OSDU Data Platform is key for any successful cloud transformation. Through the IVAAP platform’s integration with Microsoft Azure, customers will now have immediate access to these capabilities. This integration will simplify the access and provisioning of the massive amount of data generated by the energy industry, enabling impeccable and secure digital interactions. Our partnership with Microsoft in deploying Microsoft Energy Data Services is an important step toward our goal of providing reliable, cost-effective solutions for energy ISVs in the OSDU Data Platform.”

—Dr. Hughes Thevoux-Chabuel, VP Cloud Solutions, INT


Microsoft Energy Data Services is an enterprise-grade, fully managed OSDU Data Platform for the energy industry that is efficient, standardized, easy to deploy, and scalable for data management—ingesting, aggregating, storing, searching, and retrieving data. The offering will provide the scale, security, privacy, and compliance expected by our enterprise customers. The platform offers out-of-the-box compatibility with INT IVAAP, an advanced data visualization platform that allows geoscientists to easily access, interact with, and visualize the OSDU Data Platform to create dashboards with data contained in Microsoft Energy Data Services.

Learn more

  • Get started with Microsoft Energy Data Services today.
  • Watch the INT demo: IVAAP Data Visualization on Microsoft Azure using Microsoft Energy Data Services.

Visit us online at int.com/ivaap for a preview of IVAAP or for a demo of INT’s other data visualization products. 

For more information, please visit int.flywheelstaging.com or contact us at intinfo@int.com.


Filed Under: IVAAP Tagged With: ivaap, Microsoft, microsoft energy data services, OSDU

Oct 03 2022

INT Releases IVAAP 2.10 Which Brings New Features for More Integrated E&P with OSDU Workflows and Data Interoperability

New release delivers enhanced user experience for data search and data collection and higher performance for seismic, well data, and reservoir visualization in the cloud. 

Houston, TX — INT announced today the availability of IVAAP™ 2.10, the latest version of the world’s leading subsurface data visualization platform for Energy data. IVAAP 2.10 delivers performance improvements to drive faster analysis and better data-driven business decisions. 

This release features new integrations with key industry partners such as Schlumberger DELFI and Microsoft Energy Data Solutions to solidify IVAAP’s robust interoperability capabilities across platforms. 

We see clearly an uptake in the number of operators starting to deploy the latest M13 version of OSDU on AWS, Azure, or IBM Red Hat OpenShift cloud platform. Many of these operators have selected IVAAP—a unique application that helps users search, select, visualize, and QC all the data that has been ingested natively into OSDU—as their visualization platform of choice. 

“IVAAP is the most innovative digital workspace solution for the Energy industry. We foster strong, ongoing collaborations with major Energy companies and global solutions partners to facilitate true interoperability across the data ecosystem for our clients,” said Dr. Olivier Lhemann, president and founder of INT. “We are proud to be able to offer two new partnerships with this release and look forward to expanding our roster in the coming months.”

Accessing data should be a seamless part of any workflow, so IVAAP 2.10 includes new map-based search and data collection functionality to deliver a streamlined digital workspace to empower fast data discovery.

Seismic workflows within IVAAP gain a significant boost with this release, thanks to performance improvements for large 3D datasets, new peel and reveal functionality, and new arbitrary line editing. IVAAP’s reservoir visualization supports larger grid sizes, faster rendering in the cloud, and significant improvement in performance.


Visit us online at int.com/ivaap for a preview of IVAAP or for a demo of INT’s other data visualization products. 

Read the full press release on PRWeb

For more information, please visit int.flywheelstaging.com or contact us at intinfo@int.com.


____________

ABOUT INT

INT software empowers energy companies to visualize their complex data (geoscience, well, surface reservoir, equipment in 2D/3D). INT offers a visualization platform (IVAAP) and libraries (GeoToolkit) that developers can use with their data ecosystem to deliver subsurface solutions (Exploration, Drilling, Production). INT’s powerful HTML5/JavaScript technology can be used for data aggregation, API services, high-performance visualization of G&G and energy data in a browser. INT simplifies complex subsurface data visualization.


For more information about IVAAP or INT’s other data visualization products, please visit https://int.flywheelstaging.com.


INT, the INT logo, and IVAAP are trademarks of Interactive Network Technologies, Inc., in the United States and/or other countries.


Filed Under: IVAAP

Sep 14 2022

How IVAAP Maximizes Use of HATEOAS Links

Ever since the concept of web services first gained popularity, developers attempting to use these web services have faced two challenges: The first challenge is finding the right service to use; the second challenge is writing the code to call these services. The goal of this article is to describe how IVAAP uses HATEOAS hypermedia links to address both problems. We’ll also try to highlight other use cases benefiting from the concept of hypermedia applied to microservices.

A Brief Description of HATEOAS

Most microservices developed today (including IVAAP’s) use a REST API. REST stands for “REpresentational State Transfer.” It’s a term coined by Roy Fielding, who is also the inventor of “Hypermedia as the Engine of Application State,” or HATEOAS. It describes REST services that use hypermedia links to describe how they relate to other services.

For example, in IVAAP, the metadata of a seismic dataset is typically accessible through a URL such as this one:

https://…/ivaap/api/ds/geofiles/v1/sources/a8b05811-6409-43bb-8902-c9142ab48cff/seismic/cG9zZWlkb24gdmRzIG4gc2VneS9Qb3NlZGlvbiBkZXB0aC9wc2RuMTFfVGJzZG1GX2Z1bGxfd19BR0NfTm92MTFfdmVsNV9kZXB0aF8zMmJpdHMueGd5

Unlike the JSON content returned by a classic REST service, the JSON content returned by this IVAAP service contains more than just the requested metadata. It also contains a “links” JSON node that leads to additional information about this seismic dataset.

Picture1A sample JSON output for the IVAAP “seismic metadata” service, as shown in Google Chrome Developer Tools


In the example above, there are multiple HATEOAS links. One of them is the “Geometry” link. The purpose of the seismic geometry service is to expose the shape of seismic surveys. The URL of this service is:

https://…/ivaap/api/ds/geofiles/v1/sources/a8b05811-6409-43bb-8902-c9142ab48cff/seismic/cG9zZWlkb24gdmRzIG4gc2VneS9Qb3NlZGlvbiBkZXB0aC9wc2RuMTFfVGJzZG1GX2Z1bGxfd19BR0NfTm92MTFfdmVsNV9kZXB0aF8zMmJpdHMueGd5/geometry

This Geometry service is meant to be used by applications showing seismic datasets on a map. An application leveraging HATEOAS links would typically examine the “links” returned by the “seismic metadata” service to retrieve the URL of the associated “geometry” service. An application not leveraging HATEOAS links would hardcode the logic that /geometry needs to be added to the URL of the “seismic metadata” service to get the same result.

Both approaches are valid, but the HATEOAS approach brings multiple benefits that we are going to detail.

The “Broken Link” Issue Applied to Data

If you surfed in the ’90s, you are certainly familiar with the concept of “broken links.” Back in those days, websites were made of pages maintained by hand, and text on these web pages was often peppered with underlined words (often colored in blue) leading to another page. If the target page was moved, the link would stop working and the web surfer would be greeted by an unhelpful 404 error instead.

The lesson from these early days is that web page URLs are anything but permanent. The initial idea behind HATEOAS links is that this lesson can be applied to web services, too. If an application uses a hard-coded service URL to read data, this application will immediately stop working if that web service is moved. If each microservice describes the URL of related microservices, then the application can just follow URLs instead of using hard-coded versions. The maintenance of URLs becomes a server concern, and no longer a service consumer concern.

The main issue with this concept is that its purported benefits are unproven in the real world. To prove the benefit of this “forward compatibility” approach, you’d have to observe the life-cycle of many microservices (and consumers of these microservices) over a long period of time to determine whether the use of HATEOAS links was worth it. Taking IVAAP as an example, even though the IVAAP microservices use HATEOAS links, changing the URL of an IVAAP REST API is a rare event. One of the reasons is that there is no way to enforce the use of these links on the service consumer side. HATEOAS doesn’t provide a guarantee that no consumer hard-coded any URL. It is even sometimes faster to use hard-coded URLs, for example, to restore dashboards.

The second issue is that the “broken link” issue is a narrow backward compatibility concern, focused on URL changes only. While services may move, their API might also change, and HATEOAS doesn’t provide a way to address the backward compatibility of service APIs.

Discoverability

While HATEOAS links may help address issues associated with changing URLs, HATEOAS links really shine when it comes to discoverability. A component like the IVAAP Data Backend has hundreds of microservices. It doesn’t matter if each one of these services is documented, just finding whether a service exists is a complex task. HATEOAS links clearly indicate all URLs related to the data being accessed, in a consistent manner.

IVAAP is a platform. It was designed so that INT customers can modify the user interface using the IVAAP Client SDK, and we strive to make it as easy as possible. HATEOAS links give contextual documentation of the services that are available for any server-side object that the UI is accessing. As a result, modifying the IVAAP UI doesn’t require client-side developers to discover the server-side REST API before getting started. Developers can be immediately productive.

Testing

Developing a web-based application like IVAAP has a bit of a chicken-and-egg problem. You need to start by developing the data services first, but you don’t really know how well they work until the UI consuming these services is complete.

To get ahead of the game, there are methods to unit test data services, but they are time-consuming to follow. Just building by hand the right URL to test takes time, especially with long URLs. And because data quality varies, bugs might be data-specific and you need to test a bunch of them to make sure your data services are rock solid.


Following HATEOAS Links with Postman

Following HATEOAS links with Postman.


A widely used tool to inspect and test web services is Postman. Postman “understands” HATEOAS links and testing your work just consists of following links within Postman, just like you would do with an HTML-based website.

The most common use case of the IVAAP Data Backend SDK is when INT customers write a connector that accesses a proprietary data source. The testing steps of such a connector are typically very fast because they don’t require the UI to be ready. Most bugs can be found immediately, just using Postman.

Going Beyond: Automatic UI Generation

Discoverability and testability are well-known benefits of including HATEOAS links in a REST API. IVAAP also uses HATEOAS links to generate part of its user interface. For example, the tree that is shown to users when they open a well is server-driven, not client-driven. The IVAAP UI parses the HATEOAS links and builds a tree of nodes based on them.

Not all wells have the same details of data. Some wells might only have a location, others might have a trajectory. The presence of relevant HATEOAS links is what gives the UI the information on which data is available for that well. The IVAAP UI doesn’t need to understand what a trajectory is to include a trajectory node under a well node. The tree is generated automatically from HATEOAS links.

The Nodes Under the “AKM-11” Well (left)

The nodes under the “AKM-11” well (left), as listed by the HATEOAS link for that well (right).


Not all HATEOAS links associated with an object are meant to be shown as nodes in the UI. By convention, only the HATEOAS links with the attribute “children” set to true should be shown. Customers who want to customize the nodes shown in the UI don’t need to write client-side code. They have complete control by just plugging their own code into the Data Backend.

The same technique is used to build the UI, allowing users to add datasets to their projects. The Data Backend advertises through HATEOAS links how data from a connector can be browsed, and the UI parses these HATEOAS links to build a matching user interface.

User Interface Generated when Listing Wells in a “mongo” Connector

User interface generated when listing wells in a “mongo” connector.


Each data source has different capabilities, and this is reflected in the user interface. Some data sources might support search by name, paging, or sorting. For example, when search by name is supported on the server side, the IVAAP UI may propose a search box. IVAAP advertises querying capabilities to the user interface by including a “supportedQueries” attribute along its HATEOAS links.

A Sample JSON Output for the IVAAP “connector” Service

A sample JSON output for the IVAAP “connector” service, as shown in Google Chrome Developer Tools.

Likewise, it is sometimes convenient to be able to edit the name of a dataset from the same user interface. Not all data sources support name editing, and it’s only when editing is supported by a connector that a relevant HATEOAS link should be included in the server responses.

A Sample JSON Output for the IVAAP “connector” Service, as Shown in Google Chrome Developer Tools

A sample JSON output for the IVAAP “connector” service, as shown in Google Chrome Developer Tools.

In the response above, not only the Data Backend advertises that data names can be edited, but it also indicates it supports data deletion.

This concept of automated UI generation using HATEOAS links is not a standard use. It requires the addition of attributes that are typically not seen in web services using HATEOAS links. They have powerful tools as they reduce the amount of work on the client side. Actually, the IVAAP REST API is designed to support more complex than the two use cases already mentioned.

A majority of the IVAAP REST services are either services returning a collection of meta-data, or services returning the meta-data of a single dataset. The JSON format of these two types of services is standardized across the IVAAP Data Backend. Because the services provide consistent JSON outputs, it is easy to write a generic UI that will browse through the entire tree of meta-data and even allow editing. In other words, you can write a basic IVAAP client from scratch without much effort on the UI side.

A completely automated UI would not be limited by the search and editing capabilities advertised in HATEOAS links. Each IVAAP REST service comes with its own documentation. This documentation is accessible in the OpenAPI 3.0 format using a standard mechanism.

In this mechanism, if the URL of the service listing wells in a MongoDB database is: https://…/ivaap/api/ds/mongo/v1/sources/a8b05811-6409-43bb-8902-c9142ab48cff/wells/, the URL of its matching OpenAPI documentation would be: https://…/ivaap/api/ds/mongo/v1/sources/a8b05811-6409-43bb-8902-c9142ab48cff/wells/openapispecs

A completely automated UI could expose the search parameters described in this documentation, a bit like SwaggerEditor does. This wouldn’t be limited to search, the same principle can be applied to updating and deleting data.


A Form Generated Automatically by SwaggerEditor

A form generated automatically by SwaggerEditor from the OpenAPI specification of the wells service.


Going Beyond: Batch Support

Another feature enabled by HATEOAS links is the ability to fetch multiple aspects of a dataset in one HTTP call.

Microservices work best when they do only one thing at a time, but this means the IVAAP client needs to make multiple calls to the Data Backend to restore a dashboard. Currently, Google Chrome only allows up to 6 concurrent HTTP connections per host, sometimes forcing the client to “wait” for the availability of connections. This has a direct impact on the user experience.

To help with this, the IVAAP Data Backend provides a so-called “Batch” REST API to retrieve the content behind multiple URLs in one go. Other servers also have this feature, but what’s different about IVAAP’s Batch API is that it allows developers to leverage HATEOAS links.

For example, if you are building a data map and need to retrieve the metadata of a seismic dataset along with its outline, you would specify to the Batch REST API that you need to retrieve the content behind  https://…/ivaap/api/ds/geofiles/v1/sources/a8b05811-6409-43bb-8902-c9142ab48cff/seismic/cG9zZWlkb24gdmRzIG4gc2VneS9Qb3NlZGlvbiBkZXB0aC9wc2RuMTFfVGJzZG1GX2Z1bGxfd19BR0NfTm92MTFfdmVsNV9kZXB0aF8zMmJpdHMueGd5 as well as the content behind the associated “Geometry” HATEOAS link. This method of fetching multiple aspects of a dataset at once is much more expressive than passing multiple URLs to the Batch REST API.

Something that should be noted when it comes to performance is that we made the HATEOAS links an optional feature of IVAAP. Consumers of the IVAAP Data Backend API who don’t use these links can opt to reduce the size of the JSON payload between the client and the server. The default behavior of the Data Backend is to include HATEOAS links, but the collection services can be called in a way that excludes these links completely or only includes specific, named links.

Conclusion

HATEOAS links have been a part of the IVAAP Data Backend since day one. Over time, we found that they pack much more functionality than we initially thought. All these features have a common goal: facilitating the work of the UI developers and accelerating the delivery of software. While I used examples from IVAAP, the ideas in this article can easily be applied to your own data backend.

For more information or for a free demo of IVAAP, visit int.com/products/ivaap/.


Filed Under: IVAAP Tagged With: backend, HATEOAS, ivaap, metadata, microservices, URL, web services

Jun 28 2022

INT and ANPG Improve Collaboration on Oil & Gas Concessions by Creating Virtual Data Room Leveraging IVAAP Technology

The ANPG VDR solution—implemented with a unique partnership between MIAPIA, SATEC and INT—enables companies to remotely assess the potential and requirements for better block concession management.

INT announced today the completion of a Virtual Data Room (VDR) for the Angola’s National Agency for Oil, Gas and Biofuels (Agência Nacional de Petróleo, Gás e Biocombustíveis) (“ANPG”), developed through collaboration with SATEC and MIAPIA.

The ANPG VDR is a cloud platform based on INT’s IVAAP subsurface data visualization platform and implemented with and by SATEC and MIAPIA. The platform allows secure access to E&P data managed by the Gabinete de Archivo de Datos (Data Management Department) of ANPG. The platform restricts user access to specific, predefined data sets.

Some of the VDR’s greatest functionalities are the support for the most important objects and formats in the sector (well logs, 2D and 3D seismic, trajectories, or lithology) through connectors to databases that store E&P information in the most common file formats: LAS, DLIS, SEG-Y. It also allows the visualization and research of these data on a GIS platform and access and preview of technical reports in PDF format.

“ANPG is very pleased with the implementation of the Virtual Data Room solution, a strategic tool for the promotion of Angola’s oil potential and the attraction of foreign investment, as well as the digital transformation of the organization itself,” said Lúmen Sebastião, GAD Director, ANPG.

To date, the VDR supplies E&P data related to offshore blocks, Baixo Congo Basin, and Kwanza Basin. More than 20 VDR sessions have been held, with the participation of 15 companies. Furthermore, ANPG is participating in benchmarking activities, sharing with colleagues from other countries their experience with the VDR solution.

To learn more about the ANPG VDR, visit int.com/anpg-vdr/ or for a preview of IVAAP, visit int.com/ivaap/.

For more information, please contact us at intinfo@int.com.

____________
ABOUT INT
INT software empowers energy companies to visualize their complex data (geoscience, well, surface reservoir, equipment in 2D/3D). INT offers a visualization platform (IVAAP) and libraries (GeoToolkit) that developers can use with their data ecosystem to deliver subsurface solutions (Exploration, Drilling, Production). INT’s powerful HTML5/JavaScript technology can be used for data aggregation, API services, and high-performance visualization of G&G and energy data in a browser. INT simplifies complex subsurface data visualization.

INT, the INT logo, and IVAAP are trademarks of Interactive Network Technologies, Inc., in the United States and/or other countries.

Filed Under: IVAAP Tagged With: anpg, ivaap, satec, vdr, virtual data room

  • « Go to Previous Page
  • Page 1
  • Page 2
  • Page 3
  • Page 4
  • Page 5
  • Interim pages omitted …
  • Page 18
  • Go to Next Page »

Footer

Solutions

  • Real-Time Visualization
  • Visualization Components
  • New Energy Visualization
  • OSDU Visualization
  • Machine Learning
  • Developer Tools
  • Cloud Partners
  • Customer Success Stories

Products

  • IVAAP
  • GeoToolkit
  • INTViewer
  • IVAAP Demos
  • GeoToolkit Demos

About

  • News
  • Events
  • Careers
  • Management Team

Resources

  • Blog
  • FAQ

Support

  • JIRA
  • Developer Community

Contact

INT logo
© 1989–2024 Interactive Network Technologies, Inc.
Privacy Policy
  • Careers
  • Contact Us
  • Search

COPYRIGHT © 2025 INTERACTIVE NETWORK TECHNOLOGIES, Inc