• Skip to main content
  • Skip to footer

INT

Empowering Visualization

COMMUNITY BLOG
CONTACT US SUPPORT
MENUMENU
  • Solutions
    • Overview
    • Real-Time Visualization
    • Visualization Components
    • New Energy Visualization
    • OSDU Visualization
    • Machine Learning
    • Developer Tools
    • Cloud Partners
  • Products
    • IVAAP™
          • SOLUTIONS

            Real-Time Visualization

            OSDU Visualization

            Visualization Components

            New Energy Visualization

            Upstream Data Visualization

          • SUCCESS STORIES

            WEATHERFORD
            Well delivery optimization software

            BARDASZ
            Data management, data quality monitoring

            ANPG / SATEC-MIAPIA
            Virtual data room

            MAILLANCE
            High-performance visualization of ML algorithms

            SEE ALL >

          • SUPPORT

            DEVELOPER COMMUNITY
            Join or log in to the INT Developer Community.

            GET SUPPORT
            Log a ticket for an issue or bug.

            CONTACT US

          • DEMOS

            IVAAP DEMOS
            Cloud-Based Demos

            FIRST TIME HERE?
            Register to access our
            IVAAP demos

    • GeoToolkit™
          • SUCCESS STORIES

            CAYROS
            Field development planning

            TOTALENERGIES
            High-performance large dataset reservoir rendering

            IFP ENERGIES NOUVELLES
            Seismic and structural interpretation validation

            SEE ALL >

          • SUPPORT

            DEVELOPER COMMUNITY
            Join or log in to the INT Developer Community.

            GET SUPPORT
            Log a ticket for an issue or bug.

            CONTACT US

          • DEMOS

            GEOTOOLKIT DEMOS
            Geoscience Demos

    • INTViewer™
          • SUCCESS STORIES

            STRYDE
            Fast seismic QA/QC in the field

            SILVERTHORNE SEISMIC
            Efficient 2D/3D seismic data delivery

            WIRELESS SEISMIC
            Drones, IoT, and Advanced Onsite Seismic Data Validation

            SEE ALL >

          • SUPPORT

            GET SUPPORT
            Log a ticket for an issue or bug.

            CONTACT US

          • PLUG-INS

            EXTEND INTVIEWER
            More than 65 plugins available

  • Demos
    • GeoToolkit Demos
    • IVAAP Demos
  • Success Stories
  • Resources
    • Blog
    • Developer Community
    • FAQ
    • INT Resources Library
  • About
    • Overview
    • News
    • Events
    • Careers
    • Meet Our Team
    • About INT

Uncategorized

Sep 21 2023

INT Achieves SOC 2 Compliance

HOUSTON, TX – INT, a leader in data visualization software for the Energy industry, is proud to announce a significant milestone in its commitment to data security and customer trust. We have achieved SOC 2 compliance, underscoring our unwavering dedication to safeguarding your data and upholding the highest standards in information security.

What is SOC 2 Compliance?

SOC 2 (System and Organization Controls 2) compliance is an internationally recognized standard that assesses an organization’s ability to securely manage customer data. Achieving SOC 2 compliance means that INT has undergone rigorous third-party audits to validate our adherence to strict security controls and practices.

Why SOC 2 Compliance Matters

At INT, we understand that data is one of your most valuable assets. SOC 2 compliance assures you that we have implemented robust measures to protect your sensitive information from unauthorized access, data breaches, and other security threats. Your data’s confidentiality, integrity, and availability are our top priorities.

Our Commitment to Data Security

Our journey to SOC 2 compliance involved comprehensive assessments of our security practices across key areas, including security, availability, processing integrity, confidentiality, and privacy. These assessments have allowed us to identify and address potential vulnerabilities, ensuring that your data remains in safe hands.

Third-Party Validation

To earn our SOC 2 compliance certification, we enlisted the services of The Johanson Group, a renowned third-party auditing firm to thoroughly assess our security controls and practices. This independent validation demonstrates our unwavering commitment to transparency and accountability in data security.

What SOC 2 Compliance Means for You

By choosing INT, you gain a trusted partner that not only values your data but also takes concrete steps to protect it. Our SOC 2 compliance reflects our dedication to earning your trust and providing you with a secure environment for your data.

For more information about our SOC 2 compliance or to access our SOC 2 documentation, please visit our dedicated compliance/security page at int.com/security. If you have any questions or require further information, please contact us at int.com/contact-us/.

Filed Under: Uncategorized Tagged With: ivaap, security, soc2

Aug 10 2023

INT Simplifies Machine Learning and Processing and Augments Analytics Capabilities with Latest Release of IVAAP Data Visualization Platform

The latest release of IVAAP by INT introduces an array of exciting new features and enhancements, providing users with unparalleled capabilities to extract deeper insights from their subsurface data.

Houston, TX — August 10, 2023 — INT announced today the launch of IVAAP™ 2.11, the latest version of our Universal Cloud Data Visualization Platform. With powerful features and enhanced capabilities, IVAAP™ 2.11 takes subsurface data exploration and visualization to new heights, empowering users to make critical decisions with confidence and efficiency.

Some of the key highlights include: 

  1. External Workflows to Support Machine Learning and Data Processing: With IVAAP™ 2.11, users can now seamlessly integrate external processing workflows and ML capabilities, unlocking the true potential of their data through advanced analytics and data automation.
  2. Unit System Management: IVAAP™ introduces Unit System Management, offering users enhanced control over data consistency and clarity by efficiently managing unit conversions.
  3. WellLog Enhancements: WellLog module sees significant improvements, including support for stacked patterns curve, curve editing, lithology editing, and discrete raster files.
  4. Dynamic Range Intervals: Selected depth intervals can be highlighted in multiple widgets like cross-plot, pie charts, histograms, and more. Moving intervals along the depth are reflected automatically across all widgets.
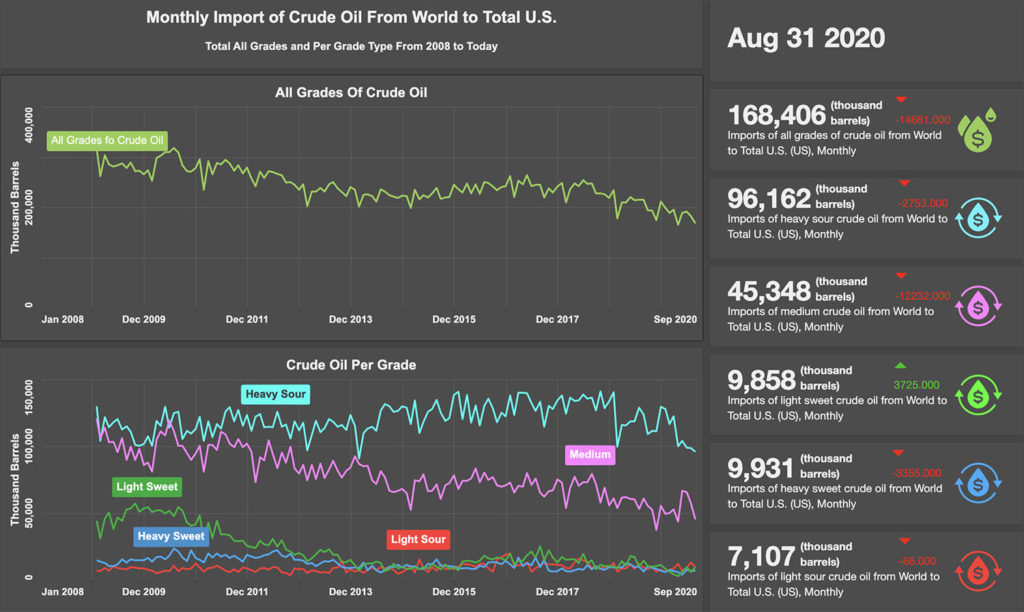
  5. OSDU™ Data Platform Compatibility: IVAAP now offers full support for perforation intervals, stratigraphic columns, well-core images, hole sections, and collections on the OSDU Data Platform. Additionally, KPIs are now available on the IVAAP Home page.

“IVAAP 2.11 represents a significant milestone in our journey towards providing the oil and gas industry with the most advanced and comprehensive data visualization platform. With the introduction of external workflow support for machine learning and data processing and full compatibility with the OSDU Data Platform, IVAAP continues to empower geoscientists and engineers to explore, visualize, and automate their data like never before,” said Hugues Thevoux, VP of Cloud Solutions at INT. “This release underscores our commitment to delivering cutting-edge solutions that drive efficiency, foster innovation, and enable our clients to make smarter decisions with confidence.”


IVAAP 2.11 is now available for all existing users. To experience the power of IVAAP or to schedule a personalized demo, visit int.com/demo-gallery/ivaap/ or contact our sales team at intinfo@int.com.

To learn more about IVAAP 2.11, please visit int.com/products/ivaap/ or contact us at intinfo@int.com.

Read the IVAAP 2.11 Release Notes.
Read the press release on PRWeb.

____________

ABOUT IVAAP:

IVAAP™ is a Universal Cloud Data Visualization Platform where users can explore domain data, visualize 2D/3D G&G data (wells, seismic, horizons, surface), and perform data automation by integrating with external processing workflows and ML.

ABOUT INT:

INT software empowers the largest energy and services companies in the world to visualize their complex subsurface data (seismic, well log, reservoir, and schematics in 2D/3D). INT offers a visualization platform (IVAAP) and libraries (GeoToolkit) developers can use with their data ecosystem to deliver subsurface solutions (Exploration, Drilling, Production). INT’s powerful HTML5/JavaScript technology can be used for data aggregation, API services, and high-performance visualization of G&G and petrophysical data in a browser. INT simplifies complex subsurface data visualization.

For more information about IVAAP or INT’s other data visualization products, please visit https://int.flywheelstaging.com.

INT, the INT logo, and GeoToolkit are trademarks of Interactive Network Technologies, Inc., in the United States and/or other countries.

Filed Under: IVAAP, Press Release, Uncategorized Tagged With: cloud, Data Processing, data visualization, ivaap, machine learning, ml, OSDU, welllog

Jun 23 2022

Meet Our Summer Interns!

Four talented and motivated students have recently joined the INT team to be a part of our Summer Internship Program. The program provides an exciting opportunity to contribute to developing new projects and gain fresh insight into the energy industry. 

This summer, our Software Developer Interns will be applying what they have learned so far in school to tasks related to INT’s core products — GeoToolkit and IVAAP. Also, being able to work at an international company with developers from many backgrounds gives them the opportunity to expand their network and work with mentors internationally.

How’s It Going So Far? 

Reflecting back on their first week, here are some highlights so far: 

Angela Cao, a Master’s in Data Science candidate at Rice University, is our Data Science Intern who will be focusing on developing, improving, and implementing machine learning algorithms and techniques in IVAAP. She says, “The best highlight so far is whenever a model or algorithm that we have spent time working on is working successfully or improved in performance. I think celebrating and appreciating the small wins will make us look forward to the bigger victories that will come soon enough.” 

Letian Zhang is working on his Master’s in Computer Science at Rice University and is our Software Development Intern focusing on 3D. Letian is optimizing seismic rendering for GeoToolkit. For him, the best thing so far is the mentorship here at INT: “When I don’t understand a concept, my mentor always provides me with some detailed explanations and carefully makes sure I understand the concept so I can learn how things work behind the scenes.” 

Machine Learning Intern Olivier Kuhn de Chizelle is pursuing his Master’s in Data Science and Analytics from Georgetown University. He’s working on implementing new and improving existing Machine Learning tools supported in IVAAP. “I just joined the team, and from Day One, everyone has been incredibly welcoming and kind — the type of environment in which you want to perform your best!”  

When Software Development Intern Thibault Tonnel, who studies engineering at UT-Austin, was asked to reflect on his first couple of weeks at INT, he said: “I love how nice everyone has been, both in-person and remotely. I have already learned a lot and I am very excited for what’s to come!”


Interns1


Welcome to the team! We are so excited to see what this talented and fun group of students will be able to accomplish this summer — and in their bright futures ahead! 


Filed Under: Uncategorized

Jan 26 2022

Raster Log and TIFF Rendering in the Cloud with GeoToolkit.JS

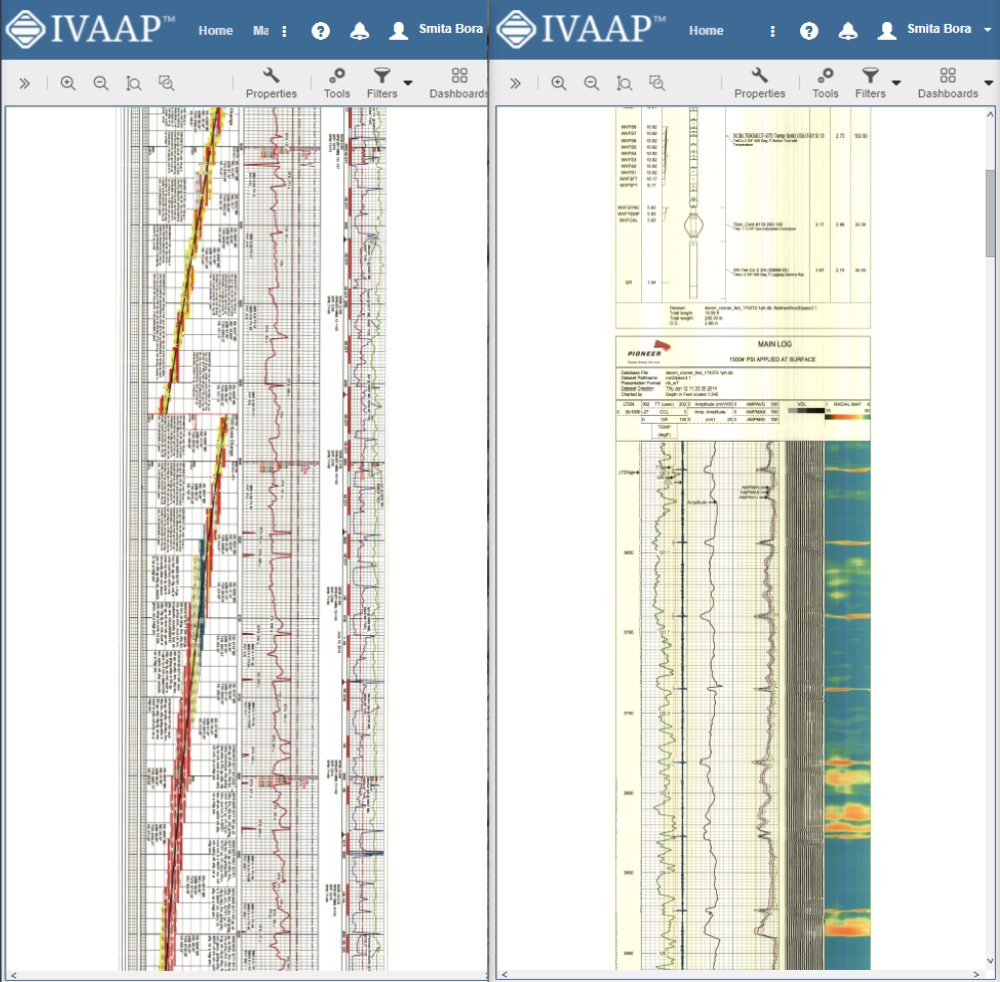
A common challenge that our users face is a need to render and display huge images like raster logs and GeoTIFF files. Interactions occur in the client’s server architecture, and while these images can be stored in the cloud or on a server, they are usually very large files, making it difficult to move from the server to the client. It is also time-consuming to read data from the cloud and unpack operations for TIFFs.

When trying to open these files, the user may have to wait up to several minutes to start to receive data from the server. This can lead to a poor user experience because the client doesn’t know if a server is working or if it’s already halted the solution that we applied. So we wanted to improve this for our users.


Reducing Calculation Complexity

In order to optimize several areas for the client as well as on the server, we decided to focus on the server data loading from cloud storage and enhance the unpacking of TIFFs. We found a way to minimize the number of requests from client to server and pass more calculations from server to client, reducing the calculation complexity on the server.

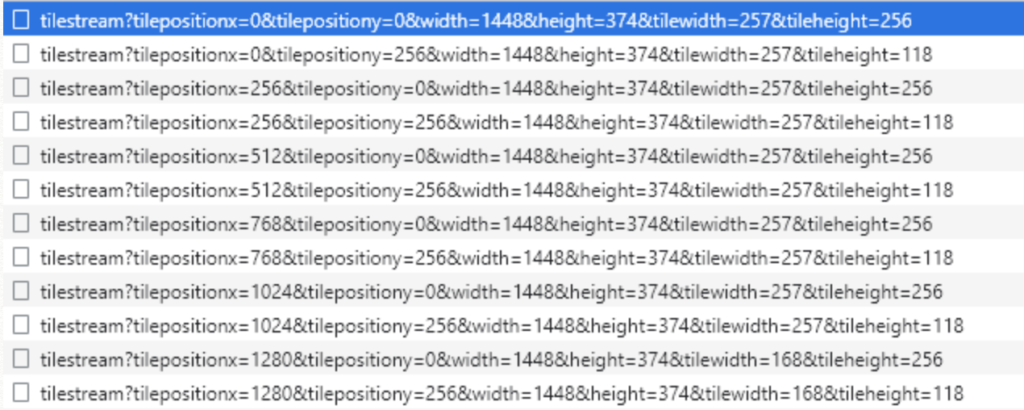
So, how did we do it? On the client side, we have a class called tiled shape which requests tiles from the server.

raster 1

For each tile, the client requests its X and Y position, height, and scaling. In the past, when a user would interact with an image and send a request to the server, requesting new tiles, it would be too much for the server to handle, causing even more delays.

To minimize the impact this request has on the server, we decided to check if the  user stops interaction by timer. After any interaction on the client’s side with the image, we start a timer. Before the timer is up, if no requests are sent from the client to the server, this timer finishes quickly and the image loads. This allows us to minimize the number of requests from client to server.

Calculation and Caching

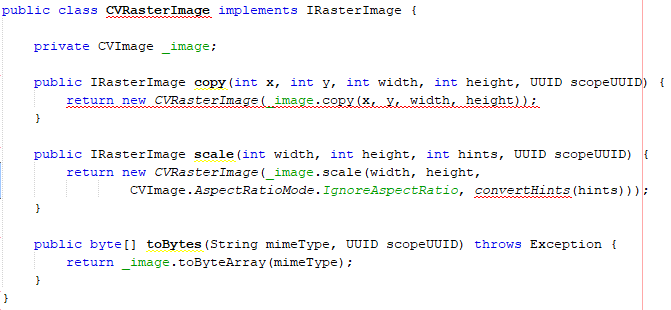
Another feature we optimized is the ability to pass information from the server to plan calculations for the correct tile position and correct tile transformation. By passing the data from server to client, the client calculates the correct position for tile on each side. We also use a cache of tiles on the client side to ensure that we do not request the same tiles. Image cache on a server side is also possible, but after the first request, it is necessary to download the requested image from the cloud, unpack the image, and then start to copy and scale the requested tile to convert this image.


Unpacking the Image

On the server side, we implemented TIFF unpacking on a highly performing native implementation. This is a multithreaded and thread safe solution., which allows us to deal with several requests from clients at the same time. As a result, a large TIFF image file can be stored in the cloud without a problem and an unpacking time of less than four seconds compared to the previous solution’s 60 seconds. We also optimized the cloud access speed on the server side by renting a high-performance AWS instance with high-speed access to AWS cloud storage. This allows us to download the whole TIFF image from the cloud in less than three seconds, making the download speeds about 800 megabytes per second.


raster2

Faster Rasters

As a result, we spend around three seconds to download the image from cloud storage and about four seconds to unpack the image. So it only takes roughly seven seconds to download, unpack the image, deal with client requests, scale the requested tiles, and send them back to the client as opposed to having to wait several minutes to possibly hours for the same process.  Overall, this process greatly improves the user experience.

The new raster logs and cloud TIFF rendering are just one of the many new features and improvements from the latest GeoToolkit.JS 2021.1 release.

To learn more about GeoToolkit.JS 2021, please visit int.com/products/geotoolkit/or contact us at support@int.com.


Filed Under: GeoToolkit, Uncategorized Tagged With: cloud, geotiff, raster, TIFF

Dec 02 2020

IVAAP Release 2.7: More Map Search and ArcGIS Features

IVAAP™ is a subsurface data visualization platform that provides developers and product owners powerful subsurface visualization features for their digital solutions in the cloud. IVAAP enables users to search, access, display, and analyze 2D/3D G&G and petrophysical data in a single user-friendly dashboard on the web. The latest release of IVAAP 2.7 comes with various new features and significant improvements.

Highlights from this release include many advanced search and map capabilities, improved 3D widget filter dialog, new interval curves support, new date/time picker for Cross-Plot widget axis settings, and more! 

Advanced Mapping Capabilities

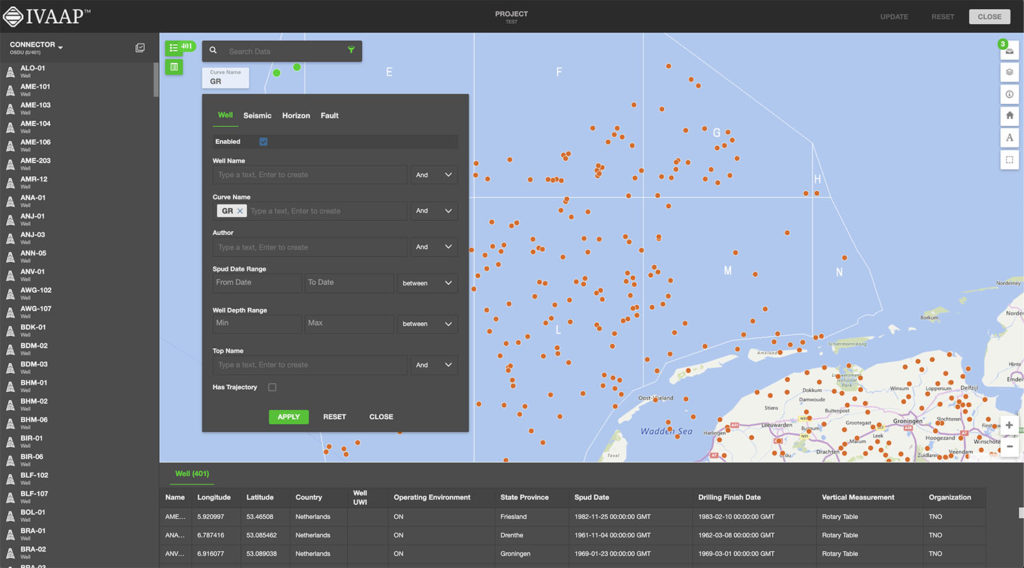
IVAAP features support for visual-based data discovery using map-based search, and is fully integrated with ArcGIS (ESRI), allowing for the search of structured and unstructured data in a data lake or any other file repository. IVAAP supports a wide range of map formats and services like ArcGIS, GeoJSON, KML, Mapbox, Bing, WMS, and more.

With the ArcGIS integration, you can easily access all layers and details from your ArcGIS server and display them within IVAAP to enrich map-based search of well, seismic, and other subsurface data.

New features include the ability to display a dynamic metadata table for a selected object in the map (Well, Seismic, etc.). 

Most layers are supported. Image services (ArcGIS Image Service Layer, Image Services Vector Layers, and WMS) and Tile services (Image Service, ArcGIS Tiled Map Service Layer, Web Tiled Layer, OpenStreetMap) are supported. Feature Services include map service (ArcGIS Feature Layer), KML, WFS, and CSV. We also provide some real-time services support like stream services (ArcGIS Stream Layer), GeoRSS, Vector Tiles (VectorTileLayer), and Bing Maps services. Two extra formats that are supported are GeoJSON and GPX.

This release includes improved search capabilities allowing search across any metadata for any user. Access to data can be restricted to read-only mode. We also made improvements to fence highlighting and access to well lists, and labels can now be saved with the dashboard.


2_7_0_Map Reduced


More Themes Control 

Previously, theme control within IVAAP was a bit limited. We’ve expanded the theme mechanism to all widgets so that users can customize themes with more control and options and access new updated themes.


2_7_0_Customized Themes

Lightmode theme


New Image Widget 

IVAAP can now display simple image files such as jpeg or png files in the image widget, align, and zoom in to show detail. This feature allows users to customize dashboards with logos or other image files needed to display. 

Improvements in 3D

IVAAP’s 3D widget now supports tagging and aliases when displaying well data. We added reservoir data that can be serialized in the dashboard template. Users now have the ability to mix data with CRS and data without CRS. Another new feature is that users can apply properties to multiple or individual objects. And we’ve improved the dashboard restoration of multiple inlines, crossbones, and time slices. Finally, the 3D widget filter dialog has been redesigned.


2_7_0_3D Reduced


New Features in WellLog

For WellLog, we improved the set main index support for templates, dashboards, and well switching. With this improvement, a secondary index can be used to display data into a different index and secondary indexes can be restored when opening an existing dashboard or template. An improved automatic logarithmic mode gives users the ability to add a curve to a logarithmic track. New features added to WellLog include: the ability to automatically rotate labels for lithology and a reset action where users can right-click with the option to clear their display.


WellLog


New in Schematics

For the Schematics package, new features include: perforation with state definition support, the ability to customize by using a filter dialog, and the ability to use cursor tracking between Schematics and WellLog. We also improved the component selection support in the Schematics widget.


schematics 2.7


Time Series: Annotations and Perforations 

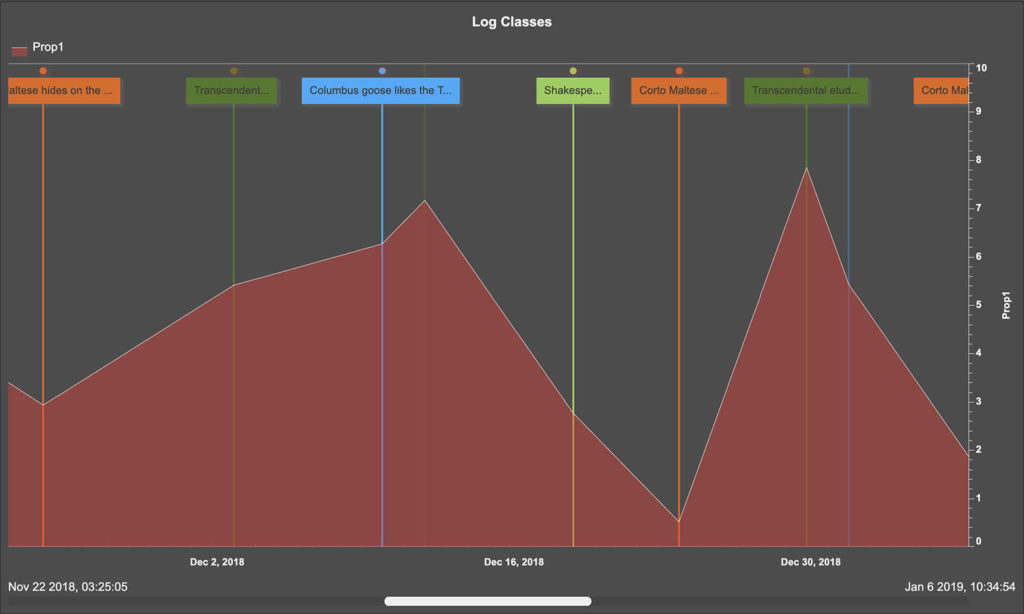
We improved the ability to select a data series from the legend. The Time Series widget now features support for annotations and perforations. The tooltip now shows the index data and time.


TimeSeries


New and Improved Line Chart

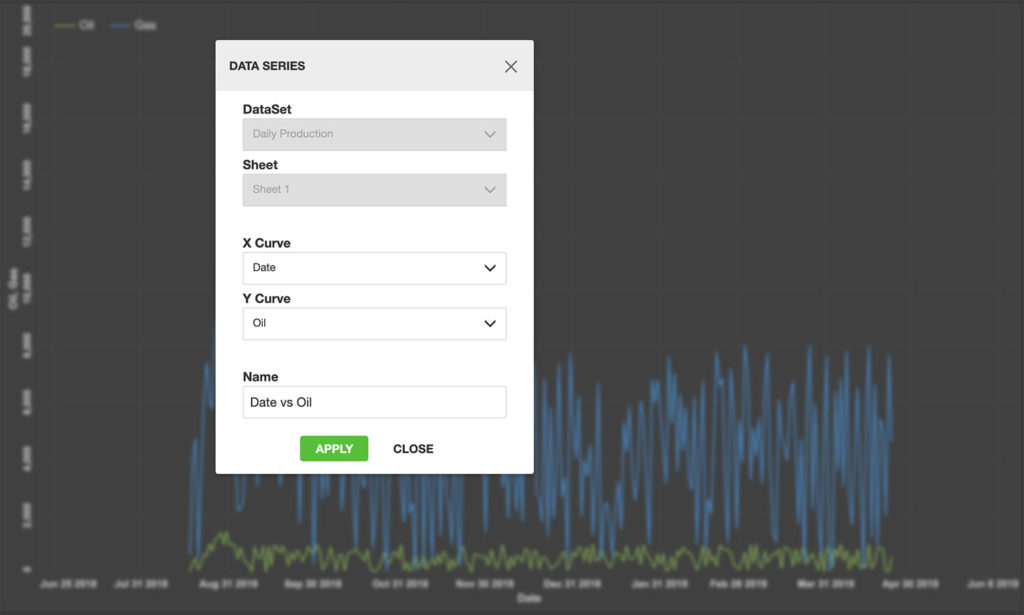
The IVAAP line chart now supports templates and data series dialog. We improved the ability to edit existing data series. Users can now flip the axis for date and time data, and the legend has been improved to show or hide the data series parent. There is also an improvement for single data sets, multi-data sets, and multi parent projects. 


LineChart


This release includes many more improvements to features and to the UI. For more information, check out the full release here.

Or check out int.com/ivaap for a preview of IVAAP or for more information about INT’s other data visualization products, please visit int.flywheelstaging.com or contact us at intinfo@int.com.


Filed Under: IVAAP, Uncategorized Tagged With: 3D, annotations, arcgis, CRS, ivaap, line chart, mapping, schematics, time series, welllog

  • Page 1
  • Page 2
  • Page 3
  • Go to Next Page »

Footer

Solutions

  • Real-Time Visualization
  • Visualization Components
  • New Energy Visualization
  • OSDU Visualization
  • Machine Learning
  • Developer Tools
  • Cloud Partners
  • Customer Success Stories

Products

  • IVAAP
  • GeoToolkit
  • INTViewer
  • IVAAP Demos
  • GeoToolkit Demos

About

  • News
  • Events
  • Careers
  • Management Team

Resources

  • Blog
  • FAQ

Support

  • JIRA
  • Developer Community

Contact

INT logo
© 1989–2024 Interactive Network Technologies, Inc.
Privacy Policy
  • Careers
  • Contact Us
  • Search

COPYRIGHT © 2025 INTERACTIVE NETWORK TECHNOLOGIES, Inc