• Skip to main content
  • Skip to footer

INT

Empowering Visualization

COMMUNITY BLOG
CONTACT US SUPPORT
MENUMENU
  • Solutions
    • Overview
    • Real-Time Visualization
    • Visualization Components
    • New Energy Visualization
    • OSDU Visualization
    • Machine Learning
    • Developer Tools
    • Cloud Partners
  • Products
    • IVAAP™
          • SOLUTIONS

            Real-Time Visualization

            OSDU Visualization

            Visualization Components

            New Energy Visualization

            Upstream Data Visualization

          • SUCCESS STORIES

            WEATHERFORD
            Well delivery optimization software

            BARDASZ
            Data management, data quality monitoring

            ANPG / SATEC-MIAPIA
            Virtual data room

            MAILLANCE
            High-performance visualization of ML algorithms

            SEE ALL >

          • SUPPORT

            DEVELOPER COMMUNITY
            Join or log in to the INT Developer Community.

            GET SUPPORT
            Log a ticket for an issue or bug.

            CONTACT US

          • DEMOS

            IVAAP DEMOS
            Cloud-Based Demos

            FIRST TIME HERE?
            Register to access our
            IVAAP demos

    • GeoToolkit™
          • SUCCESS STORIES

            CAYROS
            Field development planning

            TOTALENERGIES
            High-performance large dataset reservoir rendering

            IFP ENERGIES NOUVELLES
            Seismic and structural interpretation validation

            SEE ALL >

          • SUPPORT

            DEVELOPER COMMUNITY
            Join or log in to the INT Developer Community.

            GET SUPPORT
            Log a ticket for an issue or bug.

            CONTACT US

          • DEMOS

            GEOTOOLKIT DEMOS
            Geoscience Demos

    • INTViewer™
          • SUCCESS STORIES

            STRYDE
            Fast seismic QA/QC in the field

            SILVERTHORNE SEISMIC
            Efficient 2D/3D seismic data delivery

            WIRELESS SEISMIC
            Drones, IoT, and Advanced Onsite Seismic Data Validation

            SEE ALL >

          • SUPPORT

            GET SUPPORT
            Log a ticket for an issue or bug.

            CONTACT US

          • PLUG-INS

            EXTEND INTVIEWER
            More than 65 plugins available

  • Demos
    • GeoToolkit Demos
    • IVAAP Demos
  • Success Stories
  • Resources
    • Blog
    • Developer Community
    • FAQ
    • INT Resources Library
  • About
    • Overview
    • News
    • Events
    • Careers
    • Meet Our Team
    • About INT

Uncategorized

May 21 2020

INT Releases Latest IVAAP Version Supporting OSDU Release 2

IVAAP on OSDU R2 supports seismic visualization, data aggregation with unparalleled performance in the cloud to serve large seismic volumes using IVAAP’s HTML5 technology combined with OpenVDS format.

HOUSTON, TX — May 21, 2020—Interactive Network Technologies, Inc. (INT), a leader in advanced HTML5 domain visualization in oil and gas, is pleased to announce their contribution to the new release of The Open Group’s Open Subsurface Data Universe™ (OSDU) Data Platform Release 2.

The OSDU R2 release integrates INT’s robust seismic visualization capabilities and Bluware’s open source Volume Data Store (OpenVDS). Additionally, INT contributed a Java-native interface wrapper to support the adoption of OSDU across the industry. OpenVDS and IVAAP™ work together to support fast rendering of large seismic dataset in the cloud in 2D and 3D views. 

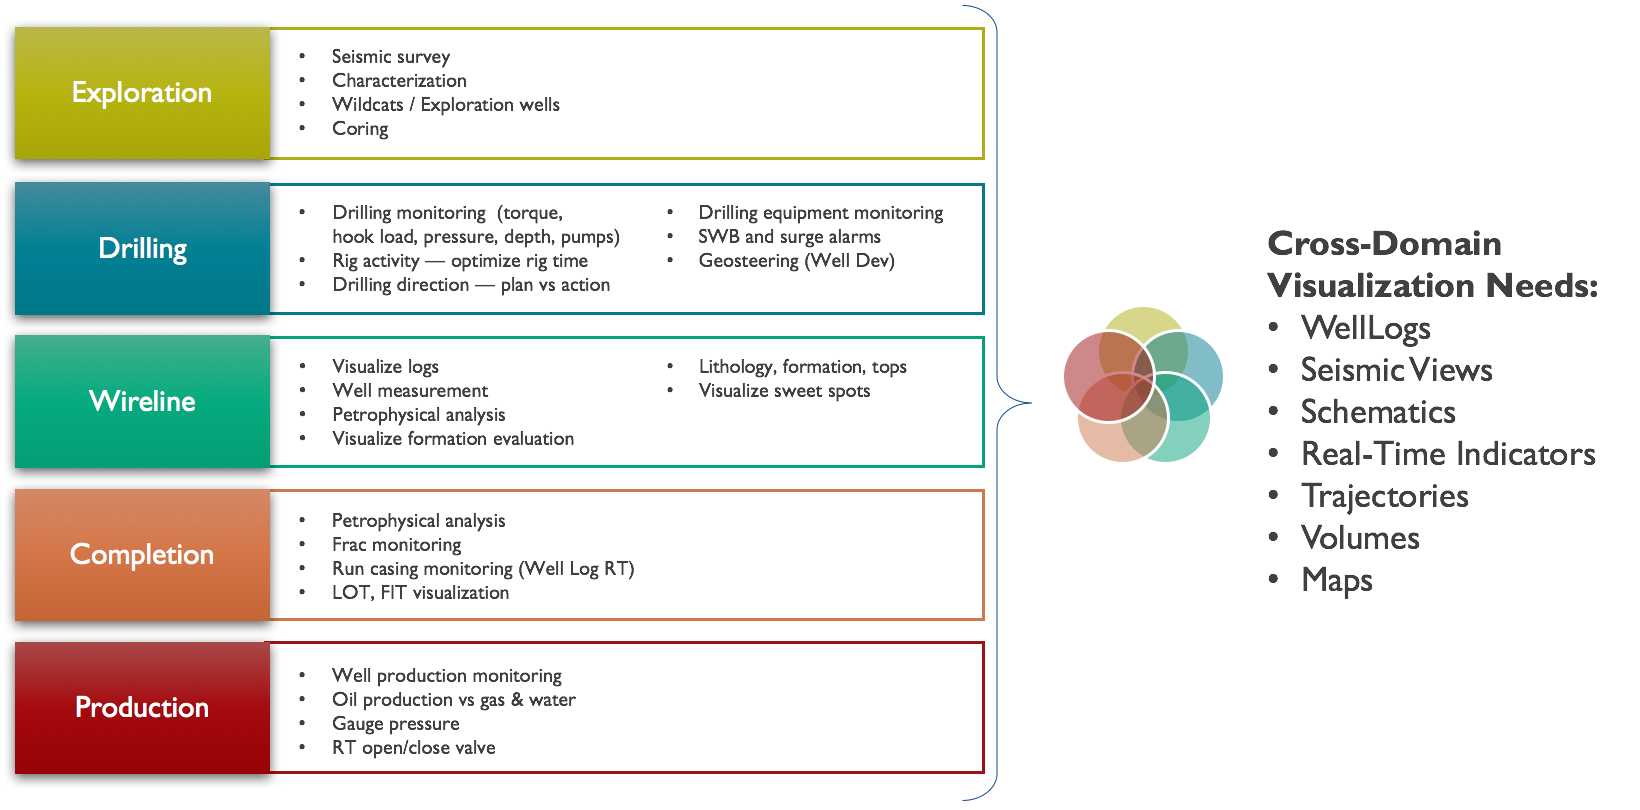
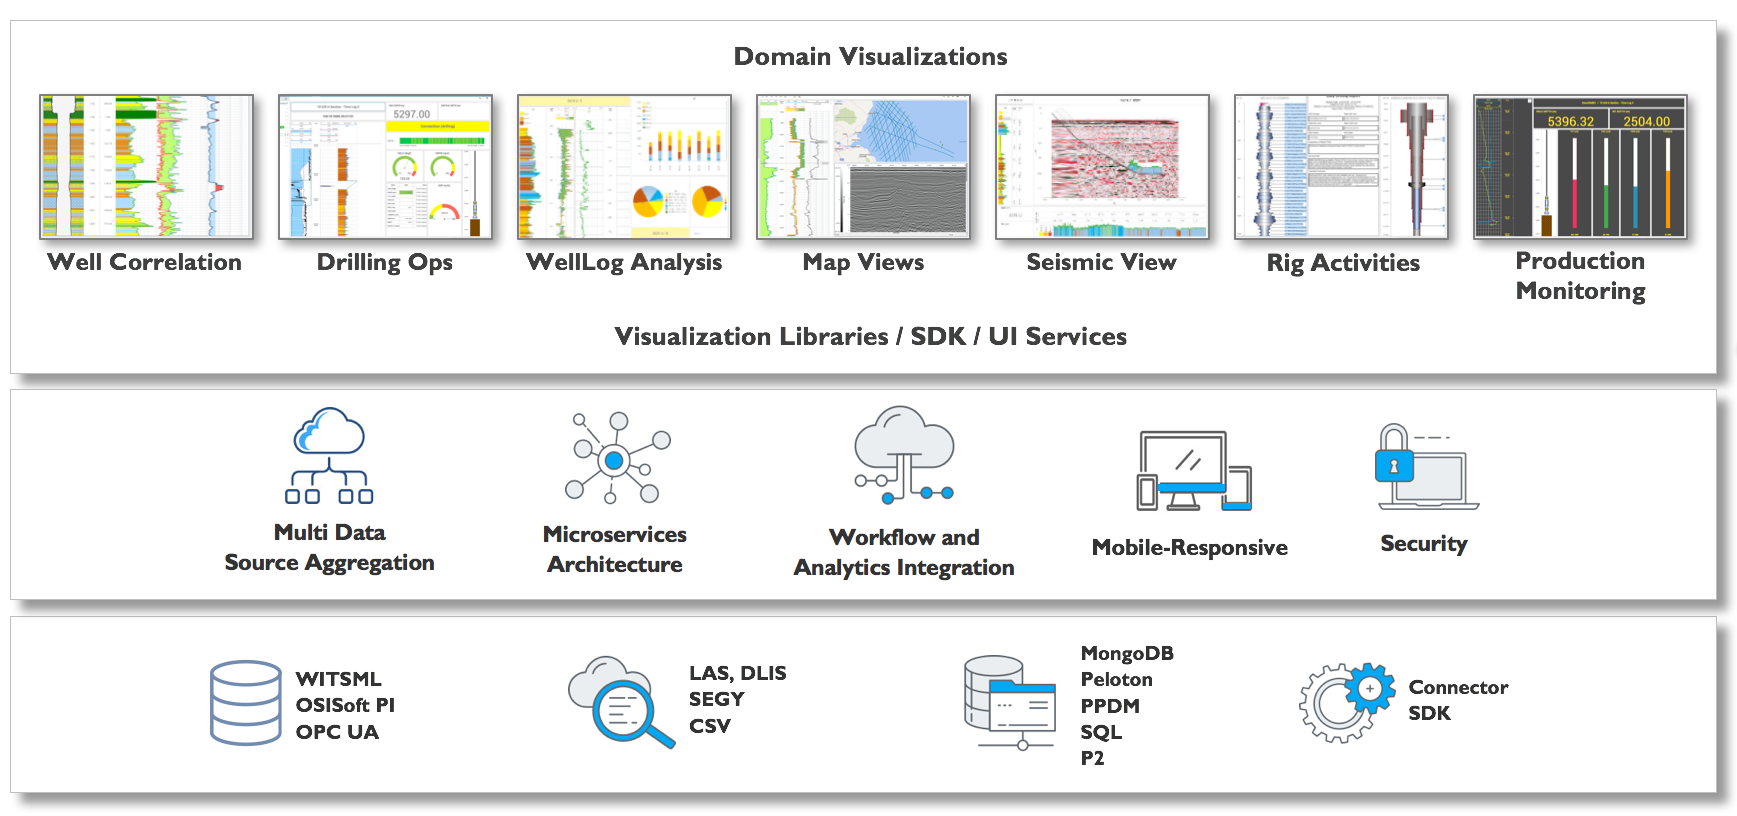
INT’s enterprise upstream visualization platform, IVAAP, enables full data aggregation and visualization of domain data across multiple cloud platforms and data storage. Using a microservices architecture, IVAAP supports most industry data standards, including OSDU, PPDM, WITSML, and several commercial databases, and enables user co-visualization. IVAAP’s unique dashboard capabilities combine data types—real-time, historical, 2D/3D seismic, reservoir, and more—to provide a unified view of exploration, drilling, and production operations in a web browser. 

INT collaborates closely with the OpenSDU team to help validate the platform and create a powerful framework that developers can embed to deliver cloud-based digital solutions much faster than ever. Using the powerful OSDU search and delivery API, IVAAP allows users to search, find, display, and analyze data on the fly, including log, trajectories, tops, seismic, horizon and fault data. 

Creating a common environment hosted in the cloud enables oil and gas companies to efficiently access massive amounts of data, reduce data silos, collaborate remotely, implement machine learning (ML), and lower the cost of operations.

“Working closely with The Open Group, IVAAP made it possible for users to visualize seismic data. We are very proud of the work the team—including our partner Bluware—has done to ensure IVAAP offers the best possible user experience and the fastest data visualization and aggregation. Interacting with a 100G+ 3D seismic volume in a web browser with great performance is now possible,” says Dr. Olivier Lhemann, founder and President of INT. 

Read the press release on PRWeb >

For more information on INT’s newest platform, IVAAP, please visit int.flywheelstaging.com/products/ivaap/

Open Subsurface Data Universe™ and OSDU™ are trademarks of The Open Group.

Filed Under: Uncategorized Tagged With: Bluware, ivaap, openVDS, OSDU

Aug 09 2019

In Retrospect: 10 Years at INT

This month of July marks a significant personal milestone since I have worked at INT for 10 years. 10 years is a long time, especially in technology where paradigm changes occur approximately every three years. Yes, the word “paradigm” was actually in vogue the year I started at INT—that’s how long it’s been. For this anniversary, I’d like to take you on a chronological tour of my experience.

The Formative Years

The first two years at INT were spent learning the many aspects of the application and the science I was working on: INTViewer and subsurface data. I liked joining a new team and getting acclimated to a new code base. I learned a lot from INTViewer’s architect. For example, he helped me understand the significance of making aspects pluggable. Not only does it serve INTViewer as a platform, but it allows the code to evolve without getting out of control. Following this principle, INTViewer’s code base has been able to grow several folds. And we’ll see that the plugins approach served me well in other projects over the course of 10 years.

Growing with INTViewer and INTGeoServer

After the first two years on the job, I picked up more responsibilities. Becoming the “ultimate resort for INTViewer questions” affected me in a way I didn’t anticipate. When I first started, whenever someone asked me a question I could not answer, my internal dialogue went something like, “I don’t know that part of the system. Who is the best person to ask for help on this?” After two years, this changed to: “I have been in this situation before. I know I will find the answer.” This somewhat irrational belief that I can answer any question thrown my way has helped me quite a bit when it comes to solving problems and helping others. When a coworker has a tough technical question, I didn’t anticipate I would one day answer, “Let’s find out!” with such confidence.

The needs of INT’s customers have changed over 10 years. One particular concern that has been pervasive across that time period is the ubiquity of data. Before “cloud” became the new word in vogue, customers often came to me with this problem: “I have teams all across the world, but I don’t want to maintain a worldwide file system. Visualization needs to be fast for all, without having to duplicate data. What do I do?” It’s out of these conversations that INTGeoServer, another pluggable platform, came to be.

INTViewer had years of experience built in to how to access data files efficiently, but, as a product, it needed to move beyond the file system. This was a complex technical challenge and an opportunity to widen the team’s technical skills.

INT gave me other opportunities to innovate: the integration of Python with INTViewer is quite unique in the market. Looking back, even though the technical solutions to reach “data ubiquity” have changed over the years, even though we introduced new ways to automate geoscience workflows, the fundamental work on geoscience data hasn’t evolved much. While software can be a scary place with its rate of change, I find that the geoscience learnings from my first two years are still relevant.

Building IVAAP and the Future of Ubiquitous Data

The latest evolution of ubiquitous data is cloud-based. The last three years have been a sort of new beginning for me since I’ve been tasked with leading the data side of IVAAP. Most of the IVAAP backend was essentially written from scratch, which is very satisfying as a developer. What is even more satisfying was working with the development team and seeing it grow. Since the backend was written by this team, there is no longer an “ultimate resort for questions” role. With the recent work with the OSDU consortium, I am happy and proud that the architectural decisions we made over the last three years have shown we are going in the right direction. This was recently validated by making IVAAP compatible with the OSDU platform. This work didn’t require any changes to IVAAP’s SDK—IVAAP’s OSDU implementation is actually just a plugin for this backend.

A Developer Culture

Working on INTViewer, INTGeoServer, and IVAAP for a grand total of 10 years, what has made me show up every morning has been the deep technical aspects of the job, the products I have been able to work on, and the people I interact with. INT has been a wonderful opportunity for me because of its technological leadership. If a developer says “I need X to achieve Y,” this gets immediate attention because the company culture is very developer-friendly. If you are a developer at heart like I am, being able to write code all day without interruptions is a significant perk of the job. Frankly speaking, these 10 years were also possible because developers at INT are seen as an investment, not a cost. Unlike other companies, INT has a strong will to weather tough economic cycles without shrinking its staff. I have grown with INT, and we both keep growing together (we are hiring, by the way). As a leader, I strive to help today’s new hires to have the same positive experience I had.

Filed Under: Uncategorized Tagged With: careers, developer, INT career, INTGeoServer, INTViewer, ivaap

Apr 15 2019

TotalEnergies to Use INT’s Data Visualization and Analysis Platform and Libraries Software for the Next Five Years

TotalEnergies and INT have recently announced a long-term corporate agreement that will give TotalEnergies access to INT’s GeoToolkit, the most widely adopted JavaScript-based data visualization technology software in Oil and Gas.

TotalEnergies will also be able to take advantage of IVAAP, one of the leading Data Visualization software platforms for digital subsurface projects deployed in the web or private cloud.

“With the growth of Big Data and IoT, the E&P industry needed a solution that would empower companies to combine and utilize vast amounts of incredibly useful, yet disparate domain data easily, in one powerful software,” said Dr. Olivier Lhemann, founder and CEO, Interactive Network Technologies.

“Fortunately, our unique expertise and position in the industry allowed us to recognize and respond to this need quickly, so we developed IVAAP. Now, we’re proud to partner with TotalEnergies to empower domain experts with the right digital tools they need to gain valuable, timely insights from their data.”

With this agreement, TotalEnergies Exploration & Production will gain access to GeoToolkit and IVAAP’s fully extensible platform, cloud-based architecture, and comprehensive set of data connectors to current systems such as WITSML, PPDM, OSIsoft, PI, and many others.

For more information on INT’s products and services, visit our products page or email us to discuss how we can help you visualize your upstream data.

View the press release

Learn more about INT’s products


Filed Under: GeoToolkit, Uncategorized Tagged With: geotoolkit, ivaap, TotalEnergies

Feb 27 2019

How to Empower Developers with à la Carte Deployment in IVAAP Upstream Data Visualization Platform

When you get started with IVAAP’s backend SDK, the first API that you will probably encounter is its “Lookup” system. A lookup system is a basic component of a pluggable architecture. Within such architecture, when a program needs to perform an action, it is not aware of the specifics of this action’s implementation, it just knows how to find this implementation and execute it. There are many benefits to separating service definition from implementation. A program might have one default implementation that is overridden by a plugin. Clients can customize an application’s behavior without having access to the code of this application. “Looking up” the concrete implementation of a service is an effective way to propose options without cluttering the code with “if” statements that you need to change each time a new option is offered. IVAAP was not just meant to be a web application “built for purpose”—we wanted it to be a platform that customers can extend on their own. With this goal is mind, the first component that we picked for IVAAP’s architecture was a “lookup” system.

The Java language has a standard way of performing such dependency injections. Java’s ServiceLoader class is central to this mechanism but it is a bit outdated and maintenance-heavy. To plug classes for a ServiceLoader, you need to edit a separate META-INF/services text file. This file contains the name of the class you want to plug. It doesn’t offer protections against typos and if a class name changes, the injection breaks unless you remember to update this service file. This design violates the concept that “what changes together should belong together.”

Unlike the ServiceLoader, IVAAP uses Java annotations to register classes into its lookup. These annotations belong in same class they register and they don’t break when that class name changes. For example, here is how the built-in entitlements controller is registered:

@SelfRegistration(lookupClass = AbstractEntitlementsController.class, position = 50)
public class DefaultEntitlementsController extends AbstractEntitlementsController {

The IVAAP SDK also has the option to perform this registration programmatically. This is the equivalent registration using code instead of annotations:

Lookup.Factory.getInstance().register(AbstractEntitlementsController.class, new DefaultEntitlementsController(), 50);

In many ways, this registration is very similar to what ServiceLoaders require. You can unregister classes, too. For example, here is how a customer would override how IVAAP controls entitlements:

@ClassUnregistration(lookupClass = AbstractEntitlementsController.class, registeredClass = DefaultEntitlementsController.class)
@SelfRegistration(lookupClass = AbstractEntitlementsController.class, position = 100)
public class MyEntitlementsController extends AbstractEntitlementsController {

This is the equivalent registration using code instead of annotations:

Lookup.Factory.getInstance().unregisterClass(AbstractEntitlementsController.class, DefaultEntitlementsController.class);
Lookup.Factory.getInstance().register(AbstractEntitlementsController.class, new MyEntitlementsController(), 100);

Each registration has a position. This is mostly useful when several classes of the same type need to be registered in the lookup. By setting the position attribute, you can customize which class will be found first when the content of the lookup is inspected. In other words, the position controls the order in which all “if” statements will be executed. It also has performance tuning use cases. For example, there are many service handler classes registered, each one representing a microservice. You can decide the order in which they will be matched to a URL, optimizing for the most frequently used ones.

When annotations became part of the Java ecosystem, they were widely adopted as an alternative to XML configuration files. This approach has sometimes been overused, resulting in multiple types of annotations, carrying numerous attributes, becoming just as indecipherable as the XML configuration files they were attempting to replace. The IVAAP backend avoids this pitfall by using the same annotation across all option types, which means is only one set of annotations to learn for a programmer extending the platform.

Another nice feature of IVAAP’s lookup system occurs at startup. When the classpath is inspected for lookup annotations, the classes found are logged. There are 300 modules in IVAAP, and no two customers pick the same options. When troubleshooting is needed, these logs make an unambiguous way to learn which options are actually in play for a specific deployment.

Inspecting jar files for lookup registrations at startup takes time. For performance reasons, you might elect to ignore jars that are known to be registration-free. You typically exclude external libraries by adding lookup.ignore configuration files along with your jars. These files use regex expressions to exclude jars by name. You also have the option to set environment variables to achieve the same result. The later method is actually quite useful in the context of Docker deployments. This gives devops the option to create one Docker instance with all jars of the platform and customize how this instance behaves just by setting environment variables—you can reuse the same Docker image in multiple deployment contexts.

The Java ecosystem has many dependency injection libraries available. They tend to require configuration and many keystrokes, essentially interrupting the developer while coding is underway. IVAAP’s backend doesn’t just propose an easy way to customize how it behaves, it also proposes an unobtrusive way to create pluggable behaviors while developers are working. Actually, the simplicity of the lookup system is the reason why so many aspects of IVAAP are pluggable. When this system is introduced to new developers, they enjoy that it’s easy to learn, yet versatile. Devops appreciate that they can leverage it when a fast turnaround is needed.

Visit our products page for more information about IVAAP or contact us for a demo.

Filed Under: Uncategorized Tagged With: ivaap, lookup, pluggable

Apr 19 2018

Enterprise Data Visualization: A Critical Component of Your E&P Digital Platform

The Forces Driving Transformation

Traditionally, the oil and gas sector has been slower than other industries to adopt new software and technology. When the market is doing well, companies have little time or motivation to invest in change. When the market is bad, companies lack the appropriate resources and budget.

Since 2015, the oil and gas sector has experienced significant changes. An aging workforce, low oil market price, and the pressure to transition to cleaner energy are among the many factors forcing the Exploration and Production industry to rethink how it works, recruits, trains, and operates in order to stay in business.

As a result of the many factors at play in today’s market, the pressure to increase or restore profitability and expand operations is unavoidable. Many companies are choosing to proactively adopt and integrate new technology to help them respond to this pressure to evolve.

Digital Platform Building Blocks

The term “digital transformation” is widely used to describe the integration of technology into all areas of a business, effectively digitizing operations to provide better access to data and decision-leveraging systems in the cloud.

As part of the digital transformation process, data science and machine learning can be smart ways for companies to focus more on analysis and to automate operations that can be expensive and tedious to perform manually.

Whether built internally or purchased from a software provider, many of the digital platforms used in the industry integrate each company’s proprietary science and workflows. While each platform may be unique, they do share a set of common functionalities, such as:

  • Cloud Data Lake
  • Data Mining
  • Machine Learning
  • Cluster Analysis
  • Databases
  • Streaming of Data Sources
  • Cloud Storage
  • Visualization

Unfortunately, the focus of selecting and/or developing a digital platform is often on the data science aspect, leaving user interaction and visualization as an afterthought, often overlooked until late in the development lifecycle.

Cross-Domain Visualizations

Looking at some of the key functions and workflows in E&P from a high level, it is clear that many of the use cases and workflows share common data views and data sources and would benefit from a platform that integrates them all.

Majors and IOCs should consider these shared use cases when designing or choosing the user experience of their digital platform as they require a visualization platform technology that is modular enough to tailor the user experience and workflows specific to each stage of the lifecycle (see Fig.1).

Cross-domain visualization
Fig.1 – Key areas where cross-domain visualization technology is needed to consume data and make decisions.


How to Evaluate an Enterprise Cloud Viewer

A product owner, architect, or chief engineer/developer who wants to build or implement a digital solution must assemble and assess various pieces of the puzzle: machine learning engine, database, cloud infrastructure, data search, search, workflows, etc.

In order to avoid reinventing the wheel, many companies choose a cloud-friendly enterprise viewer platform that can be used out of the box. However, there are many factors to consider when evaluating an enterprise cloud viewer.

The Number One Cause of Cloud Solution Failure: Lack of User Adoption

To avoid adoption failure, an Enterprise Cloud Viewer must offer a consistent and unified user experience across workflows through a single interface that can be adapted as needed, depending on the workflow and the user profile. Ideally, a solution built using a user-centered design approach will provide contextual experience for both remote and on-site experience.

Cloud Viewer Technology Adoption: Other Considerations

This list of points to consider when adopting a new cloud viewer platform is not intended to be exhaustive, but it is a great start for an evaluation or as a requirement list for an RFP for an E&P Cloud Visualization Framework:

E&P enterprise web viewer
Considerations for choosing an E&P enterprise cloud viewer.


1. Advanced Data Visualization

The visualization framework should offer specific domain views: WellLog, Schematics, BHA (animated or not), Seismic, and 4D/3D/2D in web-based local and/or remote visualization service. It should also have the ability to display very large datasets with high performance, seamlessly leveraging compression/decompression and decimation algorithms.

  • G&G/Seismic — Support standard file formats in E&P, such as SEG-D, SEG-Y, DLIS, and LAS in 2D/3D and custom formats used in specific workflows.
    • Visualize Faults: Simple geometry, complex geometry, fault surface interpolation
    • Visualize GeoModel: 3D layer representation with horizon, faults
    • 3D volumetric rendering
  • Drilling / Drilling Monitoring — Display well log and deviated well log data to perform geosteering (GST). Display surface sensor data (torque, hook load, pressure, depth, pump strokes), set custom alarms—swab & surge, vibration, ROP, WOB, RPM
    • Display well data with seismic (overlay)
    • Well log visualization (plot multiple curves, view markers, line displayed, colored display)
    • Offset wells display for correlation with the active well.
    • Display of drilling analytics to optimize rig activity (OPEX)
    • Directional drilling — plan vs. actual (3D trajectory in RT, BHA Schematics )
    • Composite log
    • NPT visualization
    • Geomechanics (rose diagram)
    • WellLog – providing display of curves and sensor data.
    • Multi-well view supported in the same browser session
  • Logging (wireline & while drilling) — Visualize petrophysical data
  • Completion — Display logs. visualize fracking data, run casing monitoring, view well schematics (plan vs. actual)
    • Time and depth (MD/TVD) based data, ability to switch indexes, image log support, passes/run, etc., from surface to sensor depth
  • Production — Monitor multiple individual well performance and well parameters, provide alarm messages for abnormal conditions, real-time reading, trending capabilities, KPIs reporting capabilities

2. Intuitive Visual Exploration

To ensure user adoption, the user interface must be intuitive. It should enable the exploration of data via the manipulation of chart images, with the color, brightness, size, shape, and motion of visual objects representing aspects of the dataset being analyzed. The tool should enable users to analyze the data by interacting directly with a visual representation of it.

  • Versatile User Interface/User Experience (UI/UX) with user-configurable preferences and collaborative functions. An intuitive UI/UX requiring minimal training of internal/external customers.
  • HTML5/JavaScript to support mobile-responsive needs, including non-graphical data that can be displayed on smaller devices.
  • Support touch screen (for mobile, tablet, touch screen monitors, etc.)
  • Map views for navigation and selection of data

3. Embedded Analytics

Users should be able to easily access advanced analytics capabilities contained within the platform or through the import and integration of externally developed models.

4. Interactive Dashboards

The tool should allow users to create highly interactive dashboards and content with visual exploration and be able to conduct search-based discovery.

  • Reusable Visualization and Dashboard Templates
  • Content Authoring
  • Animation and Playback
  • Formatting and Layout

5. Publish, Share, and Collaborate Capabilities

Users need to be able to publish, deploy, and operationalize visualizations. To collaborate more efficiently, users need the ability to share, discuss, and track information, analysis, analytic content, and decisions (embedded dashboard link, PDF printing, chat, and annotations).

6. Scalable Architecture

Modular architecture using microservices should integrate seamlessly with customer or third-party data science or workflow.

  • Resilient and fault-tolerant
  • Wherever possible, the system should be constructed from distributed redundant components transparent to end users.
  • Readily supports all global and standalone deployment scenarios (in-country / in-customer / in-cloud deployments)
  • Modularization of the system that should be composed of multiple services with transparent or industry-standard interfaces or services such as WITSML.
  • Developers should be able to develop their own components that simply plug into the existing viewer infrastructure. The messaging system should be open.
  • There should be an API to subscribe and publish to messages inside the service infrastructure.
  • SDK (client, framework)
    • The SDK should be able to provide developers with the ability to simply develop and build new display widgets or extend existing ones.

7. Platform Capabilities

The capabilities are offered in a single, seamless product or across multiple products.

  • Playback for all records of the well (variable speed, pause, and rewind)
  • Multiple language and character sets support
  • Data versioning for analysis and retrieval
  • Data storage/history
  • Global mnemonics, unit types, unit set, unit conversion
  • Acquisition real-time status indication
  • Client connection status indication
  • Coordinate reference transformation capability
  • Alerts and alarms (critical/notifications) with rapid (near real-time) delivery via email/SMS or out-of-band support
  • Data latency — the data should be delivered in near-real-time from the source of where the data is acquired by the system to the end-user display.
  • Programming Interfaces / API Integration (WITSML, PRODML, and WITS Applications)
  • Unit-of-Measure Conversion
  • Data Source Connectivity – Aggregation of structured and unstructured data contained within various types of storage platforms, both on-premises and in the cloud:
    • WITSML, ProdML, ResqML, WITS, PPDM, OPC UA, OSIsoft PI, SQL DB, NoSQL DB…
  • Data Export in CSV, LAS, ASCII
  • Analytics (KPI) reporting via custom dashboards or built-in widgets
  • Math engine / expression-based math solver — input formula and calculation — for instance, calculate pore pressure, MSE (Mechanical Specific Energy)
  • Data writes back to database
  • Annotations
  • Ability to switch/toggle between screens

8. Infrastructure, Administration, Security

Capabilities that enable platform security, administering users, auditing platform access and utilization, optimizing performance and ensuring high availability and disaster recovery.

  • The service incorporates a comprehensive entitlements system allowing user access to be managed down to the individual curve level
  • User access, usage and operating metrics are monitored and recorded for support, security, performance, and activity auditing and reporting
  • Role-based security be based on user groups and roles
  • Single Sign-on (Authentication and Authorization)
  • User administration
  • Full audit functionality, usage monitoring
  • Vulnerability
  • Encryption
  • High availability and disaster recovery
  • Scalability and performance

While these may not be all of the features to consider, these should provide a solid foundation for any company that wants to evaluate an enterprise cloud viewer for the E&P industry.

For more information about our enterprise data visualization solutions, visit the IVAAP product page, or contact us.


Filed Under: Uncategorized

  • « Go to Previous Page
  • Page 1
  • Page 2
  • Page 3
  • Go to Next Page »

Footer

Solutions

  • Real-Time Visualization
  • Visualization Components
  • New Energy Visualization
  • OSDU Visualization
  • Machine Learning
  • Developer Tools
  • Cloud Partners
  • Customer Success Stories

Products

  • IVAAP
  • GeoToolkit
  • INTViewer
  • IVAAP Demos
  • GeoToolkit Demos

About

  • News
  • Events
  • Careers
  • Management Team

Resources

  • Blog
  • FAQ

Support

  • JIRA
  • Developer Community

Contact

INT logo
© 1989–2024 Interactive Network Technologies, Inc.
Privacy Policy
  • Careers
  • Contact Us
  • Search

COPYRIGHT © 2025 INTERACTIVE NETWORK TECHNOLOGIES, Inc