• Skip to main content
  • Skip to primary sidebar
  • Skip to footer

INT

Empowering Visualization

  • Blog

INTViewer

How to Create Interactive Slideshows (VIDEO)

By Thelma Gros | August 22, 2017

Presenting data to clients regularly poses many challenges, especially considering that today’s datasets are likely to exceed a petabyte or more. Presentations made with tools like PowerPoint may take hours to create, are instantly obsolete, and frequently don’t fully answer your clients’ questions.

With one simple plugin, INTViewer transforms the art of showing data to your clients by combining the simplicity of a slideshow with the power of live data.

Quick tip: Check out our INTViewer slideshow tutorial to get started!


Create, Share, and Standardize Presentations

The INTViewer slideshow plugin streamlines how your company presents data to potential customers.

Data managers can create slideshows in INTViewer and share them with their colleagues.

Large datasets can be transferred to laptops without any loss of definition using the lattice decimation plugin, making INTViewer slideshows portable.

This new presentation medium saves time and can help standardize how your sales team presents data, while leaving enough flexibility to answer customer questions.

Easy to Learn, Easy to Use

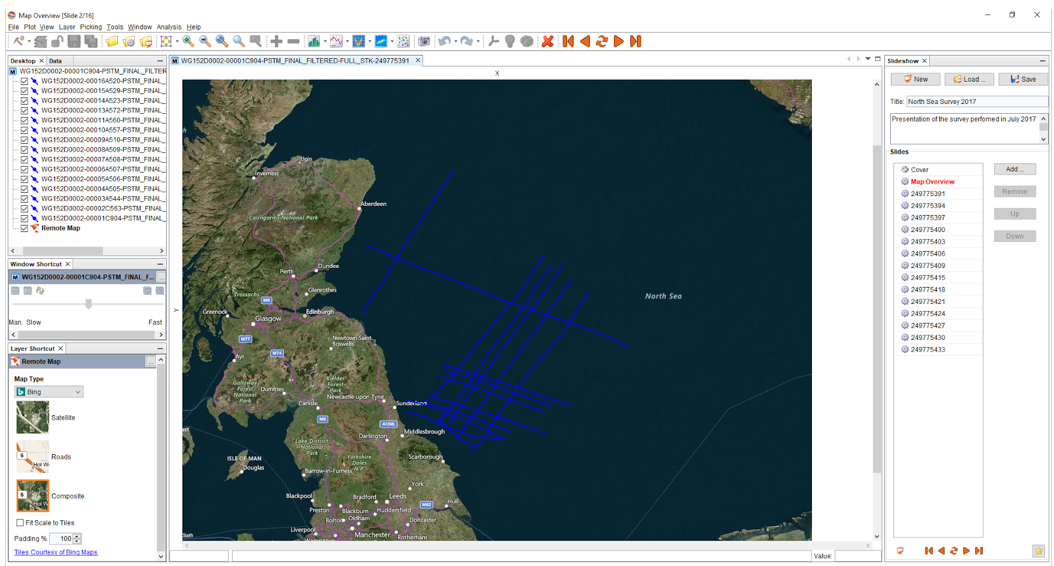
Presentations built using INTViewer work just like other presentation software—once you load the slideshow, press play to start, then press the Next button to go from one slide to another.

Create slideshows easily with INTViewer.

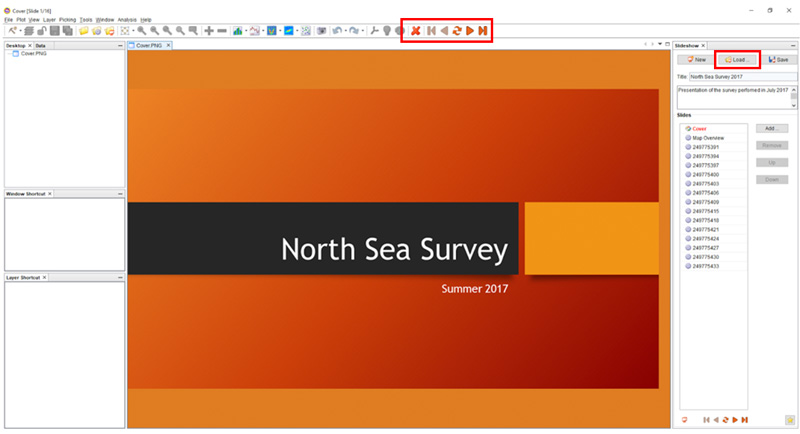
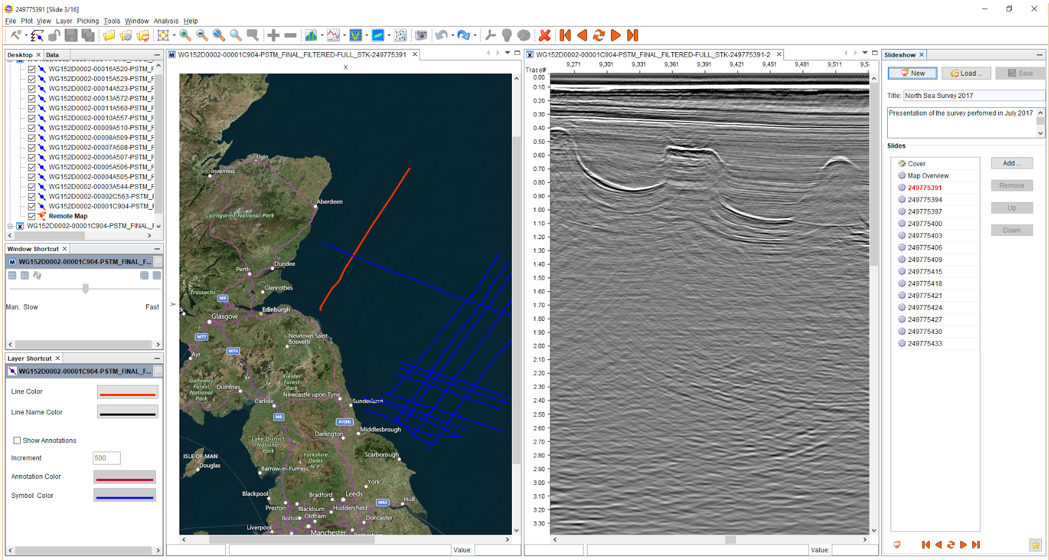
The slideshow window allows you to jump to a different slide without losing context.

2D-map-lines
This slide shows all of the lines at once.
verify-data-easily
The next slide shows the map and a cross-section of the highlighted 2D line.
Manipulating the data is incredibly easy. For example, to verify the definition of your data, you can zoom in just by holding the shift key and drawing a box around the section you want to view.

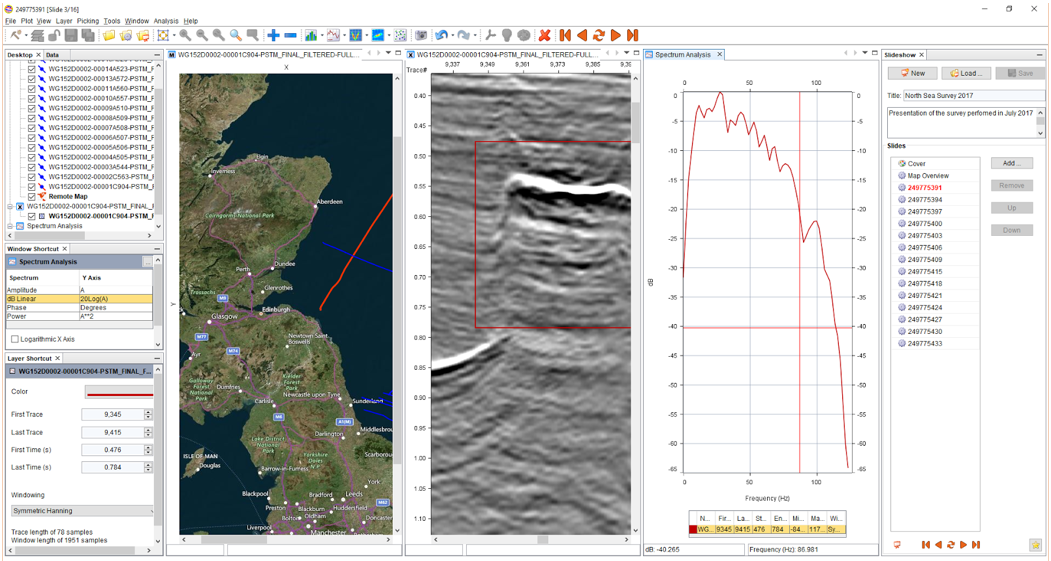
And to investigate a problematic area, you can view a spectrum analysis with just one click (S+draw a box).

seismic-analysis

Ready to make your presentations interactive?

For more information about INTViewer, check out our other blogs, visit the INTViewer product page, or contact us for a free trial.


Tags: data, INTViewer, presentation, slideshow

About Thelma Gros

As Director of Marketing at INT, I architect data-driven marketing strategies that propel our suite of data visualization software to the forefront of the industry. My expertise in brand development, demand generation, and digital marketing delivers measurable growth. A lifelong learner with a passion for technology, I thrive in dynamic environments. Outside of work, you'll find me exploring new trends or spending quality time with family.Follow her RSS feed here!

Primary Sidebar

SEARCH THE BLOG

Top Posts

  • Navigating the Deployment Challenges You May Run… February 22, 2024
  • Celebrating a Decade of Innovation: GeoToolkit.JS… April 18, 2024
  • Fundação Gorceix OSDU® Implementation: Experience,… January 18, 2024
  • INT Supports OpenZGY and OpenVDS to Enhance… April 11, 2024

Footer

Solutions

  • Real-Time Visualization
  • Visualization Components
  • New Energy Visualization
  • OSDU Visualization
  • Machine Learning
  • Developer Tools
  • Cloud Partners
  • Customer Success Stories

Products

  • IVAAP
  • GeoToolkit
  • INTViewer
  • IVAAP Demos
  • GeoToolkit Demos

About

  • News
  • Events
  • Careers
  • Management Team

Resources

  • Blog
  • FAQ

Support

  • JIRA
  • Developer Community

Contact

INT logo
© 1989–2024 Interactive Network Technologies, Inc.
Privacy Policy
  • Careers
  • Contact Us
  • Search

COPYRIGHT © 2025 INTERACTIVE NETWORK TECHNOLOGIES, Inc