• Skip to main content
  • Skip to primary sidebar
  • Skip to footer

INT

Empowering Visualization

  • Blog

INTViewer

How to Use INTViewer 2021’s New Mapping Capabilities

By Laurent Renard | March 9, 2021

INTViewer is a platform that allows geoscientists to view seismic data, check for errors, confirm geospatial integrity, perform light processing, and analyze their dataset. INTViewer is specifically designed to enable users to quickly access large datasets—prestack, stack, and 2D— from a laptop in the field to a desktop or remotely via the cloud.

The upcoming release of INTViewer 2021 has new map features including a RemoteMap plugin and support for the import and export of GeoTIFF files.

Users can populate map views with more GIS data(1). The possibility to aggregate several GIS data sources allows users to get a clear understanding of their field.
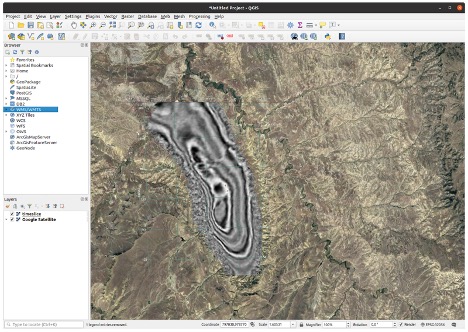
INTViewer Timeslice
Time slice exported from INTViewer and rendered on top of a satellite view in QGIS.


In the previous version of the RemoteMap plugin, users could use a Web Map Tile Service like Google or Bing to visualize in the background. In the 2021 update, we have added the possibility to set up a custom WMS server. Users can now register their preferred WMS servers in the settings panel and access them in any map view, making it easy to correlate geographic information with their data.
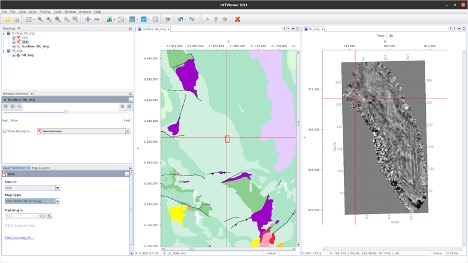
INTViewer Teapot Field
Teapot field, showing study bounds, lithology and faults from USGIN Geology


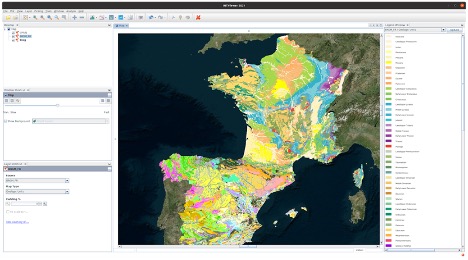
Using INTViewer, users can also produce georeferenced images by exporting maps to a GeoTIFF image to view in their favorite GIS software.

INTViewer map

With these new and improved features, users will be able to get a better understanding of their field, easily and efficiently correlate geographic data, and import and export GeoTIFF files.


For more information on INTViewer, please visit int.flywheelstaging.com/products/intviewer/


1 These features are available via the RemoteMap and GisRaster plugins, available on the update center.
Tags: geotiff, gis, INTViewer, mapping, plugins, remotemap

About Laurent Renard

Laurent Renard joined INT in 2007 as a Junior Java developer and specialized in 3D rendering using OpenGL technology. With a degree from an engineering school focused on life, food, and environmental sciences, Laurent spent his final internship studying horse biomechanics (he developed a Matlab program to analyse accelerometry data to quantify limps). He now coordinates R&D for INT (and still enjoys riding in his spare time).

Primary Sidebar

SEARCH THE BLOG

Top Posts

  • Navigating the Deployment Challenges You May Run… February 22, 2024
  • Celebrating a Decade of Innovation: GeoToolkit.JS… April 18, 2024
  • Fundação Gorceix OSDU® Implementation: Experience,… January 18, 2024
  • INT Supports OpenZGY and OpenVDS to Enhance… April 11, 2024

Footer

Solutions

  • Real-Time Visualization
  • Visualization Components
  • New Energy Visualization
  • OSDU Visualization
  • Machine Learning
  • Developer Tools
  • Cloud Partners
  • Customer Success Stories

Products

  • IVAAP
  • GeoToolkit
  • INTViewer
  • IVAAP Demos
  • GeoToolkit Demos

About

  • News
  • Events
  • Careers
  • Management Team

Resources

  • Blog
  • FAQ

Support

  • JIRA
  • Developer Community

Contact

INT logo
© 1989–2024 Interactive Network Technologies, Inc.
Privacy Policy
  • Careers
  • Contact Us
  • Search

COPYRIGHT © 2025 INTERACTIVE NETWORK TECHNOLOGIES, Inc