How Window Synchronization Facilitates Visualization of a Large Number of Datasets
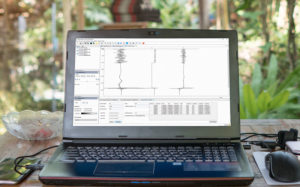
While some customers will use the portability of INTViewer to present their data, others will use INTViewer on a workstation, with multiple monitors. And instead of opening a handful of windows, they will open a few dozen. The typical use case for opening a large number of windows is when you want to monitor the multiple steps of a processing workflow. In such a use case where datasets are compared, it’s important that all visualizations share the same settings. INTViewer makes it really easy to open dozens of datasets at once. You can select a directory and open in one click all the datasets within that directory. But this is not where INTViewer’s productivity stops. Automatic synchronization facilitates the management of all these windows.
My Experience at INT with IVAAP: A First Look as a Developer
As a new member of the software development team, I had no prior experience with development on IVAAP, INT’s HTML5 visualization framework for upstream E&P solutions. My first task was to add a data connector, so to gain knowledge of IVAAP and to understand more about the IVAAP software development kit, I used the IVAAP developer’s guide. I found this guide quite useful as it made the key points behind IVAAP easily understandable. Coding with IVAAP is actually easy, and I was surprised by several features of the platform and SDK that make it quite simple to learn.
Using INTViewer to Visualize Earthquakes and Other Seismic Activity
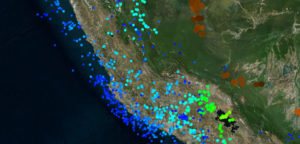
I often have a hard time explaining to friends and family what exactly INTViewer does. The moment I use the word “seismic,” the listener's mind automatically shifts to the topics of seismic activity and earthquakes, and I need to explain oil & gas exploration technologies before I even get to the software. By then, I have lost my audience. Today, I’ll try a different technique: I’ll describe the capabilities of INTViewer that actually cater to earthquake mapping. I will show how you can use the built-in capabilities of INTViewer to map recent earthquake activities.
5 Ways INTViewer Makes Offline Visualization Possible
I often say that INTViewer is a bit of Swiss knife. It serves multiple purposes, and each company finds a different use. This makes it hard to decide which feature to highlight. In the past few years, as the industry moved to the cloud, we created a companion for INTViewer: INTGeoServer, which makes it easy to visualize data beyond the bounds of your network. This year, with the new release of INTViewer approaching, I will highlight the opposite feature of INTViewer: its ability to work offline, disconnected from the world.


