How to Improve Performance and Reduce Latency of Your Geoscience Data
Storing and accessing large, sometimes sensitive geoscience data is one challenge many top E&P companies face. Local data storage is one option. But what about data that is not stored locally? How do you access it quickly, and can you still use INTViewer?
Bridging the Gap Between Business and IT: Visualization Architecture in the Digital Oilfield
In our latest Tech Talk, E&P Visualization in the Cloud, we featured IVAAP, our cloud-enabled visualization and analytics development platform. We showed how it can be used to monitor and analyze well data as a critical part of your digital transformation. Thierry Danard, our VP of Core Platform Technologies, presented some of the technical aspects of IVAAP, so we asked him a few questions after the talk to dig a bit deeper.
Live Completion Is Better than AutoCompletion
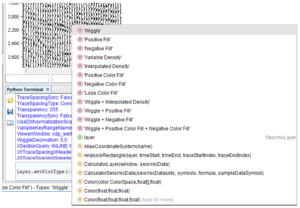
A major feature of INTViewer 5.2 is the Python integration. Our development team worked very hard to ensure that our customers can get started easily and be productive once they are hooked. One consistent user feedback was that the Python terminal lacked autocompletion. It could become tedious to have to type the full name of each class, each method or each variable. We took this feedback to heart and implemented autocompletion in INTViewer 5.2.
How to Create Interactive Slideshows (VIDEO)
Presenting data to clients regularly poses many challenges, especially considering that today's datasets are more likely to exceed a petabyte or more. Slideshows that may take hours to create are often instantly obsolete and frequently don't fully answer your clients' questions. With one simple plugin, INTViewer transforms the art of showing data to your clients by combining the simplicity of a slideshow and the power of live data.


