• Skip to main content
  • Skip to footer

INT

Empowering Visualization

COMMUNITY BLOG
CONTACT US SUPPORT
MENUMENU
  • Solutions
    • Overview
    • Real-Time Visualization
    • Visualization Components
    • New Energy Visualization
    • OSDU Visualization
    • Machine Learning
    • Developer Tools
    • Cloud Partners
  • Products
    • IVAAP™
          • SOLUTIONS

            Real-Time Visualization

            OSDU Visualization

            Visualization Components

            New Energy Visualization

            Upstream Data Visualization

          • SUCCESS STORIES

            WEATHERFORD
            Well delivery optimization software

            BARDASZ
            Data management, data quality monitoring

            ANPG / SATEC-MIAPIA
            Virtual data room

            MAILLANCE
            High-performance visualization of ML algorithms

            SEE ALL >

          • SUPPORT

            DEVELOPER COMMUNITY
            Join or log in to the INT Developer Community.

            GET SUPPORT
            Log a ticket for an issue or bug.

            CONTACT US

          • DEMOS

            IVAAP DEMOS
            Cloud-Based Demos

            FIRST TIME HERE?
            Register to access our
            IVAAP demos

    • GeoToolkit™
          • SUCCESS STORIES

            CAYROS
            Field development planning

            TOTALENERGIES
            High-performance large dataset reservoir rendering

            IFP ENERGIES NOUVELLES
            Seismic and structural interpretation validation

            SEE ALL >

          • SUPPORT

            DEVELOPER COMMUNITY
            Join or log in to the INT Developer Community.

            GET SUPPORT
            Log a ticket for an issue or bug.

            CONTACT US

          • DEMOS

            GEOTOOLKIT DEMOS
            Geoscience Demos

    • INTViewer™
          • SUCCESS STORIES

            STRYDE
            Fast seismic QA/QC in the field

            SILVERTHORNE SEISMIC
            Efficient 2D/3D seismic data delivery

            WIRELESS SEISMIC
            Drones, IoT, and Advanced Onsite Seismic Data Validation

            SEE ALL >

          • SUPPORT

            GET SUPPORT
            Log a ticket for an issue or bug.

            CONTACT US

          • PLUG-INS

            EXTEND INTVIEWER
            More than 65 plugins available

  • Demos
    • GeoToolkit Demos
    • IVAAP Demos
  • Success Stories
  • Resources
    • Blog
    • Developer Community
    • FAQ
    • INT Resources Library
  • About
    • Overview
    • News
    • Events
    • Careers
    • Meet Our Team
    • About INT

3D

Jan 07 2022

INT Advances IVAAP as Universal Subsurface Cloud Viewer with Full OSDU™ Data Platform Support

Empower energy users’ experience by embedding advanced subsurface data visualization with your data science in your digital solutions.

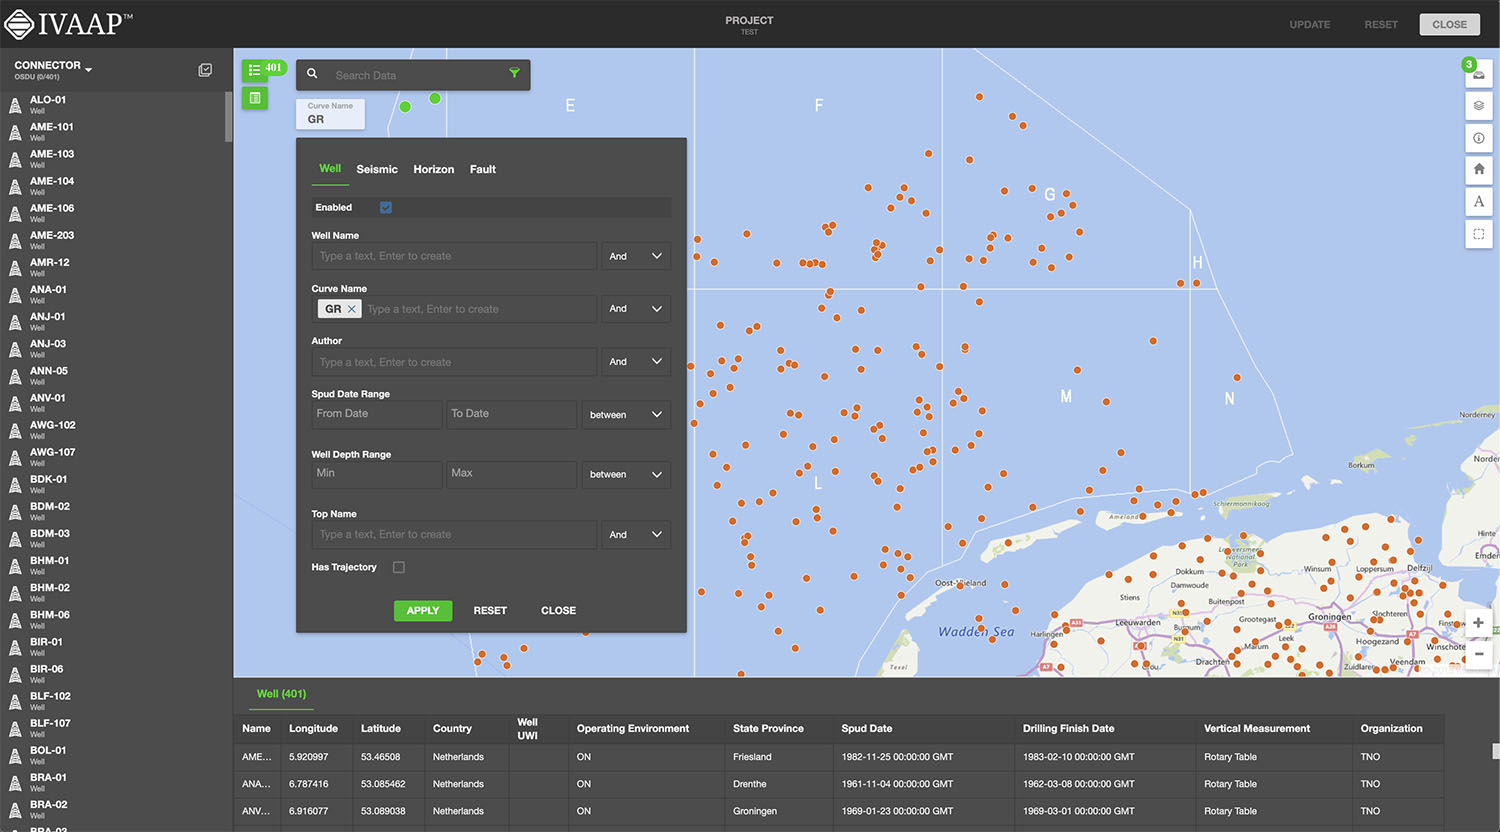
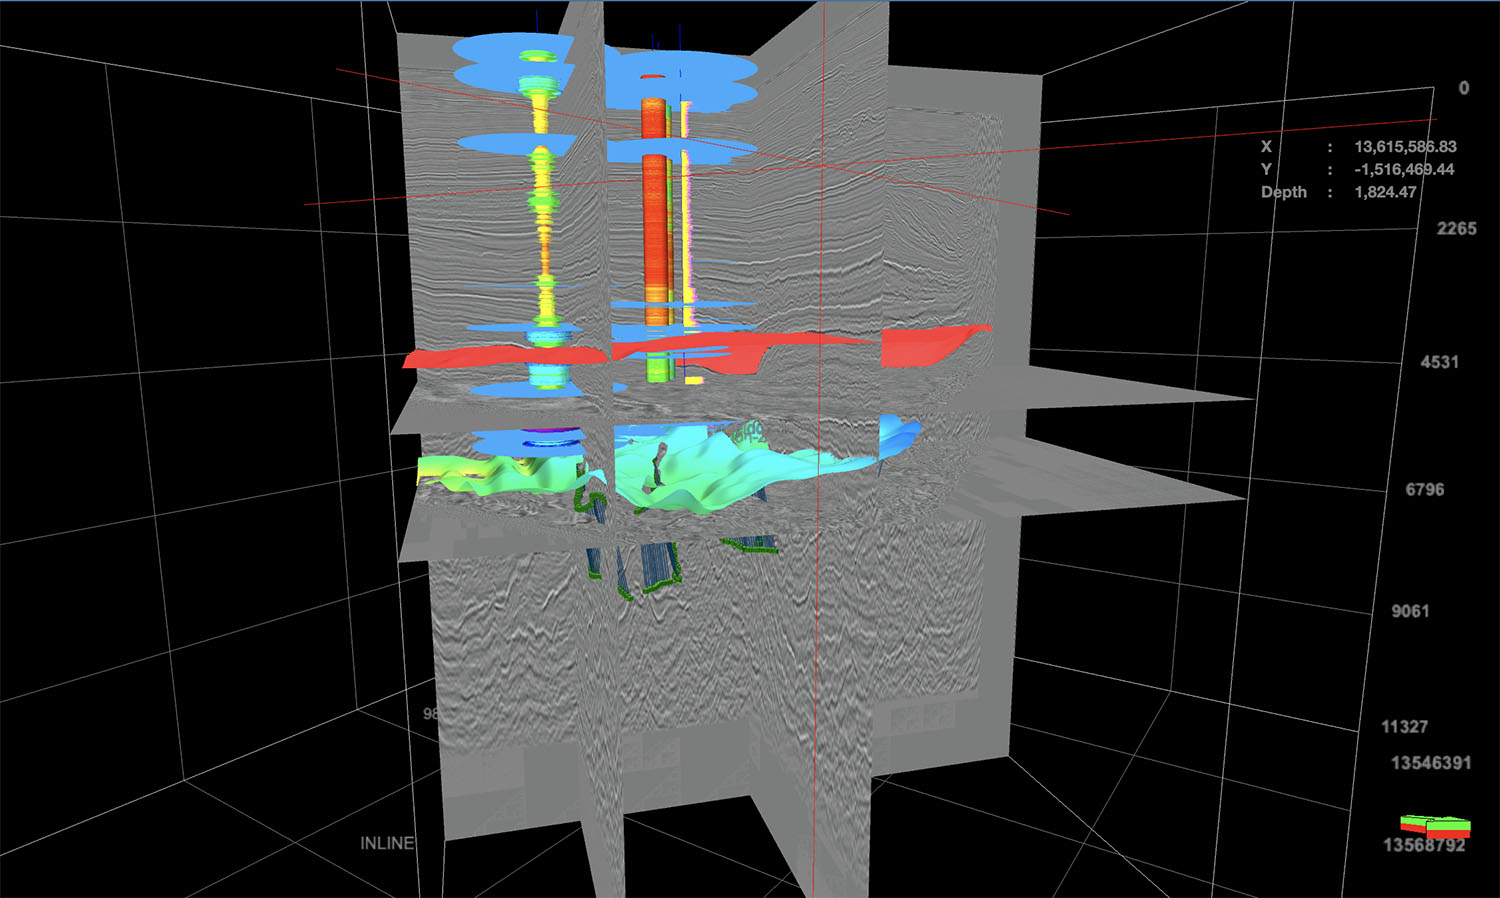
INT, a leading provider of data visualization software, just announced the newest version of their universal subsurface visualization and analytics application platform, IVAAP™. Offering full OSDU Data Platform support, IVAAP 2.9 enables exploration, visualization, and computation of energy data. The new release also expands IVAAP’s map-based search, data discovery, and data selection with 3D seismic volume intersection, 2D seismic overlays, reservoir, and basemap widgets to visualize all energy data types in the cloud.

As an OSDU-native application, IVAAP can accelerate the integration between the OSDU Data Platform and other EDM platforms. For example, INT recently partnered with Halliburton Landmark to demonstrate the power of interoperability between systems — linking IVAAP to Landmark EDM through the OSDU Data Platform on AWS. 

A major new feature of IVAAP is its integration capabilities with processing or machine learning services. This new capability was added in response to many energy companies who had many algorithms and models in various programs — Python, TensorFlow, Jupyter notebooks, to name a few — spread across the organization and were faced with the challenge to share them and make them accessible in other apps. With this new capability, IVAAP accelerates workflow integration and simplifies Machine Learning Operations (MLOps). 


“We’ve been working to fully integrate new features in IVAAP that can streamline user workflows, reducing time to decision and empowering users with data visualization to help them to collaborate, make strong, accurate business decisions, and otherwise improve their ability to work with subsurface data for energy,” said Olivier Lhemann, president of INT. “With this release, we bring that full circle — users can now access their data using the power of the OSDU Data Platform, perform machine learning and processing models, and visualize the results.”


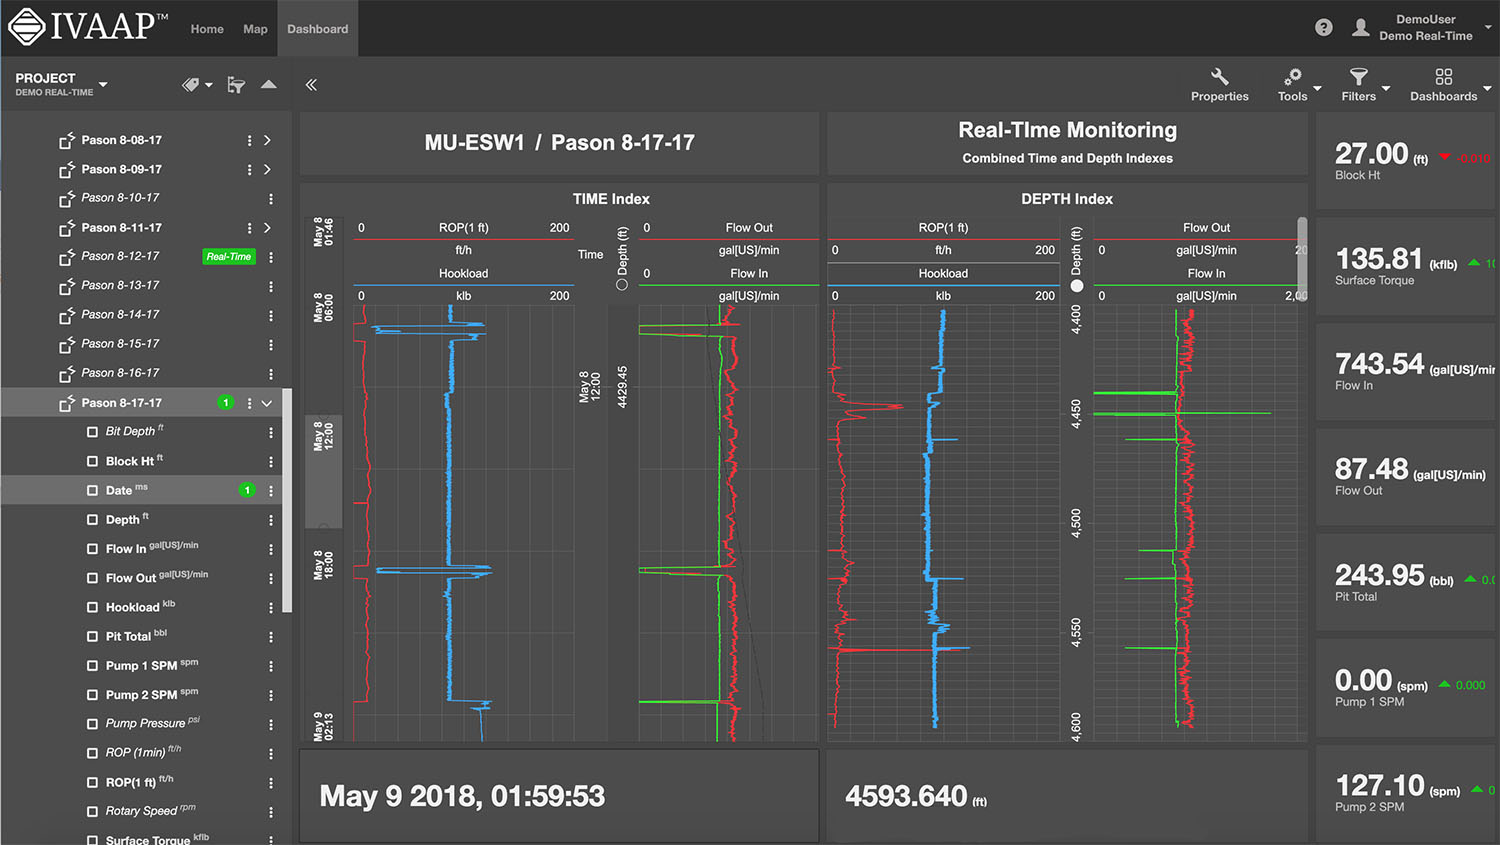
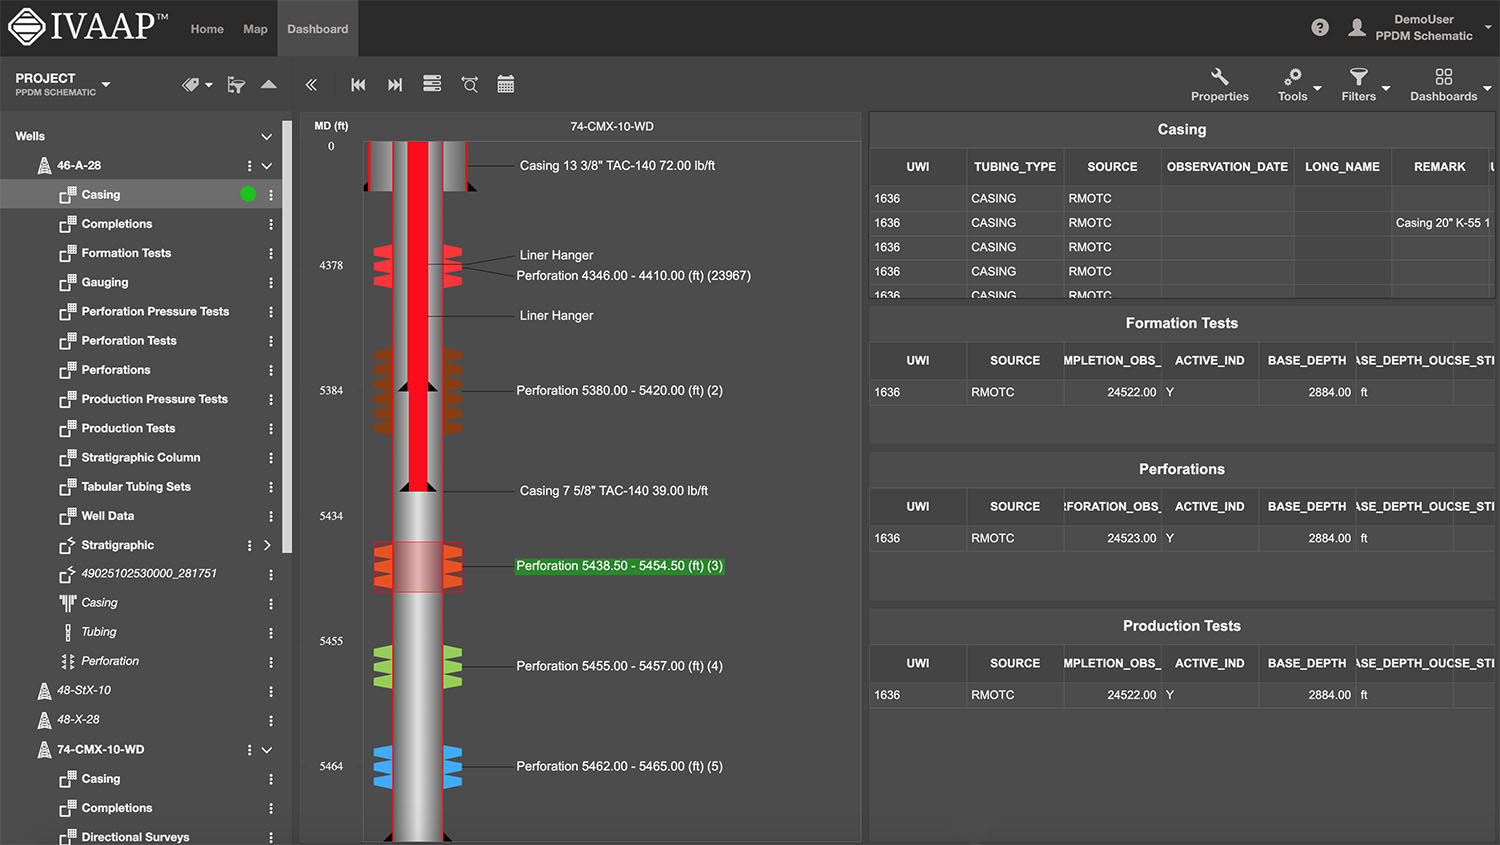
IVAAP’s workflow integration opens up a brand new user experience where now data scientists, modelers, geophysicists, and data managers can search data in the cloud, select data of interest, and launch computation from a single platform. IVAAP is providing new ways for operators, services, and energy technology software providers to enrich their digital solutions with powerful visualization and integration capabilities to OSDU Data Platform and machine learning for further automation. 

Learn more about IVAAP at int.com/ivaap.

For more information, please visit int.flywheelstaging.com or contact us at intinfo@int.com.


Filed Under: IVAAP Tagged With: 3D, basemap, ivaap, machine learning, ml, OSDU, seismic, workflows

Apr 08 2021

Extended Well Data: How to Use the New Well Data Structure in INTViewer 2021

LAS format is the industry-standard format to store and exchange well log curve data. Despite its simplicity and usability, it has some strong limitations: log curves must have the same Z sampling for instance.

The latest INTViewer 2021 introduces a new well data structure, the Extended Well Data (EWD). Like the existing well data based on LAS files, EWD can be displayed in the Well Log Window. They can be displayed in Map views, 3D, and seismic viewers as well (provided the trajectory is well defined). 

This new format allows more complex edition operation, heterogeneous log curves in the same well data, and a new time/depth conversion process. 

Synthesis Window

The EWD structure allows more flexibility in log and well edition. The EWD Synthesis window exhibits all logs and well metadata.

Extended Well Data Synthesis

On this window some actions are available:

  • Metadata edition
  • Add curves with formula
  • Remove curves
  • Open Well Log Window with selected curves

Curve data can be edited using the Log Curve editor.

log-curve

Z and values can be edited, samples can be added or removed, and data can be copied in an external spreadsheet, then pasted back in the editor after modification.

Contrary to standard LAS data, EWD allows log curves to have heterogeneous Z columns, and various samples count. Each log curve can then be edited individually without affecting other curves sampling.

To learn more about how to edit wells in INTViewer, check out our video tutorial:


Log Curve Formula

Like with standard LAS-based well data, curves can be added using a formula. Since log curves can have different Z units, users will be forbidden to mix time and depth curves using formulas.

Log Curve Formula

Since curves can be edited individually and have different sampling, the result curve, and all other curves used as input, will be resampled to the sampling of the first data found in the formula (in the image above GR_Time will be used).

Formula editor can be started from the main synthesis window, and also from the popup menu on the EWD node.

Time / Depth Conversion

By defining a curve as Time / Depth law (typically a curve that will have time or depth unit for data values, and opposite unit for Z values), EWD offers the ability to perform Time/Depth conversion. A simple editor to choose the data to convert and the law to use is opened when Time Depth conversion action is launched:

Time Depth Conversion


Time / Depth conversion can be performed on logs, but also on Markers. The EWD format can hold several Markers set, each having time or depth unit.

markers


Time/Depth conversion action can be found on the main EWD synthesis window, but it’s also available from the EWD contextual menu in Well Log Window.

The Time/Depth conversion process is a simple sample-by-sample linear interpolation using the Time/Depth law as reference. A more complex process, eventually with parameters, can be added with customization.

LAS Import/Export

EWD can be created from LAS files and exported to LAS files after edition. LAS data can then be imported as EWD in INTViewer 2021. Users can perform various editions, time/depth conversion, and other actions, then export the result in standard LAS to use the data outside INTViewer 2021. 

Export EWD to LAS

When exporting to LAS, the data domain must be specified (a LAS can only contain data sharing the same Z unit). Users can also choose which data to export. The following screenshot shows an EWD data and the exported LAS side by side. 

In the EWD view log curves and markers are in depth, the time depth law is displayed in green. Converted and exported data are in time.

INTViewer 2021 SS

Users have the choice with EWD to display or not in the same view time and depth data. 

Customization

The Extended Well Data GUIs can be customized to offer more specific behaviour to the standard EWD functionalities. So a specific plugin will be able to modify:

  • EWD Synthesis customization 
    • Specific header panel 
    • Custom table filters
    • Custom table control (available units, domain, validation)
  • Time/Depth conversion
    • Conversion process and parameters can be added

For more information on INTViewer, please visit int.flywheelstaging.com/products/intviewer/


Filed Under: INTViewer Tagged With: 3D, Extended Well Data, INTViewer, maps, seismic

Dec 02 2020

IVAAP Release 2.7: More Map Search and ArcGIS Features

IVAAP™ is a subsurface data visualization platform that provides developers and product owners powerful subsurface visualization features for their digital solutions in the cloud. IVAAP enables users to search, access, display, and analyze 2D/3D G&G and petrophysical data in a single user-friendly dashboard on the web. The latest release of IVAAP 2.7 comes with various new features and significant improvements.

Highlights from this release include many advanced search and map capabilities, improved 3D widget filter dialog, new interval curves support, new date/time picker for Cross-Plot widget axis settings, and more! 

Advanced Mapping Capabilities

IVAAP features support for visual-based data discovery using map-based search, and is fully integrated with ArcGIS (ESRI), allowing for the search of structured and unstructured data in a data lake or any other file repository. IVAAP supports a wide range of map formats and services like ArcGIS, GeoJSON, KML, Mapbox, Bing, WMS, and more.

With the ArcGIS integration, you can easily access all layers and details from your ArcGIS server and display them within IVAAP to enrich map-based search of well, seismic, and other subsurface data.

New features include the ability to display a dynamic metadata table for a selected object in the map (Well, Seismic, etc.). 

Most layers are supported. Image services (ArcGIS Image Service Layer, Image Services Vector Layers, and WMS) and Tile services (Image Service, ArcGIS Tiled Map Service Layer, Web Tiled Layer, OpenStreetMap) are supported. Feature Services include map service (ArcGIS Feature Layer), KML, WFS, and CSV. We also provide some real-time services support like stream services (ArcGIS Stream Layer), GeoRSS, Vector Tiles (VectorTileLayer), and Bing Maps services. Two extra formats that are supported are GeoJSON and GPX.

This release includes improved search capabilities allowing search across any metadata for any user. Access to data can be restricted to read-only mode. We also made improvements to fence highlighting and access to well lists, and labels can now be saved with the dashboard.


2_7_0_Map Reduced


More Themes Control 

Previously, theme control within IVAAP was a bit limited. We’ve expanded the theme mechanism to all widgets so that users can customize themes with more control and options and access new updated themes.


2_7_0_Customized Themes

Lightmode theme


New Image Widget 

IVAAP can now display simple image files such as jpeg or png files in the image widget, align, and zoom in to show detail. This feature allows users to customize dashboards with logos or other image files needed to display. 

Improvements in 3D

IVAAP’s 3D widget now supports tagging and aliases when displaying well data. We added reservoir data that can be serialized in the dashboard template. Users now have the ability to mix data with CRS and data without CRS. Another new feature is that users can apply properties to multiple or individual objects. And we’ve improved the dashboard restoration of multiple inlines, crossbones, and time slices. Finally, the 3D widget filter dialog has been redesigned.


2_7_0_3D Reduced


New Features in WellLog

For WellLog, we improved the set main index support for templates, dashboards, and well switching. With this improvement, a secondary index can be used to display data into a different index and secondary indexes can be restored when opening an existing dashboard or template. An improved automatic logarithmic mode gives users the ability to add a curve to a logarithmic track. New features added to WellLog include: the ability to automatically rotate labels for lithology and a reset action where users can right-click with the option to clear their display.


WellLog


New in Schematics

For the Schematics package, new features include: perforation with state definition support, the ability to customize by using a filter dialog, and the ability to use cursor tracking between Schematics and WellLog. We also improved the component selection support in the Schematics widget.


schematics 2.7


Time Series: Annotations and Perforations 

We improved the ability to select a data series from the legend. The Time Series widget now features support for annotations and perforations. The tooltip now shows the index data and time.


TimeSeries


New and Improved Line Chart

The IVAAP line chart now supports templates and data series dialog. We improved the ability to edit existing data series. Users can now flip the axis for date and time data, and the legend has been improved to show or hide the data series parent. There is also an improvement for single data sets, multi-data sets, and multi parent projects. 


LineChart


This release includes many more improvements to features and to the UI. For more information, check out the full release here.

Or check out int.com/ivaap for a preview of IVAAP or for more information about INT’s other data visualization products, please visit int.flywheelstaging.com or contact us at intinfo@int.com.


Filed Under: IVAAP, Uncategorized Tagged With: 3D, annotations, arcgis, CRS, ivaap, line chart, mapping, schematics, time series, welllog

Aug 18 2020

Weatherford, INT Expand Collaboration to Create 2D, 3D Real-Time Well Visualization

INT’s IVAAP framework provides next-level real-time well visualization in 2D and 3D for Weatherford’s Centro digital well delivery software.

HOUSTON, TX – August 18, 2020 – Weatherford International plc announced a strengthened collaboration with upstream data visualization provider INT to provide next-level, real-time well visualization in both 2D and 3D. Weatherford will embed INT’s IVAAP framework into the Weatherford Centro™ digital well delivery software, advancing its data visualization capabilities.


“Weatherford’s selection of the IVAAP framework for their Centro software is extremely exciting for INT,” said Dr. Olivier Lhemann, President of INT, Inc. “Centro is leading the industry-wide digital transformation as part of a new generation of applications built fully in HTML5. It is both highly collaborative and powerful, but still very user-friendly. INT has worked with Weatherford for many years and we are proud to be part of their innovative approach to integrating data and analytics within a single platform.”


Weatherford Centro digital well delivery software offers exceptional workflows that seamlessly integrate every element of an operator’s well data, allowing team members from any global location to access, share, and store all vital project information at any time. Combining Centro’s advanced data visualization capabilities with the IVAAP framework provides next-level real-time well visualization in 2D and 3D.


“Weatherford provides digital solutions that help our customers reduce costs and increase operational efficiency,” said Gustavo Urdaneta, Drilling Software Global Manager at Weatherford. “The proven E&P data visualization and open architecture design was a critical factor in selecting the IVAAP framework to enhance the value of user centric visualizations in our well delivery software.”


Weatherford has been at the forefront of software innovation, especially in drilling and production. Both companies have built a strong relationship by embedding advanced HTML5 domain visualizations libraries and modules from INT in several Weatherford software applications.

Read the full press release on PRWeb.

Visit int.com/ivaap/ to learn more or contact INT at intinfo@int.com.


About INT

INT is a software provider of Data Visualization solutions and platforms used in Upstream E&P and other technical industries. INT Software uses the latest technologies, such as HTML5 and JavaScript, to enable cloud-enabled and mobile-responsive solutions. For more than 25 years, INT visualization libraries, widgets, and frameworks have been used by the leading Oil & Gas and Service companies to empower best-in-class business applications for seismic, geoscience, well intelligence, drilling ops, utilities, manufacturing, and asset management.

About Weatherford

Weatherford is a leading wellbore and production solutions company. Operating in more than 80 countries, the Company answers the challenges of the energy industry with its global talent network of approximately 19,000 team members and 600 locations, which include service, research and development, training, and manufacturing facilities. Visit weatherford.com for more information or connect on LinkedIn, Facebook, Twitter, Instagram, or YouTube.

Filed Under: IVAAP, Press Release Tagged With: 2D, 3D, ivaap, weatherford

Jun 11 2020

Optimizing 3D Subsurface Web Applications with GeoToolkit

The WebGL technology that allows 3D rendering on browsers was released in 2009, and yet, 11 years later, 3D is hardly said to be common for web applications in E&P. Despite the advantages of 3D rendering and the trend of migrating applications to web browsers, there are various obstacles that developers have to face and overcome. The steep learning curve, the insufficient cross-platform support, and the difficulty of maintaining make WebGL a beast to work with. In a way, we want to keep the obstacles away from web developers, so INT provides Carnac3D, a subset of GeoToolkit, as an industry-leading graphical product.

Carnac3D is a comprehensive set of graphical tools for data visualization, and it empowers 3D rendering for IVAAP and many other industrial applications. The toolset utilizes WebGL to achieve GPU rendering in web browsers. Meanwhile, it mitigates the drawbacks of the technology and enriches the functionalities specialized for oil and gas.

Getting Started with 3D Rendering Should Not Be Frustrating

The concept of 3D rendering has a lot in common with photography: We need a camera, a scene, and a light source to get started. They are so essential that we can’t take photos without them. In WebGL, it is the same process, except we cannot take that equipment for granted. We had to create a camera, a scene, and a light source ourselves each time we built an application, by playing with the C-like shading language and the low-level graphical APIs. It was a tedious procedure, so we have proposed a solution in Carnac3D. We want our users to have all tools ready when they start to build an application, without having to build tools first.

Having things encapsulated doesn’t mean the user will lose control of the details, because we also provide an intuitive interface. No matter which framework (Angular, React, or Vue) or language (JavaScript or TypeScript) the users choose, they can modify and control the settings for rendering with minimum efforts. 

An active community and strong support are things that developers look for when they evaluate and choose among different technologies. INT honors these and has established a developer site with detailed documentation and tutorials. Whenever our users have questions, they can always get help by simply opening a support ticket or logging on to the INT Developer Community. 

Rendering E&P Models Is as Simple as Providing Data

From the render engine’s perspective, it only rasterizes primitives like triangles and does not understand industrial models by default. How can our users render complicated industrial models without having to stack triangles? Our work in Carnac3D gets the job done, so the users can focus on what is more important for them.

3D graphics require a lot of math computations to be done. For example, the render engine behind the hood needs to perform numerous matrix operations for simple actions such as translating, scaling, and rotation. During our process of developing, we created many helper functions that tackle 3D math. Our math module also handles the situation when the users need to trim and fit their 3D data.

Typical E&P features in Carnac3D include, but are not limited to, well trajectories, log curves, array logs, seismics, surfaces, volumetric rendering, and reservoirs. In the user’s application, these features are available and ready to use by providing corresponding datasets. Possible sources for the dataset are local files on disk, data in cloud storage like AWS, and different services like INTGeoServer. We also take into account if users have their own data storage.

ReservoirGrid Is an Example of How We Optimize Things

ReservoirGrid is a feature in Carnac3D that allows users to visualize reservoir characterization. For years, web developers in oil and gas industries have worked on increasing the capacity of reservoir rendering while maintaining a desirable performance. Due to the limitation of web browsers, it’s hard for web applications to catch up with desktop counterparts in terms of performance and scalability. ReservoirGrid is our solution that tackles the dilemma.

INT reservoir grid

To break down into details, we shall see a reservoir consists of numerous hexahedral cells. Each cell stores information such as property value (color), IJK index, and custom data. By bundling the cells together, it can display some internal objects like horizons and skeletons. What makes our ReservoirGrid standout if it sounds concise already? The short answer is optimization. 

We rely on all possible hardware accelerations that WebGL is capable of doing. For example, we noticed that the outlines of each cell bring extra computing burden, so we eliminated these extra draw calls by dealing with them in shaders. We consider it slow to let the CPU do cell filtering, so we impose filters in shaders to reduce communication costs. We observe that each cell might have different shapes, but it is hexahedral anyway, so we manage the GPU to perform instancing drawing with a single draw call. The above and many other minor optimizations help ReservoirGrid render up to a million cells with an entry-level GPU.

For more information on 3D Rendering or INT’s GeoToolkit, please visit our GeoToolkit page.

Want to know more? Check out our webinar Optimizing 3D Subsurface Web Applications.


Filed Under: Carnac 3D, GeoToolkit Tagged With: 3D, geotoolkit, ivaap, Reservoir, WebGL

  • Page 1
  • Page 2
  • Go to Next Page »

Footer

Solutions

  • Real-Time Visualization
  • Visualization Components
  • New Energy Visualization
  • OSDU Visualization
  • Machine Learning
  • Developer Tools
  • Cloud Partners
  • Customer Success Stories

Products

  • IVAAP
  • GeoToolkit
  • INTViewer
  • IVAAP Demos
  • GeoToolkit Demos

About

  • News
  • Events
  • Careers
  • Management Team

Resources

  • Blog
  • FAQ

Support

  • JIRA
  • Developer Community

Contact

INT logo
© 1989–2024 Interactive Network Technologies, Inc.
Privacy Policy
  • Careers
  • Contact Us
  • Search

COPYRIGHT © 2025 INTERACTIVE NETWORK TECHNOLOGIES, Inc