• Skip to main content
  • Skip to footer

INT

Empowering Visualization

COMMUNITY BLOG
CONTACT US SUPPORT
MENUMENU
  • Solutions
    • Overview
    • Real-Time Visualization
    • Visualization Components
    • New Energy Visualization
    • OSDU Visualization
    • Machine Learning
    • Developer Tools
    • Cloud Partners
  • Products
    • IVAAP™
          • SOLUTIONS

            Real-Time Visualization

            OSDU Visualization

            Visualization Components

            New Energy Visualization

            Upstream Data Visualization

          • SUCCESS STORIES

            WEATHERFORD
            Well delivery optimization software

            BARDASZ
            Data management, data quality monitoring

            ANPG / SATEC-MIAPIA
            Virtual data room

            MAILLANCE
            High-performance visualization of ML algorithms

            SEE ALL >

          • SUPPORT

            DEVELOPER COMMUNITY
            Join or log in to the INT Developer Community.

            GET SUPPORT
            Log a ticket for an issue or bug.

            CONTACT US

          • DEMOS

            IVAAP DEMOS
            Cloud-Based Demos

            FIRST TIME HERE?
            Register to access our
            IVAAP demos

    • GeoToolkit™
          • SUCCESS STORIES

            CAYROS
            Field development planning

            TOTALENERGIES
            High-performance large dataset reservoir rendering

            IFP ENERGIES NOUVELLES
            Seismic and structural interpretation validation

            SEE ALL >

          • SUPPORT

            DEVELOPER COMMUNITY
            Join or log in to the INT Developer Community.

            GET SUPPORT
            Log a ticket for an issue or bug.

            CONTACT US

          • DEMOS

            GEOTOOLKIT DEMOS
            Geoscience Demos

    • INTViewer™
          • SUCCESS STORIES

            STRYDE
            Fast seismic QA/QC in the field

            SILVERTHORNE SEISMIC
            Efficient 2D/3D seismic data delivery

            WIRELESS SEISMIC
            Drones, IoT, and Advanced Onsite Seismic Data Validation

            SEE ALL >

          • SUPPORT

            GET SUPPORT
            Log a ticket for an issue or bug.

            CONTACT US

          • PLUG-INS

            EXTEND INTVIEWER
            More than 65 plugins available

  • Demos
    • GeoToolkit Demos
    • IVAAP Demos
  • Success Stories
  • Resources
    • Blog
    • Developer Community
    • FAQ
    • INT Resources Library
  • About
    • Overview
    • News
    • Events
    • Careers
    • Meet Our Team
    • About INT

3D

Jul 25 2017

Picking Horizons in INTViewer 5.2

Horizon picking is a feature that INTViewer has included from the start. However, after discussing with several long-time users, I have found that the evolutions brought by each release can be missed. The release of INTViewer 5.2 is a good opportunity to tour basic picking options.

First, a bit of terminology. The term “horizon” in geoscience is often a generic term for surfaces. In INTViewer, “horizon” is a surface that is typically defined by trace number or INLINE-XLINE as opposed to X-Y.

In INTViewer’s lingo, surfaces defined in X-Y are “grid surfaces” if they follow an X-Y grid. If they don’t follow of well-defined grid, they are “Gocad” or “Triangle Mesh” surfaces. The “grid” of an “horizon” is the grid of the underlying seismic dataset. Users can work with horizons on 2D datasets, 3D volumes, and gathers.

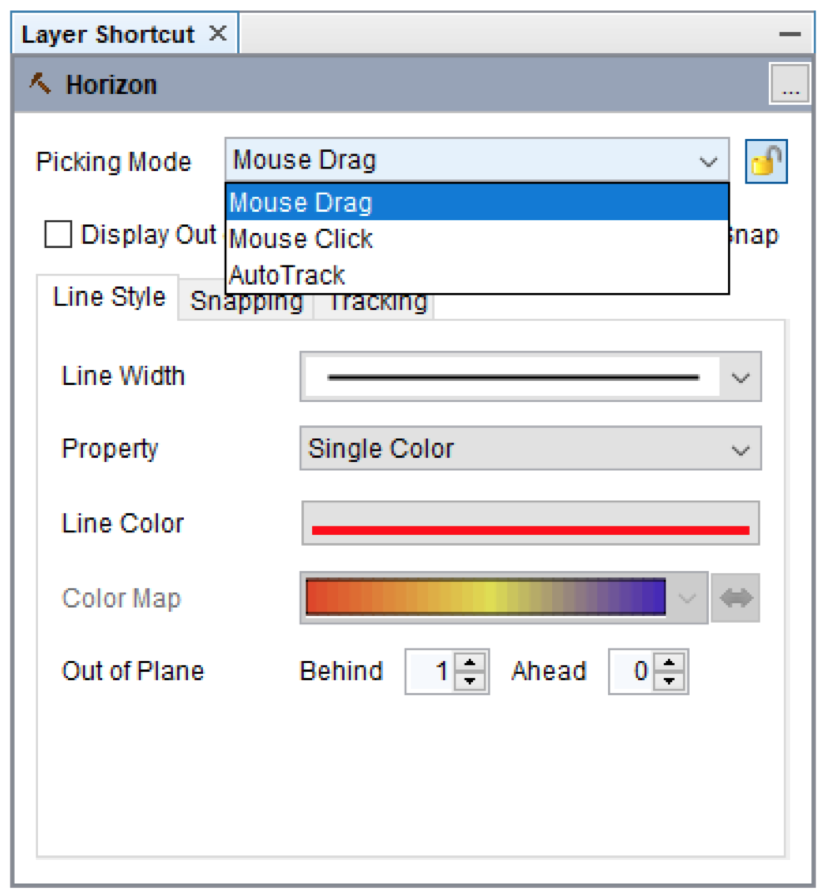
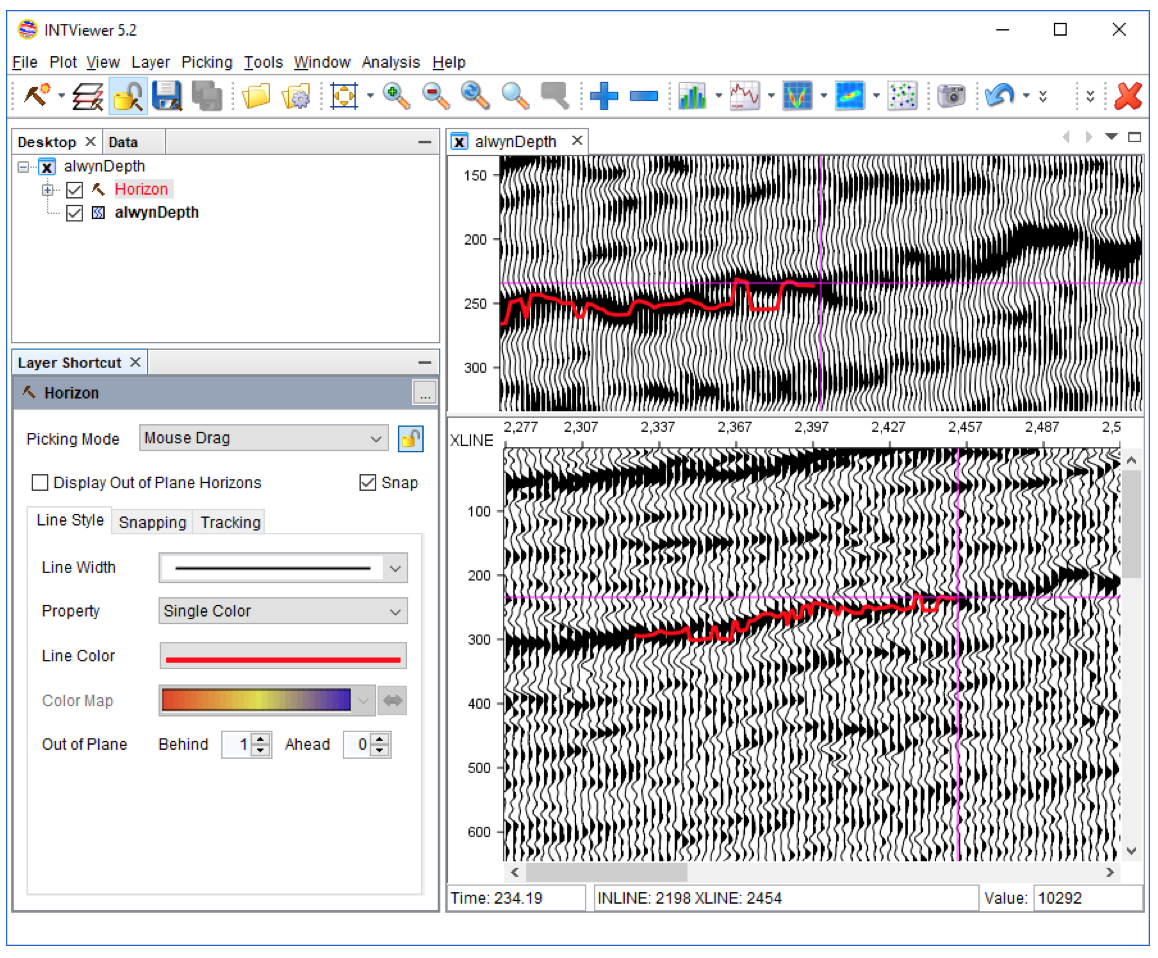
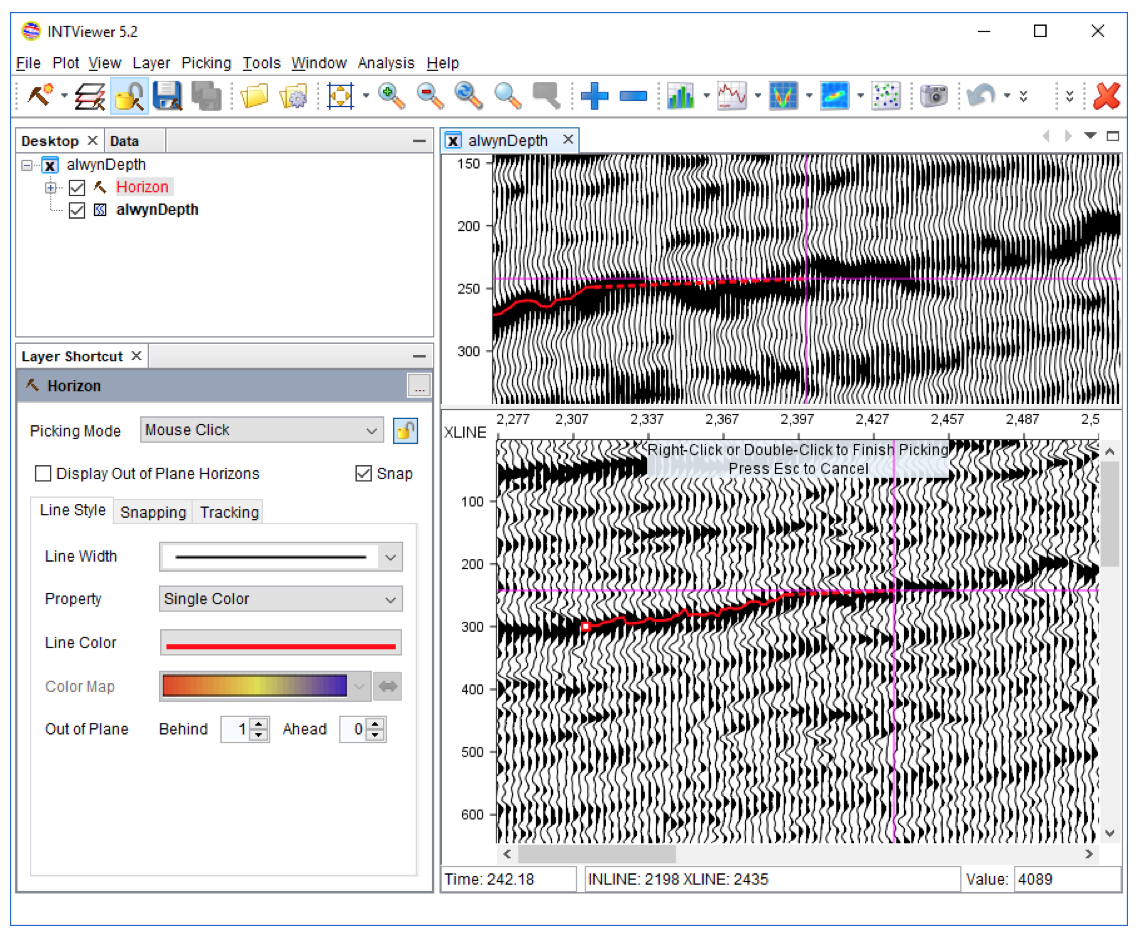
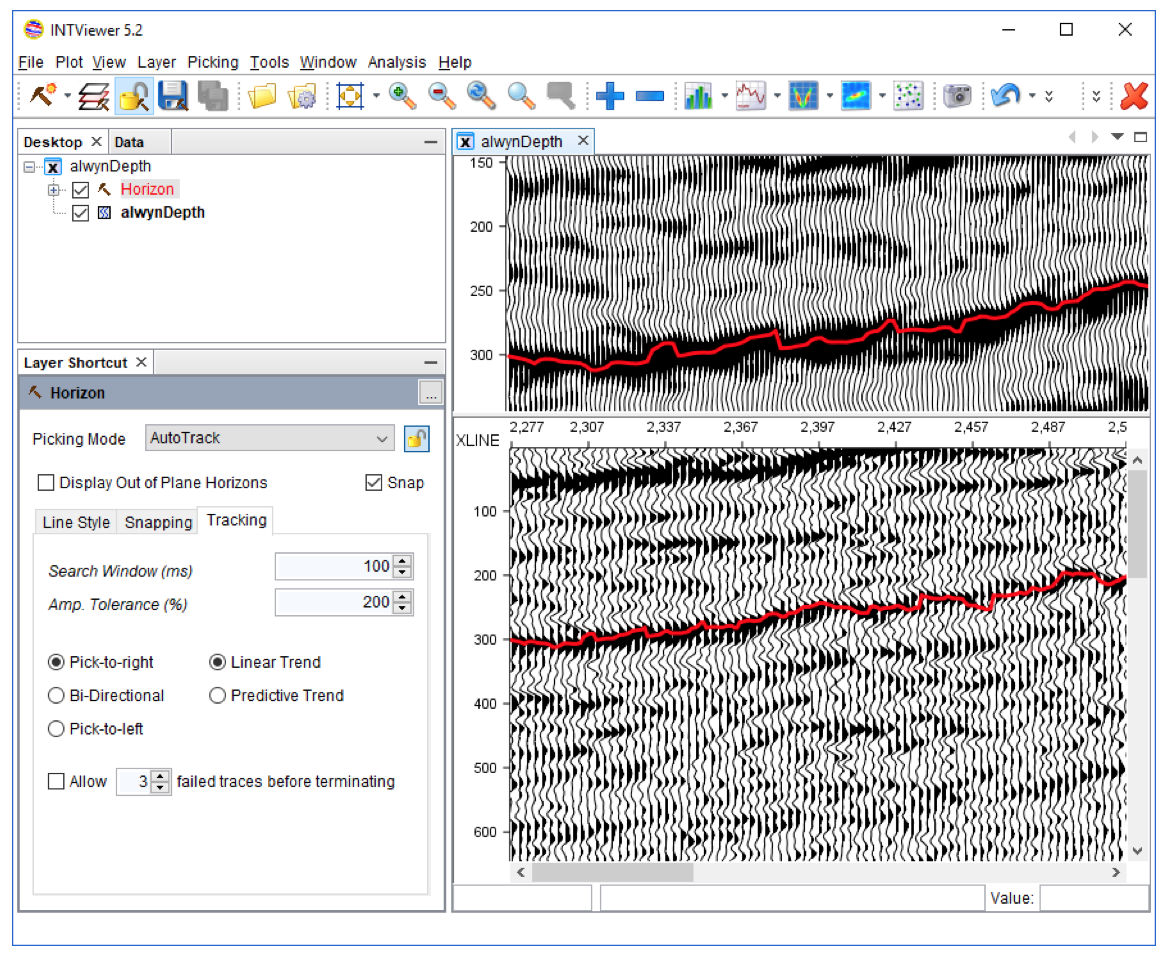
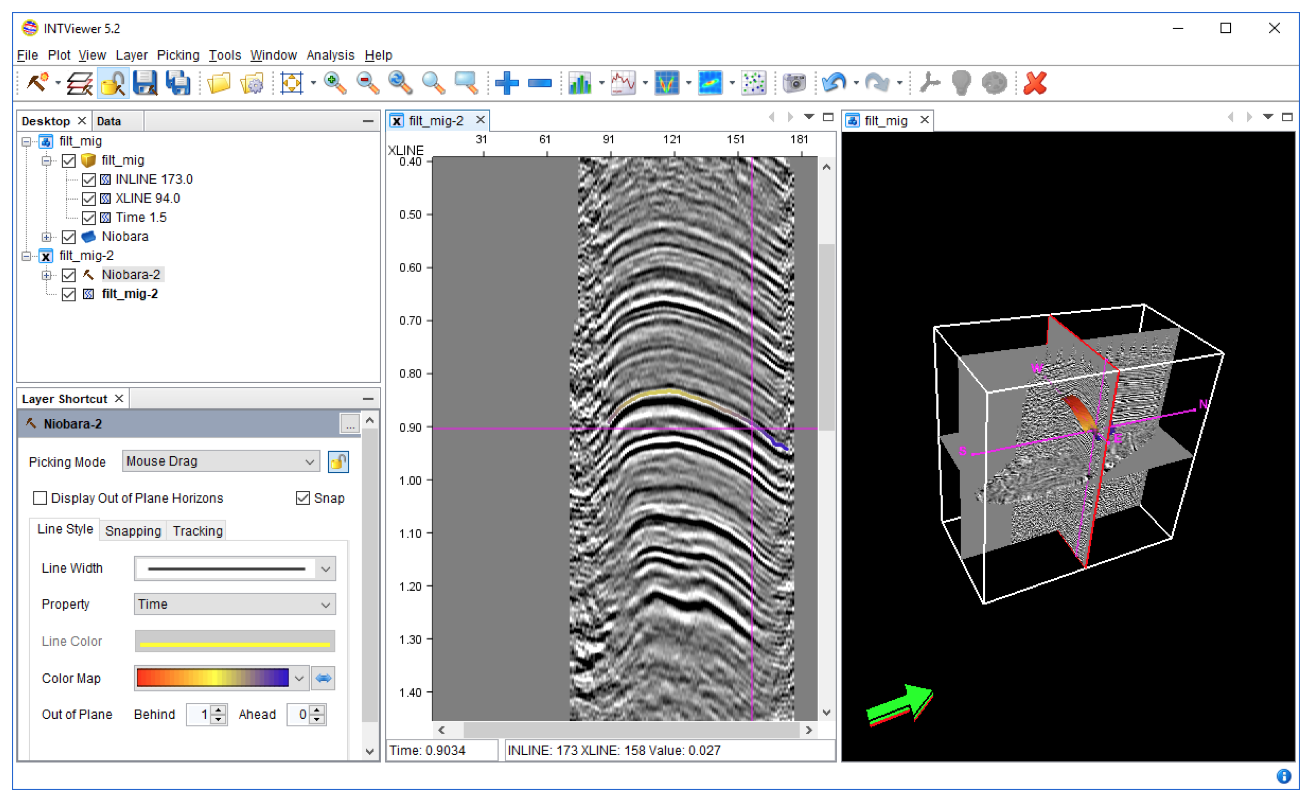
When it comes to editing horizons, there are three picking modes available: Mouse Drag, Mouse Click, and AutoTrack.

The layer shortcut window giving quick access to all horizon options.
 
The Mouse Drag picking mode is the default and lets you draw continuous lines across a XSection.

An example of picking using Mouse Drag.
 
Mouse Click is a faster picking mode as you only need to pick a few points. After you release the mouse, the traces between the last two points are auto-picked.

An example of picking using Mouse Click.
 
AutoTrack is the fastest picking mode as it will pick across the entire section visualized on screen.

An example of picking using AutoTrack.
 
Users are not limited to one picking mode. Keyboard shortcuts let you switch modes interactively as you are picking points. You can elect to “snap” picks to peaks or troughs and sample measurements are affected by default by any trace processor that might be applied.

All snapping options.
 
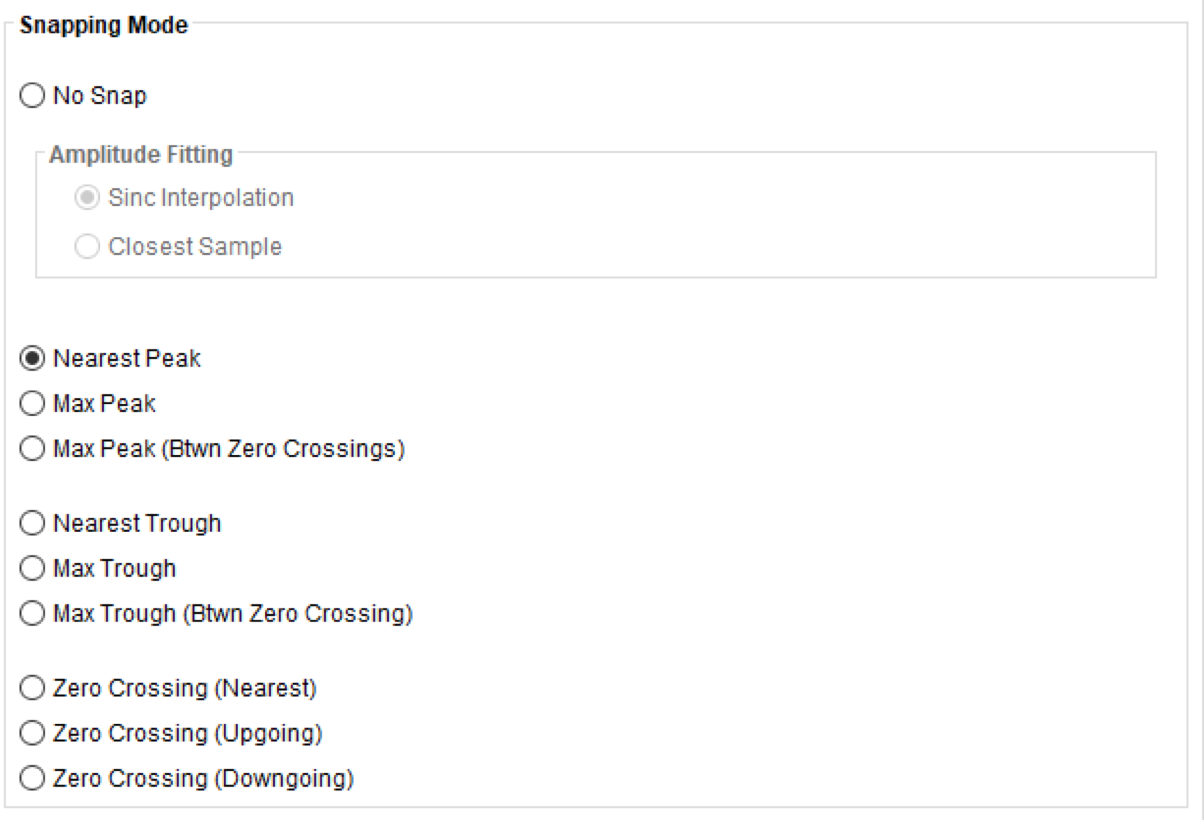
Each snapping option is detailed in the INTViewer user guide.

Your picks are reflected in real time in all windows, including 3D windows.

A 3D window next to a 2D window where an horizon is picked.
 
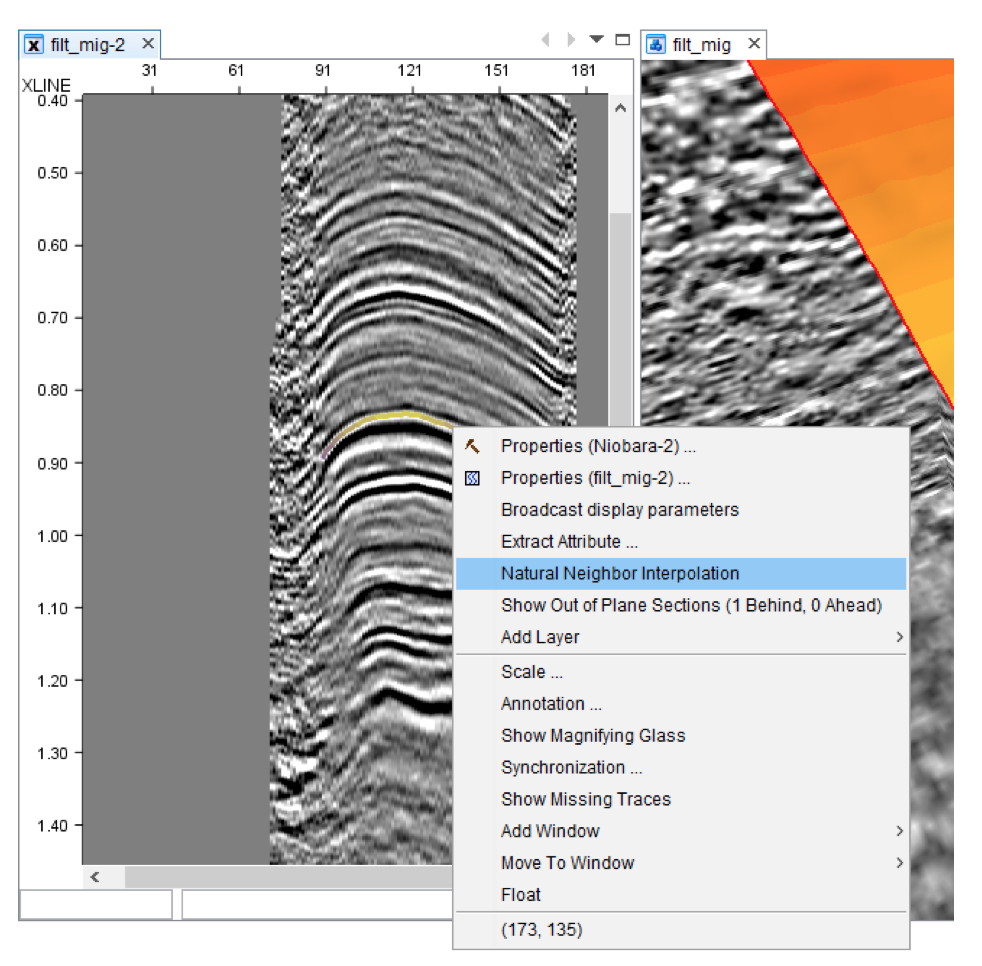
Which brings me to this new INTViewer feature. Picking in 2D is a tedious activity. A faster way to pick a full volume is to use the built-in horizon interpolation.

This interpolation uses the Natural Neighbor algorithm to propagate existing picks into a full surface. This is an option accessible from the contextual menu of an horizon layer.

The Natural Neighbor Interpolation option
 
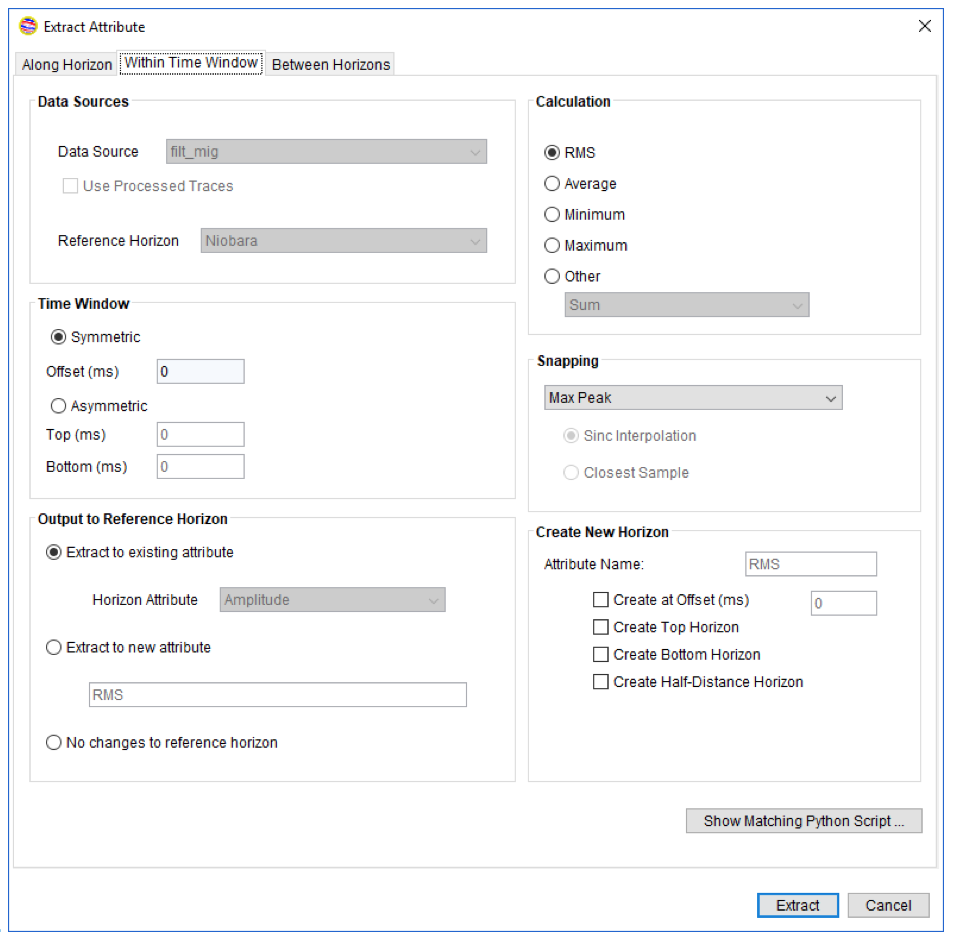
Another often overlooked feature of INTViewer is the attribute extraction. Download the Horizon Attribute Extraction plugin from the Plugin Store to benefit from this feature.

Click the highlighted link to install this free plugin.
 
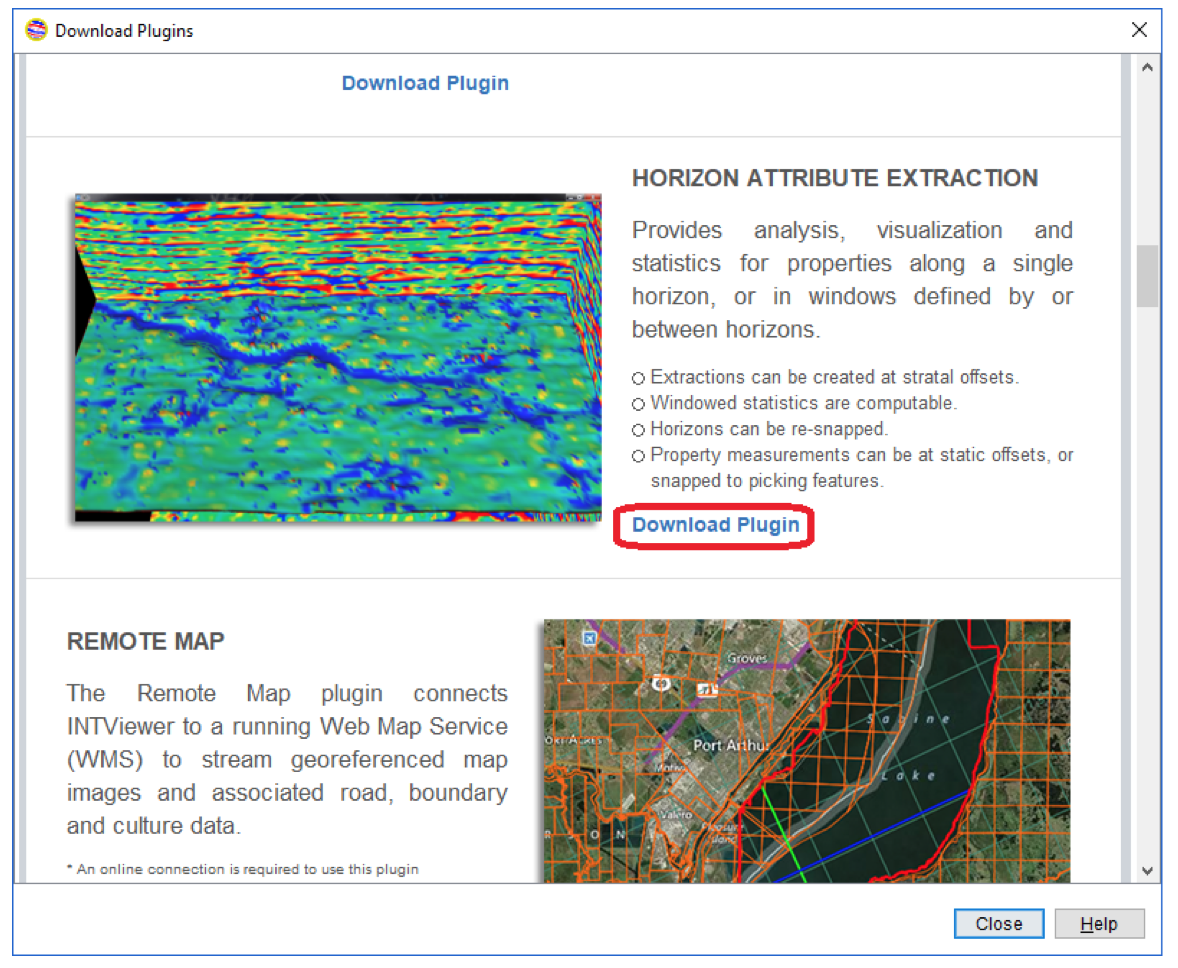
The horizon extraction is also accessible from the contextual menu of an horizon layer. This is a tool with numerous options, useful for 4D analysis. As this is an operation that is typically applied to multiple datasets, it is scriptable in Python. INTViewer will create Python scripts for you based upon your extraction parameters.

The Horizon Attribute Extraction dialog.
 
There are a few features not included in this tour: A calculator is available to combine the attribute of several horizons with a mathematical formula. Formulas can also be applied to trace headers to create header horizons.

Contact us for more information on horizon picking!


Filed Under: INTViewer Tagged With: 2D, 3D, horizon picking, INTViewer

  • « Go to Previous Page
  • Page 1
  • Page 2

Footer

Solutions

  • Real-Time Visualization
  • Visualization Components
  • New Energy Visualization
  • OSDU Visualization
  • Machine Learning
  • Developer Tools
  • Cloud Partners
  • Customer Success Stories

Products

  • IVAAP
  • GeoToolkit
  • INTViewer
  • IVAAP Demos
  • GeoToolkit Demos

About

  • News
  • Events
  • Careers
  • Management Team

Resources

  • Blog
  • FAQ

Support

  • JIRA
  • Developer Community

Contact

INT logo
© 1989–2024 Interactive Network Technologies, Inc.
Privacy Policy
  • Careers
  • Contact Us
  • Search

COPYRIGHT © 2025 INTERACTIVE NETWORK TECHNOLOGIES, Inc