• Skip to main content
  • Skip to footer

INT

Empowering Visualization

COMMUNITY BLOG
CONTACT US SUPPORT
MENUMENU
  • Solutions
    • Overview
    • Real-Time Visualization
    • Visualization Components
    • New Energy Visualization
    • OSDU Visualization
    • Machine Learning
    • Developer Tools
    • Cloud Partners
  • Products
    • IVAAP™
          • SOLUTIONS

            Real-Time Visualization

            OSDU Visualization

            Visualization Components

            New Energy Visualization

            Upstream Data Visualization

          • SUCCESS STORIES

            WEATHERFORD
            Well delivery optimization software

            BARDASZ
            Data management, data quality monitoring

            ANPG / SATEC-MIAPIA
            Virtual data room

            MAILLANCE
            High-performance visualization of ML algorithms

            SEE ALL >

          • SUPPORT

            DEVELOPER COMMUNITY
            Join or log in to the INT Developer Community.

            GET SUPPORT
            Log a ticket for an issue or bug.

            CONTACT US

          • DEMOS

            IVAAP DEMOS
            Cloud-Based Demos

            FIRST TIME HERE?
            Register to access our
            IVAAP demos

    • GeoToolkit™
          • SUCCESS STORIES

            CAYROS
            Field development planning

            TOTALENERGIES
            High-performance large dataset reservoir rendering

            IFP ENERGIES NOUVELLES
            Seismic and structural interpretation validation

            SEE ALL >

          • SUPPORT

            DEVELOPER COMMUNITY
            Join or log in to the INT Developer Community.

            GET SUPPORT
            Log a ticket for an issue or bug.

            CONTACT US

          • DEMOS

            GEOTOOLKIT DEMOS
            Geoscience Demos

    • INTViewer™
          • SUCCESS STORIES

            STRYDE
            Fast seismic QA/QC in the field

            SILVERTHORNE SEISMIC
            Efficient 2D/3D seismic data delivery

            WIRELESS SEISMIC
            Drones, IoT, and Advanced Onsite Seismic Data Validation

            SEE ALL >

          • SUPPORT

            GET SUPPORT
            Log a ticket for an issue or bug.

            CONTACT US

          • PLUG-INS

            EXTEND INTVIEWER
            More than 65 plugins available

  • Demos
    • GeoToolkit Demos
    • IVAAP Demos
  • Success Stories
  • Resources
    • Blog
    • Developer Community
    • FAQ
    • INT Resources Library
  • About
    • Overview
    • News
    • Events
    • Careers
    • Meet Our Team
    • About INT

AWS

Feb 22 2024

Navigating the Deployment Challenges You May Run into with the OSDU® Data Platform: A Few Strategies for Maximizing Value

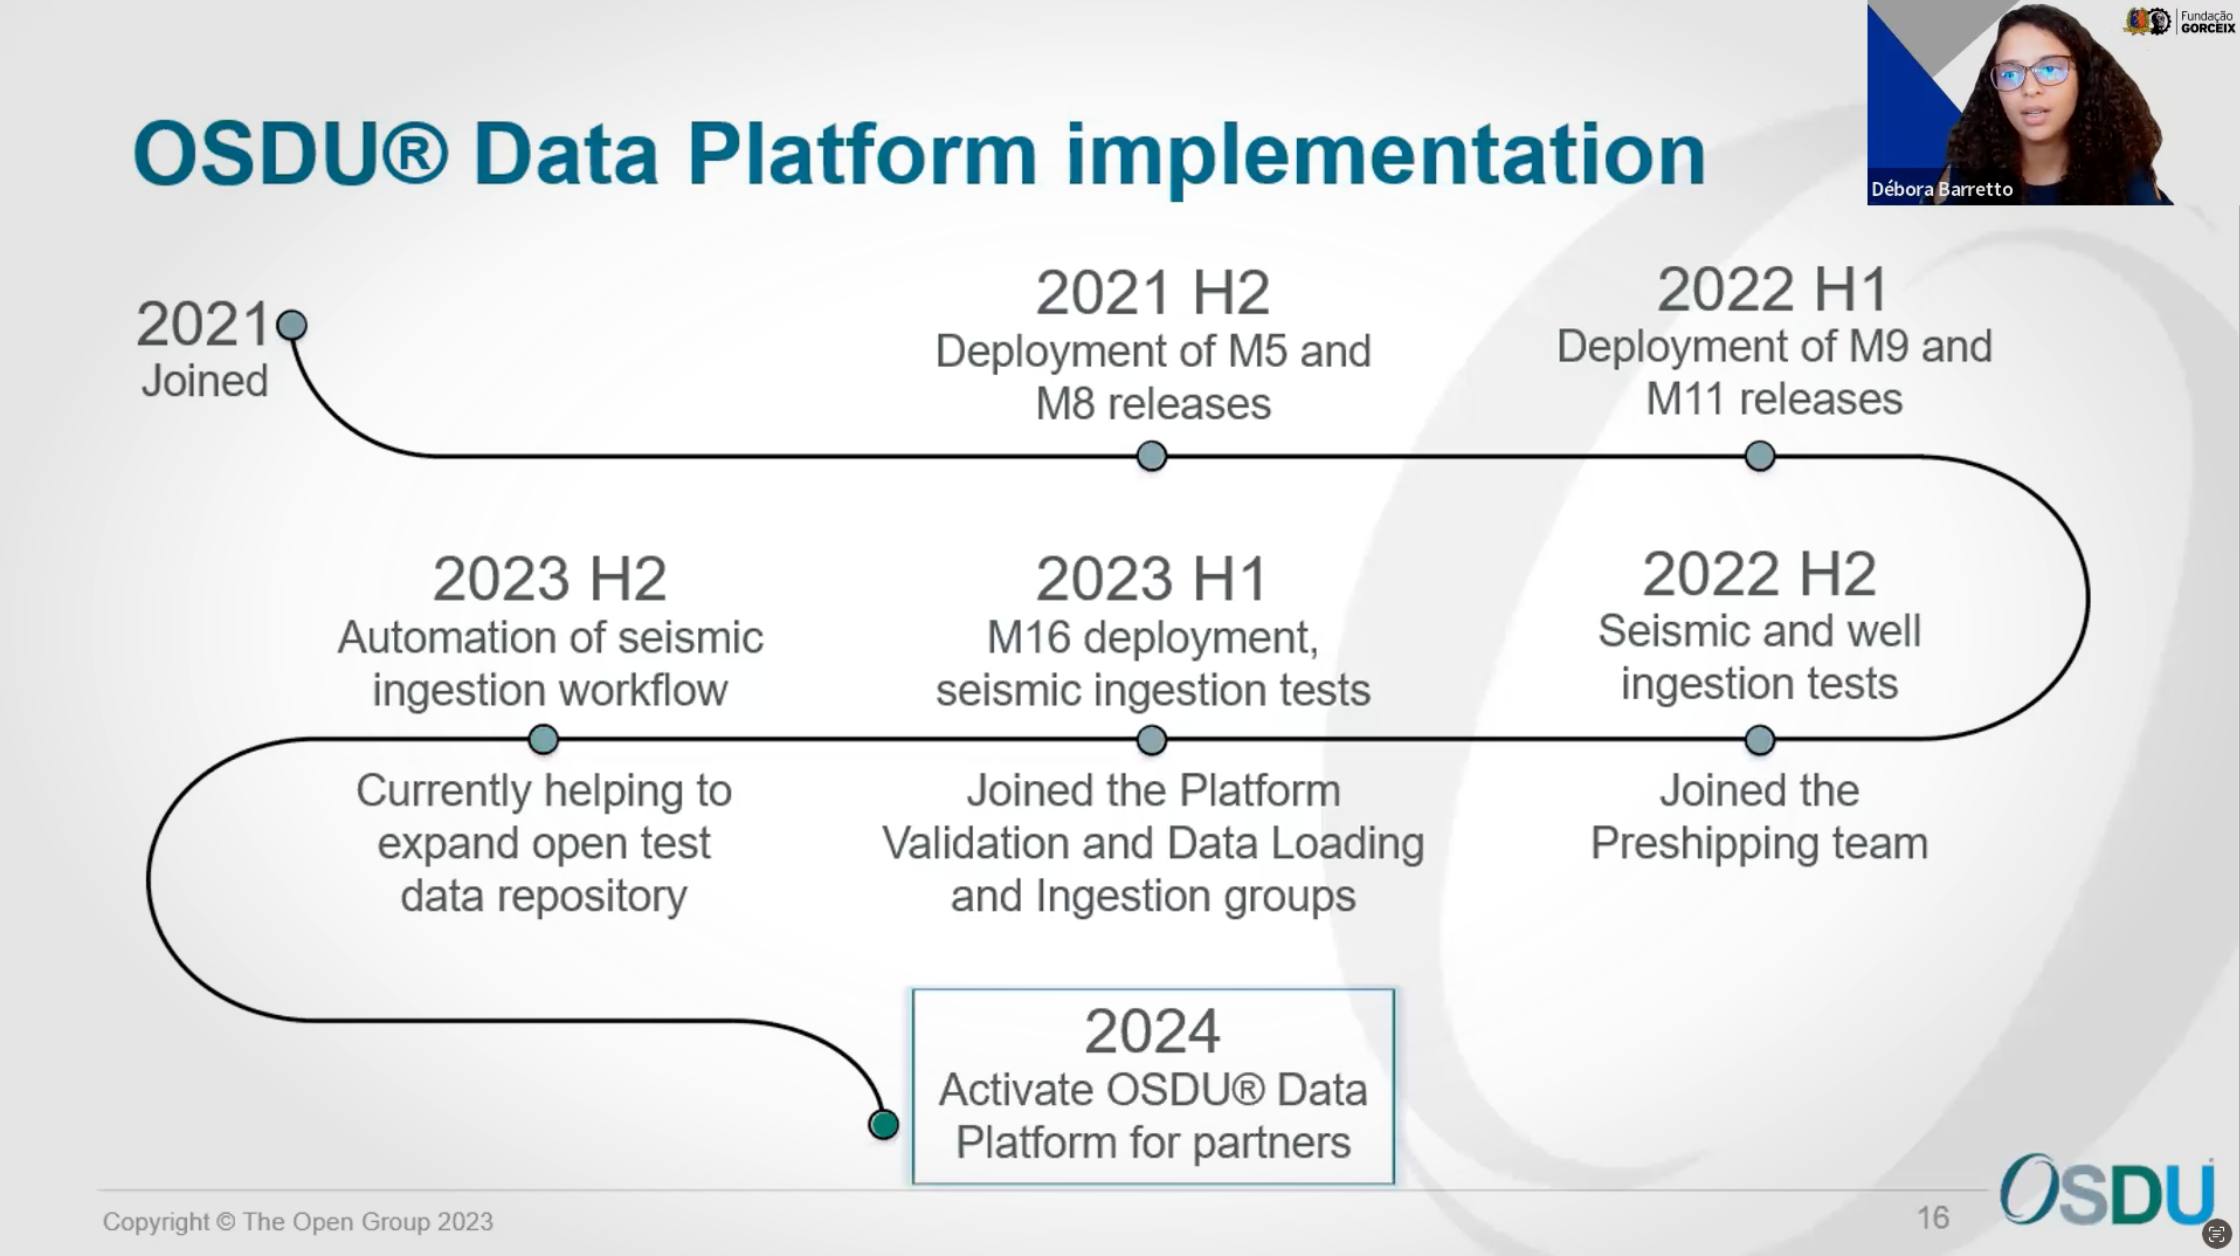
The oil and gas landscape is constantly evolving, and the Open Subsurface Data Universe (OSDU) initiative stands at the forefront of this change. Its Data Platform promises to streamline operations and unlock valuable insights, but navigating its complexities can be challenging.

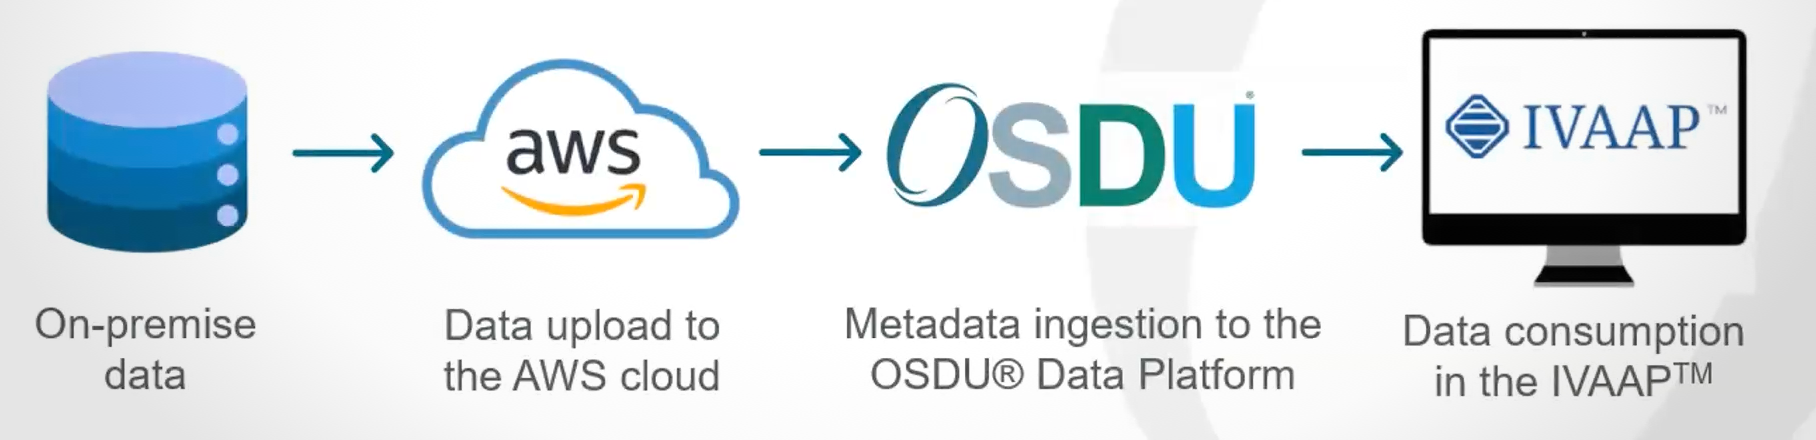
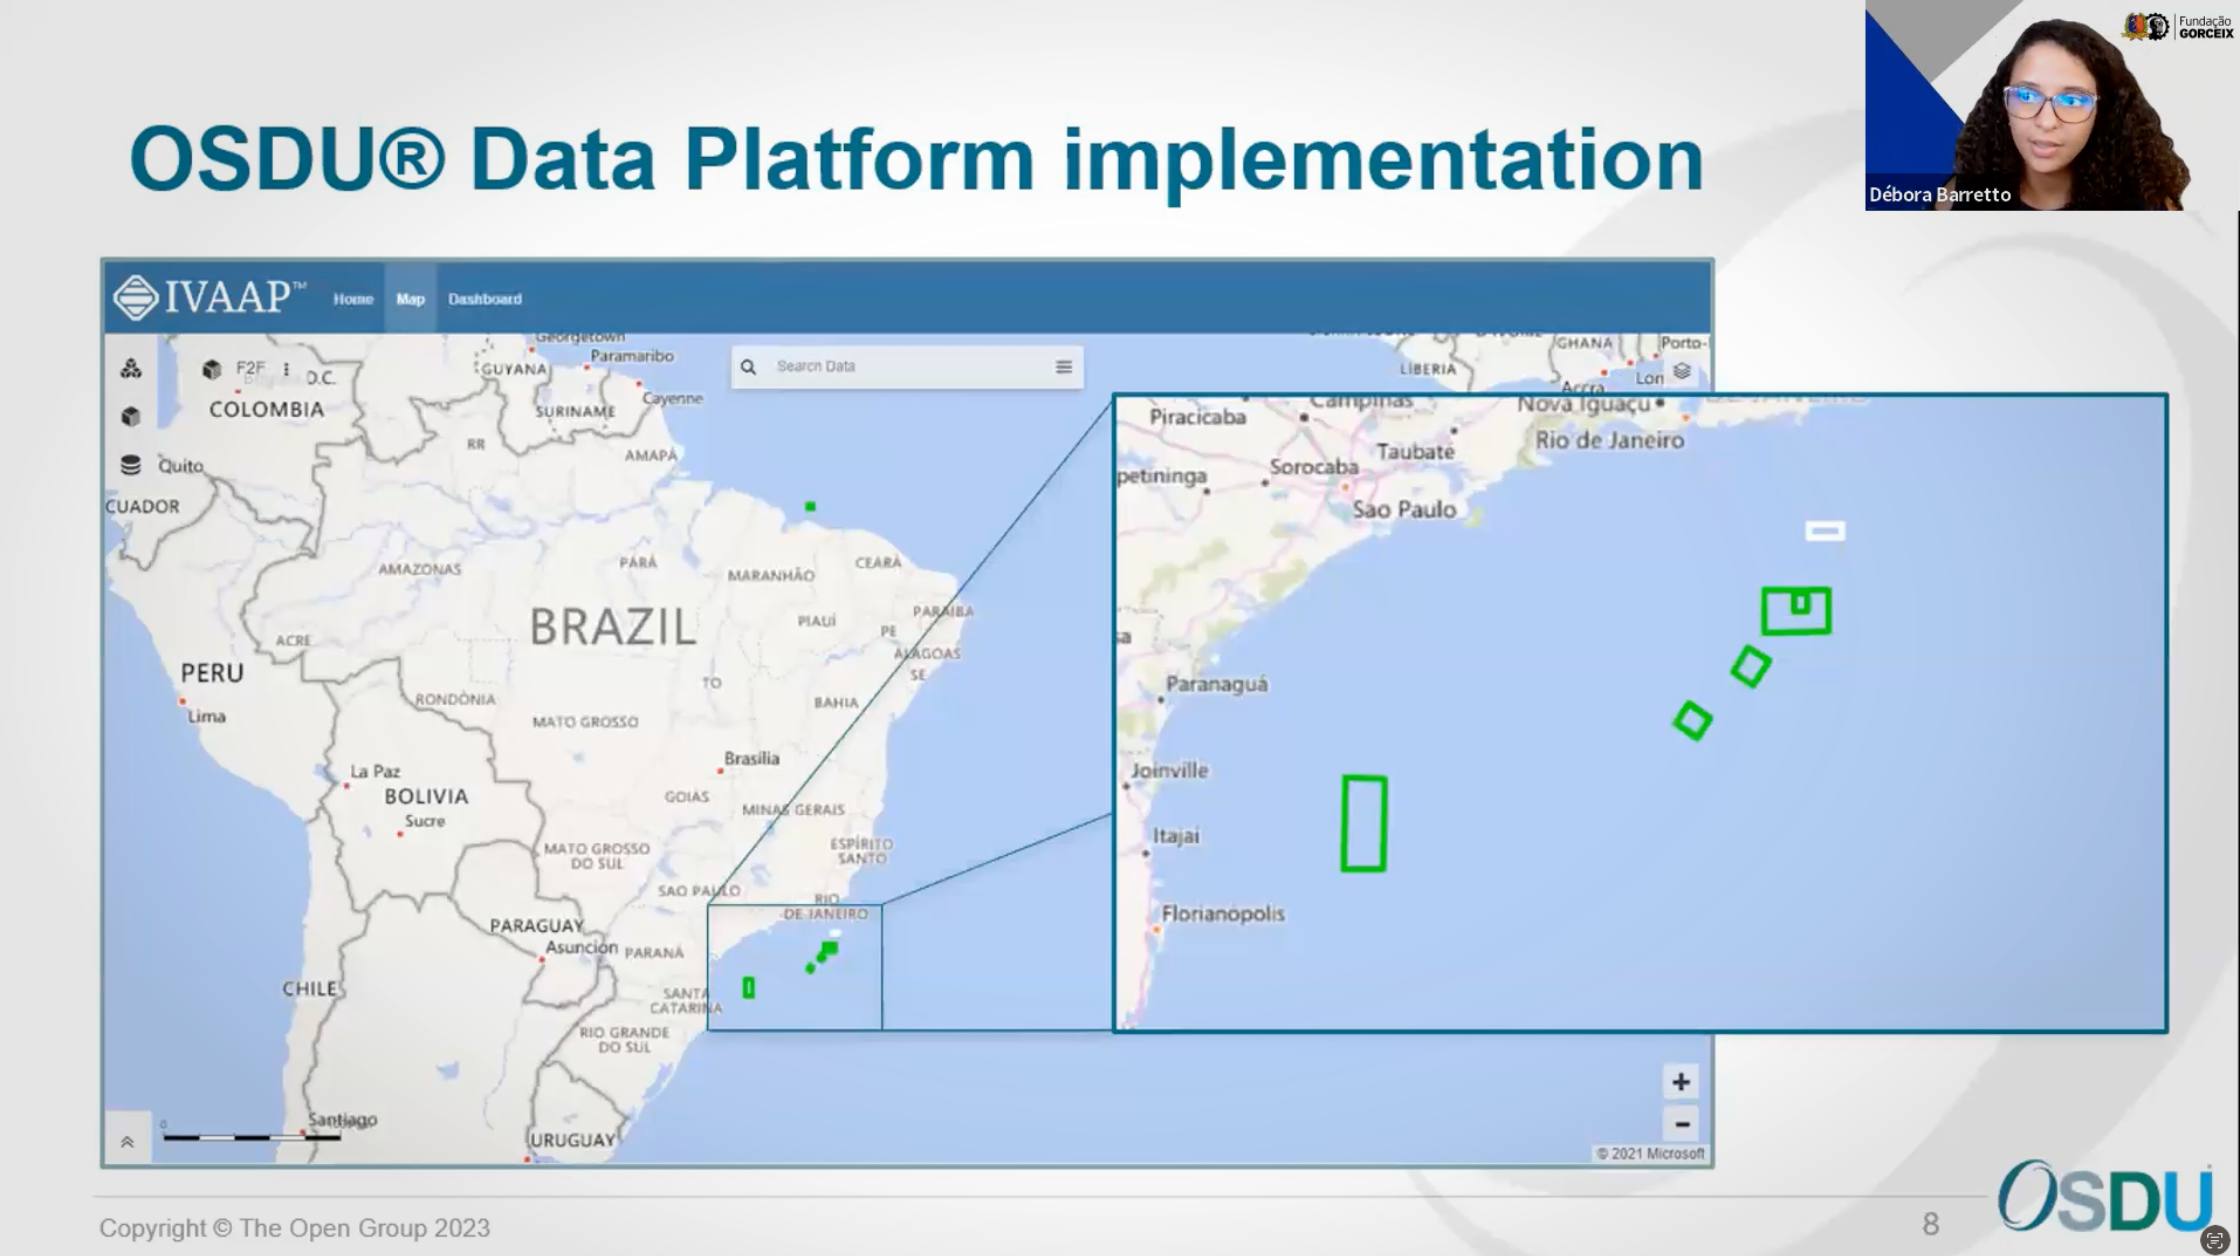
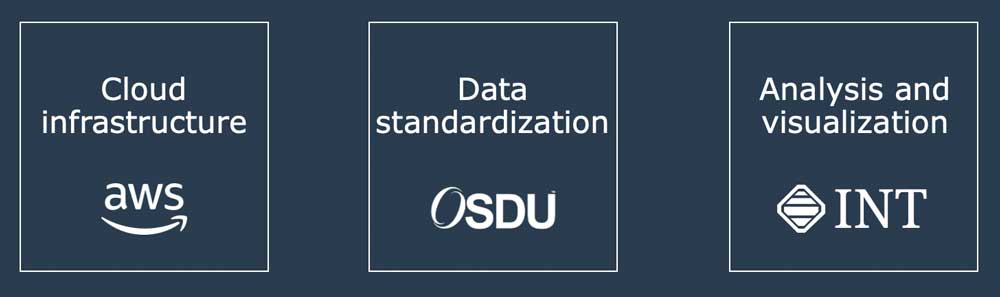
Since 2018, INT has been deeply involved in the OSDU journey, deploying our E&P data visualization platform, IVAAP, at every stage of the Data Platform’s development. This experience has given us unique insights and allowed us to participate in diverse deployments across scales — from proofs of concept and pilots to full-fledged production implementations. Whether you’re on AWS, Azure, GCP, or IBM Cloud, we have the expertise to guide you through your OSDU journey.

In this blog, we’ll dive deep into the insights gleaned by our team on the challenges operators face when adopting OSDU as a standard. We’ll explore the hurdles of connecting legacy applications and data with the platform and offer practical strategies to navigate this transformation and unlock its true value.


INT-OSDU-diagram


Overcoming Ingestion Challenges

While data ingestion is essential for unlocking OSDU’s power, hidden problems often lurk beneath the surface. Our experience across various implementations reveals a recurring issue: data definition and design flaws only surface after data is already ingested. This often stems from the lack of readily available visualization tools during the ingestion stage. Essentially, ingesting data “blindly” can lead to undetected errors that later derail progress.

The key to overcoming this challenge lies in early detection and proactive correction. By integrating data visualization tools like IVAAP directly into the ingestion process, we can identify issues like incomplete data sets and incorrect metadata in real time. This shift from “ingest first, fix later” to “visualize, identify, correct” can significantly streamline the process and prevent downstream complications.

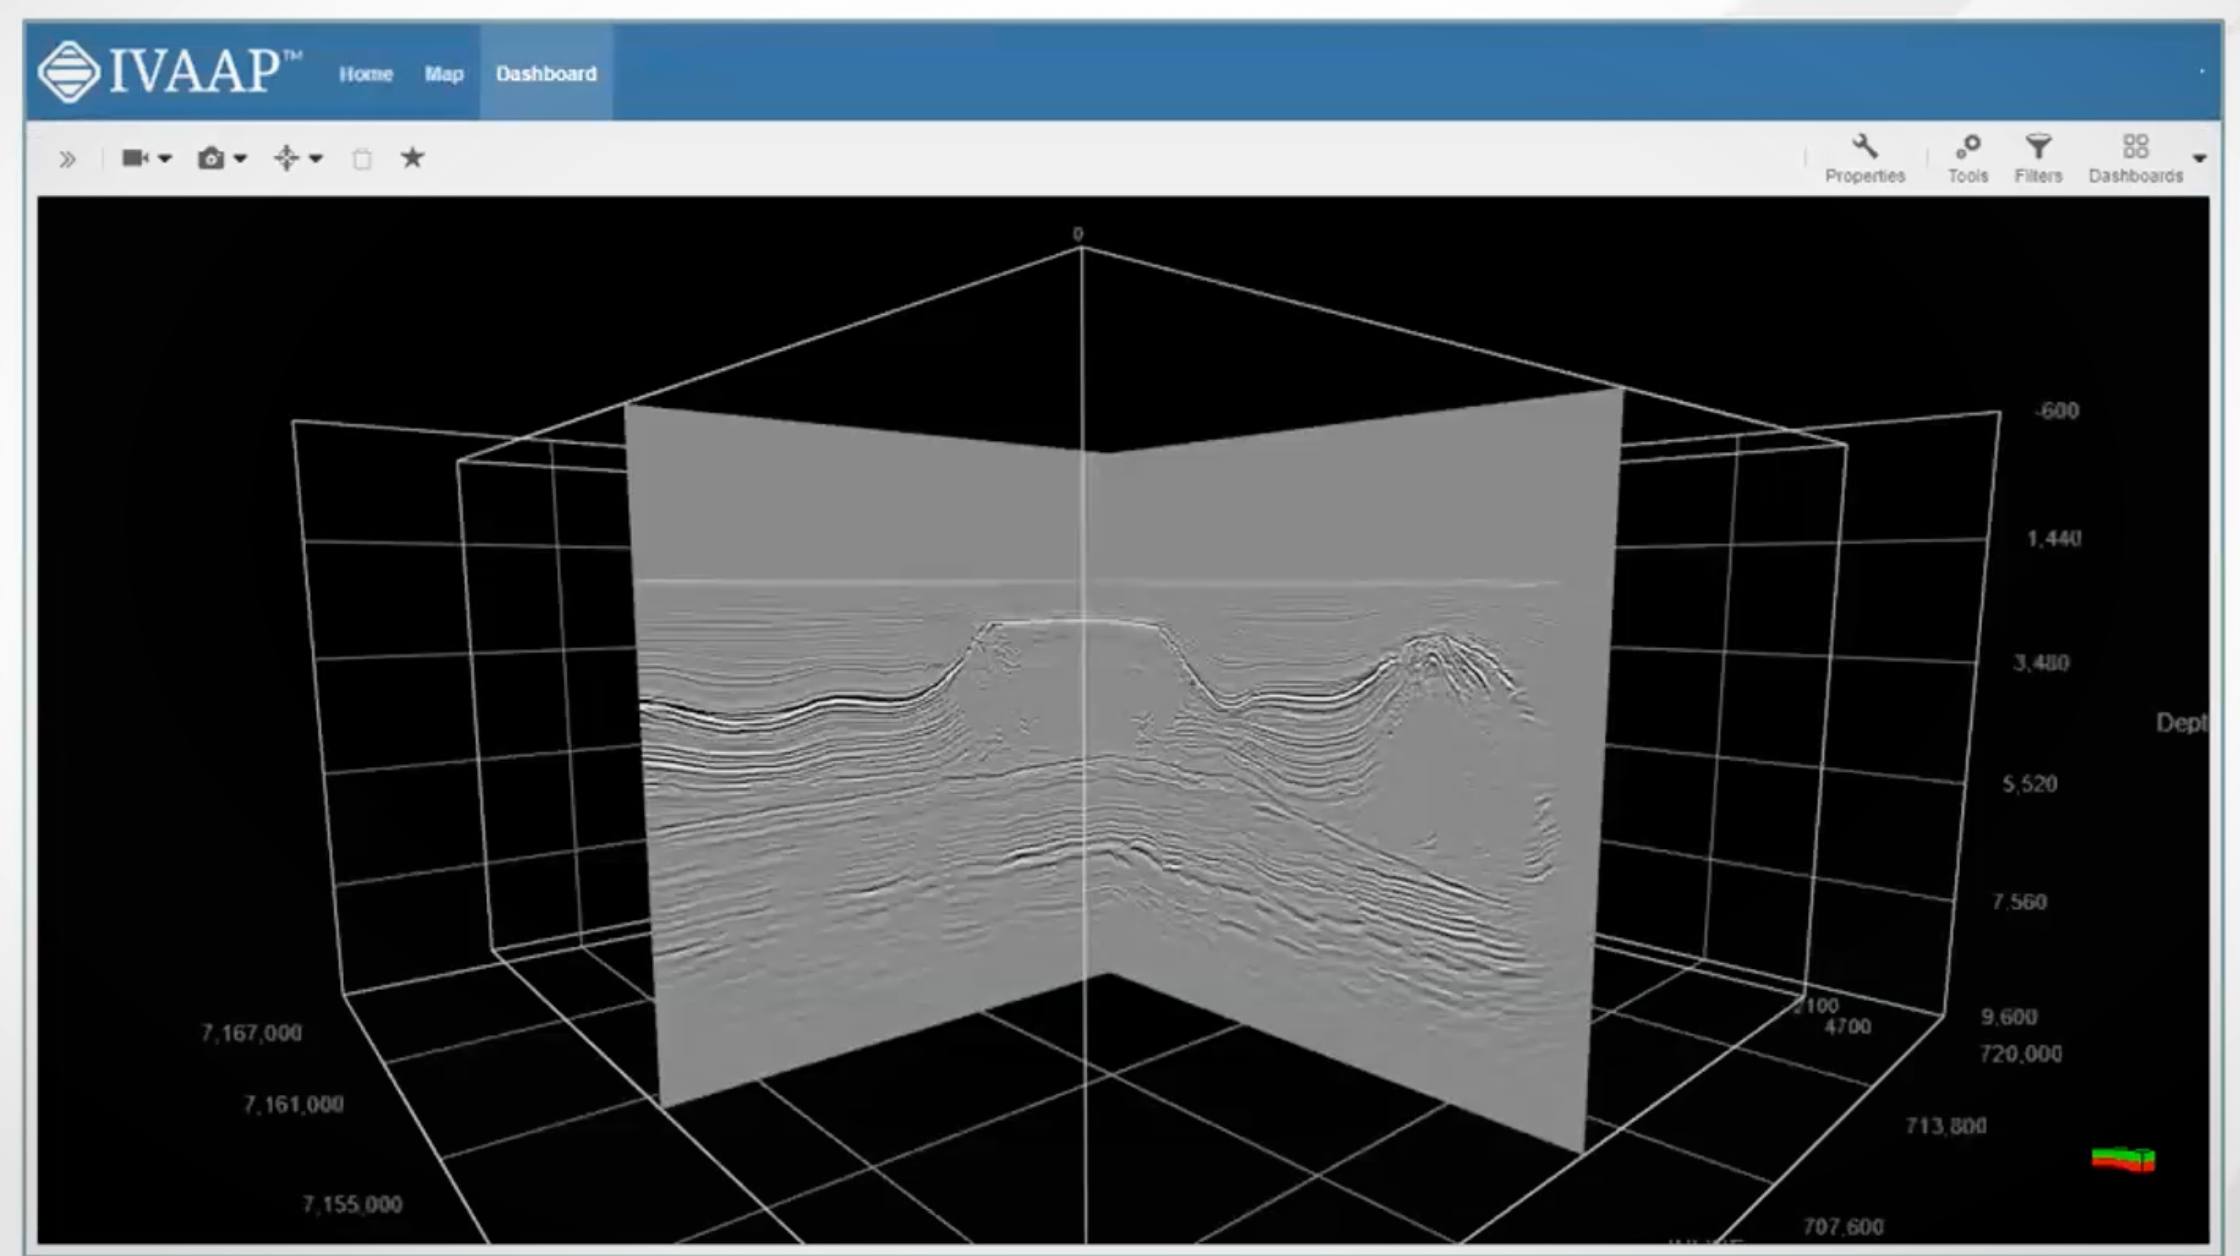
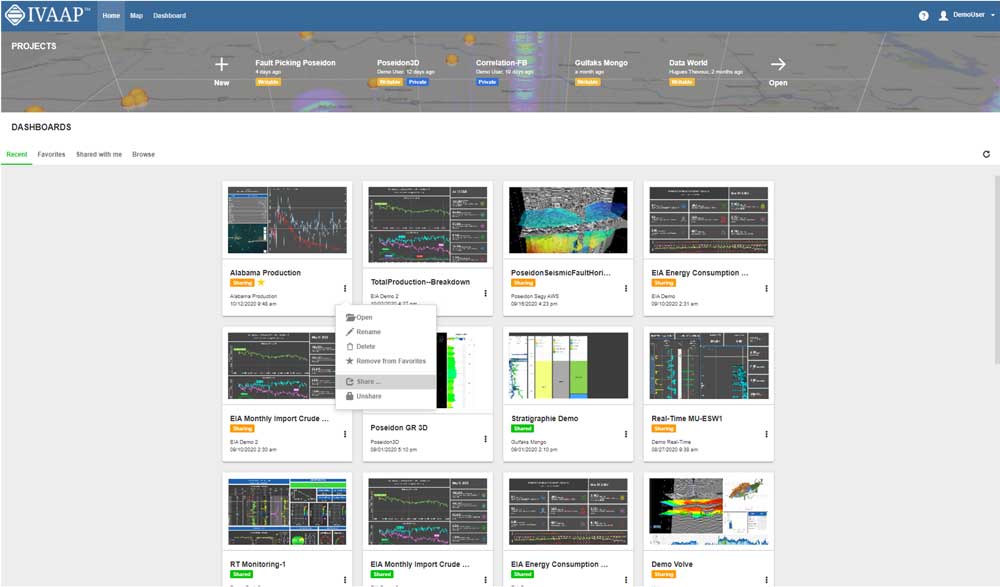
Hence, it becomes essential to have a means of visualizing and quality-checking the data as early as possible in the process when dealing with the vast number of fields in OSDU. Some parameters essential for consumption may not be explicitly required in the specifications. As a native OSDU viewer, IVAAP Data Visualization platform has been used to mitigate this risk by enabling users to perform sanity checks and validate the quality of the data throughout the ingestion process to start assessing it even during the data design phase.

Simply displaying ingested data in a web browser early on can significantly improve error detection and streamline the entire process. In simple terms, a recipe can look right on paper, but having a way to taste it before serving it to 100 guests is a safer incremental approach.

Data Mapping and Enriching the OSDU Data Model

While operators embrace the standardized data models offered by OSDU, they also require flexibility to manage their unique data needs. This is where extensions come in, allowing operators to add custom metadata and data elements essential for their specific operations, geological decisions, and analysis.

However, introducing extensions can increase the complexity of OSDU adoption. Integrating these extensions requires all applications in the data pipeline and consumption ecosystem to be not only OSDU-compliant but also adaptable to exposing these unique data elements. This applies to both the submerged “iceberg” (foundation, ingestion, enrichment, infrastructure) and the exposed “tip” (user access, consumption, and visualization). 

Our experience shows that leveraging IVAAP SDKs effectively addresses this challenge. They enable extending and enriching the OSDU data model with client-specific requirements, ultimately presenting users with “their data” tailored to their workflows.

Connecting Non-OSDU Data, Legacy Applications with OSDU-Ready Data

While the promise of OSDU is clear, migrating all applications overnight isn’t feasible for many oil and gas companies. Many crucial legacy applications might take years to be fully “OSDU-ready” — and may never be. 

The OSDU Forum is making significant strides in standardization, but it’s an ongoing process with frequent updates and not all data types are currently supported. This can create a temporary gap between those ready for OSDU and those still relying on legacy systems.

The key challenge is preventing information silos during this transition. You might have some systems offering partial OSDU-ready data while others house crucial non-OSDU data. This fragmentation can negate the benefits of OSDU.

The temptation to stay on the sidelines, waiting for a perfect transition, is understandable. However, delaying adoption can hinder your ability to leverage the transformative power of OSDU. Instead, consider proactive solutions that can bridge the gap while providing a full picture of the entire data universe of interest.

The approach here is to take the data where it is. Data in the oil and gas industry can often be spread across different databases. To bridge this gap, companies can leverage two key strategies:

  1. Native Applications: Utilize existing applications that seamlessly integrate with your legacy systems, allowing you to access and utilize their data within the OSDU environment.
  2. OSDU-Friendly Applications: Choose applications designed to work harmoniously with OSDU, enabling data aggregation and interaction between OSDU-ready and non-OSDU data.

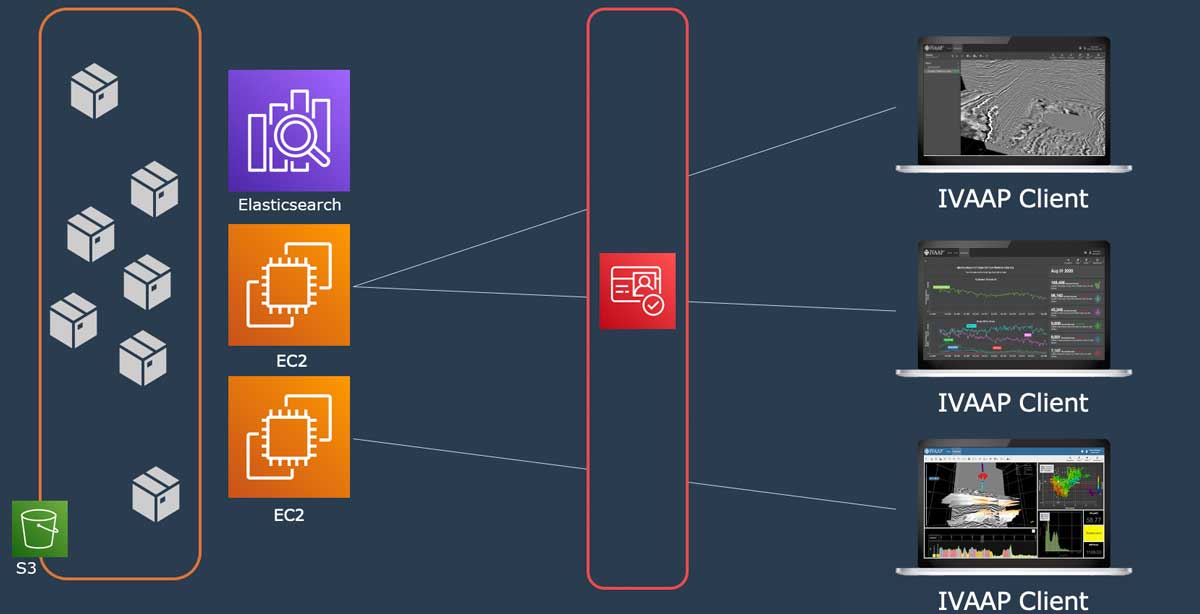
This is, for instance, what IVAAP does with its back-end data connectors and SDK. Aggregation capabilities, pivotal to bridging the OSDU/non-OSDU gap, also enable deeper interoperability. An example of this is the integration of SLB’s DELFI platform with INT’s IVAAP, which connects applications and workflows, making them accessible to all users and enabling team members to build common workspaces for data, data models, and interpretations while respecting proprietary information boundaries and connecting them with OSDU. 

Bridging the gap between legacy applications and OSDU’s standardized data universe can be a complex challenge. Instead of forcing legacy data into a new mold, platforms like IVAAP and SLB DELFI embrace an “integrate to exist” approach. DELFI acts as a data hub, connecting these disparate databases and applications through native integrations and OSDU-friendly tools like IVAAP. This enriches the workflow with advanced visualization and data interactions, unlocking the full potential of your data universe.  

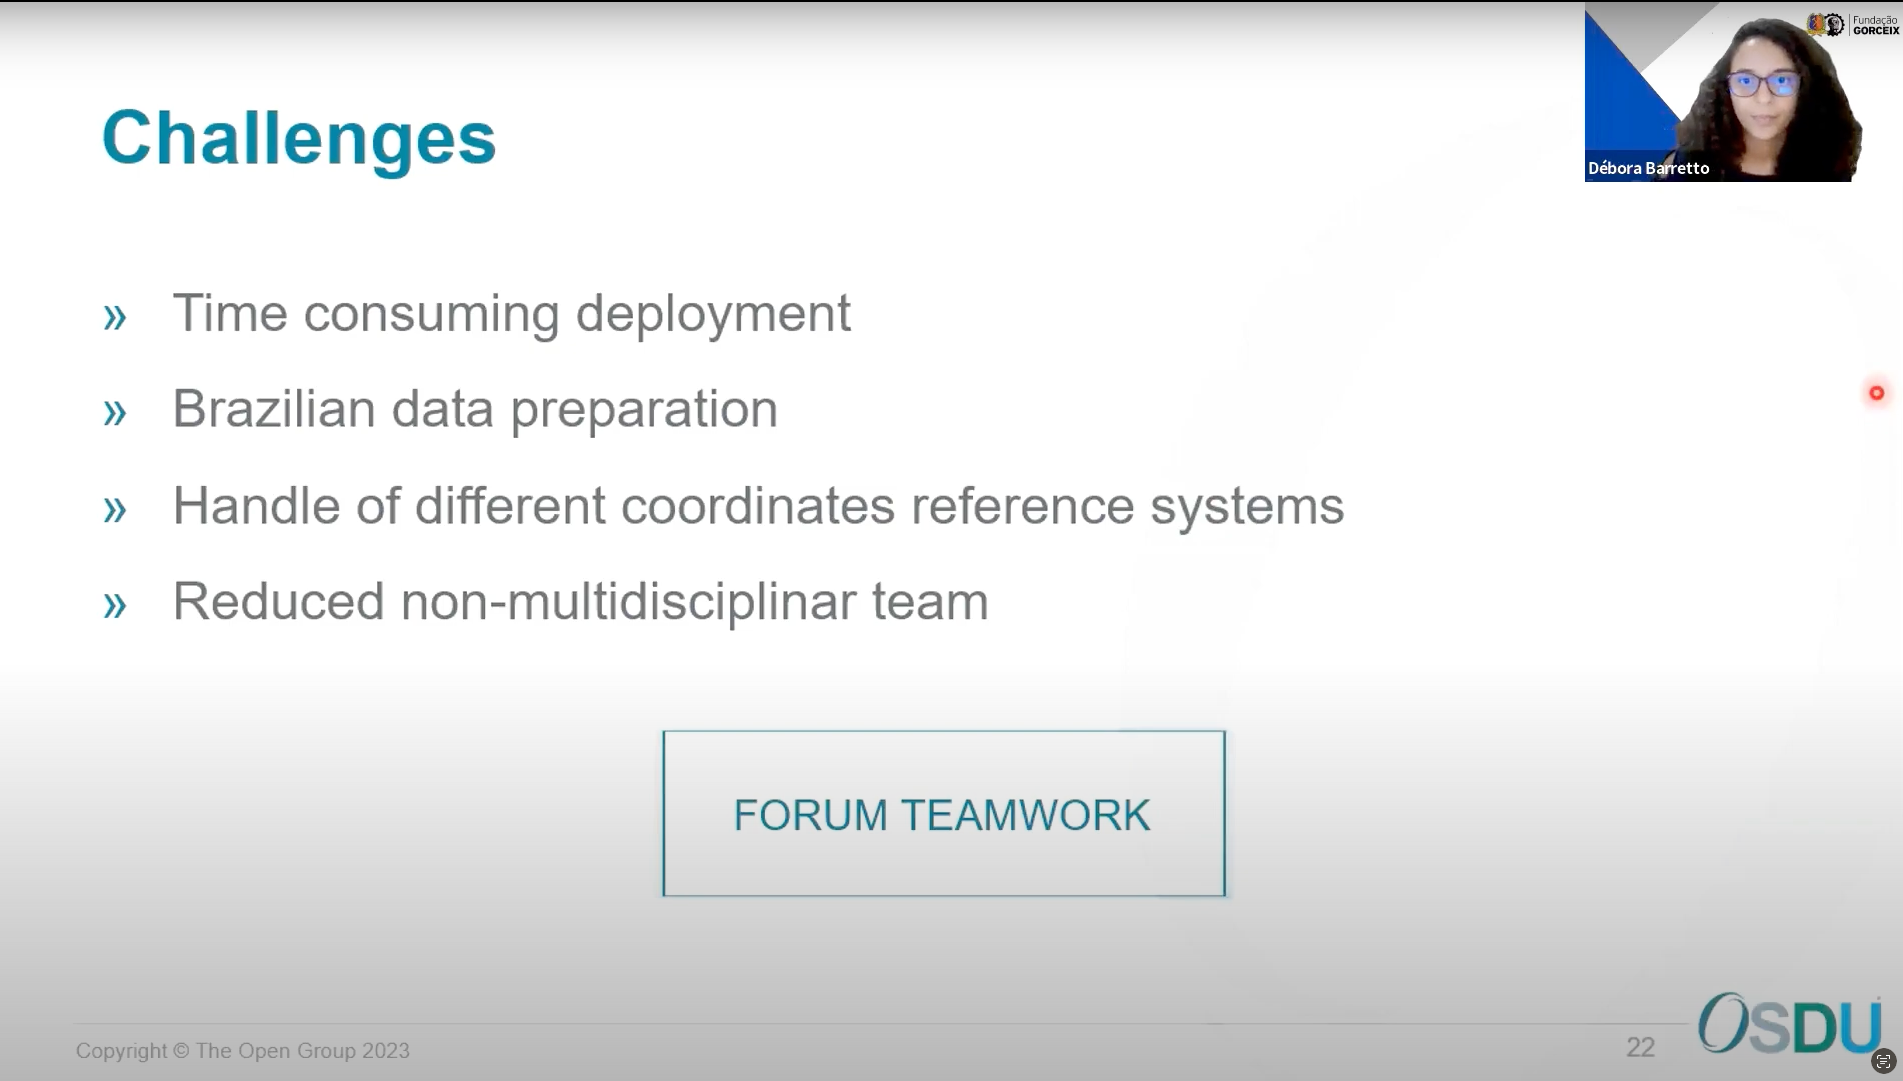
Navigating the Transition from On-Premise to Cloud

While cloud adoption is a driving force in digital transformation, not every company can make a complete jump immediately. Local regulations, connectivity limitations, and data residency requirements can create concrete roadblocks to full cloud migration and, consequently, OSDU Data Platform adoption. 

Fortunately, the Cloud Provider and ISV OSDU community are actively exploring various solutions to address these challenges and offer flexible deployment options. One such example is deploying IVAAP on IBM Red Hat OpenShift, which allows for a robust on-premise alternative to a full cloud solution. IVAAP supports on-premise deployments natively, whether for the standard or the OSDU configuration. 

Once the on-premise concerns are addressed, transitioning efficiently is crucial to avoid unnecessary costs. A hybrid solution connects both on-premise and cloud data sources and offers a flexible approach. Data aggregation and co-visualization become key components of this transition, allowing operators to harness the benefits of cloud infrastructure while maintaining their on-premise systems during the migration.

Challenges in the OSDU Business Model

Creating a healthy ecosystem of buyers and sellers within OSDU is essential for its long-term success. Increased adoption leads to deeper expertise and better utilization. To achieve this, operators must transition from proof of concept (POC) stages into production. 

Encouraging operators to invest in sharing their expertise, domain knowledge, experiences, and requirements, along with co-financing initiatives, is crucial for building a thriving OSDU ecosystem. In the same way that the energy transition cannot just rely on operators but requires the contribution of consumers and governing bodies, the OSDU transition cannot rely just on the R&D backbone of ISVs (Independent Software Vendors). 

The past four years have taught us valuable lessons about liberating data. There is plenty more to do, learn, and share amongst this very smart and dedicated community. This is an exciting time to be in this industry and shaping its future. 

From an INT perspective, one challenge we commonly encounter is that visualization is often thought of only at the end of the process. Thinking about consuming the data at the end of a very linear process represents significant risks such as poor user adoption, missed data, and delays, jeopardizing the business value of adopting OSDU. 

We have observed that the most successful projects integrate user experience, data search, and visualization early on alongside core workstreams like data infrastructure, definition, and ingestion. Each workstream even used data visualization as a core function to test the quality of their activity and maximize its success. 

Encouraging ISVs and Solution Creators

Finally, driving the participation of ISVs and solution creators in building for OSDU is vital. Operators can play a significant role by encouraging ISVs to design more open systems rather than relying on proprietary technology. This openness facilitates collaboration and accelerates the transition towards OSDU adoption.

Navigating OSDU deployments requires a strategic approach that addresses legacy systems, data mapping, and cloud migration complexities. By leveraging tools like IVAAP and fostering a collaborative spirit among operators, ISVs, and solution creators, the oil and gas industry can unlock the full value of OSDU: a more efficient and interconnected future.

Visit us online at int.com/ivaap for a preview of IVAAP or for a demo of INT’s other data visualization products. 

For more information, please visit int.flywheelstaging.com or contact us at intinfo@int.com.


Filed Under: IVAAP, Products Tagged With: AWS, Azure, DELFI, gcp, IMB, ivaap, OpenShift, OSDU

Jan 18 2024

Fundação Gorceix OSDU® Implementation: Experience, Challengers and the Road Ahead.

In our recent webinar, we had the privilege of featuring Débora Ribeiro Barretto, Geophysicist, and OSDU® Focal Point, who shared insights into their OSDU® implementation journey. Titled “Fundação Gorceix OSDU Implementation: Experience, Challenges, and the Road Ahead,” the session delved into the Foundation’s objectives, accomplishments, and the evolving role they envision within the OSDU Forum.

Fundação Gorceix: Pioneering Innovation in Brazil

Fundação Gorceix, a Brazilian institution dedicated to technology and science, operates at the forefront of mining, environment, and oil and gas sectors. The Department of Petroleum Geology, a key arm of the Foundation, is committed to evaluating Brazil’s oil potential. Managing geophysical data through the RDG (Rede de Dados Geofisicos), a sophisticated infrastructure, Fundação Gorceix optimizes communication among partner companies and operators in Brazil’s oil and gas sector.

OSDU Implementation: Transforming Workflows with AWS Cloud

Fundação Gorceix’s primary objective focuses on enhancing geophysical and geological data workflows through the OSDU Data Platform in the AWS cloud. A streamlined workflow illustrated the transition from on-premise data handling to a robust OSDU and AWS infrastructure. This transformation promises a more efficient process involving data ingestion into the OSDU Data Platform and consumption via the INT IVAAP platform.

Screenshot 2024-01-04 at 1.00.19 PM

The introduction of a virtual data room, facilitated by OSDU, emerged as a game-changer, providing global, secure access and ensuring legal and compliance entitlements. 

A glimpse of successfully ingested Brazilian data highlighted the platform’s capabilities in managing diverse datasets.

v3 FINAL INT Simplifies Machine Learning and Processing and Augments Analytics Capabilities with Latest Release of IVAAP Data Visualization Platform

For each project, some selected seismic and well data and other relevant streaming data will be available in IVAAP.

v3 FINAL INT Simplifies Machine Learning and Processing and Augments Analytics Capabilities with Latest Release of IVAAP Data Visualization Platform (2)

Example of ingested Brazilian seismic data

A Journey of Challenges and Triumphs

A candid exploration of the challenges encountered during Fundação Gorceix’s OSDU journey underscored the importance of dedicated teams and strategic focus. Issues with deployment time and operational functionality were met with resilience and a commitment to improvement. The transition to a fully dedicated team in the second semester of the first year proved pivotal, leading to a functional M11 release and the inaugural ingestion of Brazilian well and seismic data.

Screenshot 2024-01-04 at 2.05.48 PM

Shaping the Future: Automation and Collaboration

Transitioning to the forward-looking aspect of Fundação Gorceix’s OSDU journey, the organization redirected its focus to validating and enhancing seismic data ingestion in 2023. The incorporation of automation tools, engagement with other softwares, and active participation in forum groups showcased a commitment to continuous improvement. Looking ahead to 2024, the objective is to activate a virtual room with the OSDU Data Platform and IVAAP, presenting partners with seamlessly ingested data for consumption.

v3 FINAL INT Simplifies Machine Learning and Processing and Augments Analytics Capabilities with Latest Release of IVAAP Data Visualization Platform (3)

Fundação Gorceix, through its dedicated efforts and collaboration with the OSDU Forum community, partners, INT, IesBrazil, and AWS, made significant contributions to surmounting the intricate challenges of this transformative process. Their involvement included addressing time-consuming deployment, preparing Brazilian seismic data, navigating diverse coordinate reference systems, and overcoming the obstacles a lean, non-multidisciplinary team posed. 

Collaborative Success: A Call to Contribute

The presentation wrapped up with a compelling message — The OSDU Forum is not designed solely for its members; rather, it is formed collaboratively by the engaged participants within the community. The call for engagement and collaboration resonated profoundly, emphasizing the importance of collective contribution. Fundação Gorceix eagerly anticipates operating the OSDU virtual data room in the near future, reciprocating the support received by contributing to the community.

In embracing the journey of Fundação Gorceix, it becomes evident that challenges are inherent to innovation. With teamwork, resilience, and a collaborative spirit, shared success becomes an achievable and rewarding endeavor. The OSDU Data Platform stands as a testament to the strength derived from collaborative efforts to establish a platform for shared knowledge and mutual support.

Watch the on-demand webinar here to dive deeper into Fundação Gorceix’s OSDU journey.

Visit us online at int.com/ivaap for a preview of IVAAP or for a demo of INT’s other data visualization products. 

For more information, please visit int.flywheelstaging.com or contact us at intinfo@int.com.

____________

ABOUT INT

INT software empowers energy companies to visualize their complex data (geoscience, well, surface reservoir, equipment in 2D/3D). INT offers a visualization platform (IVAAP) and libraries (GeoToolkit) that developers can use with their data ecosystem to deliver subsurface solutions (Exploration, Drilling, Production). INT’s powerful HTML5/JavaScript technology can be used for data aggregation, API services, and high-performance visualization of G&G and energy data in a browser. INT simplifies complex subsurface data visualization.

INT, the INT logo, and IVAAP are trademarks of Interactive Network Technologies, Inc., in the United States and/or other countries.


Filed Under: IVAAP, Products Tagged With: AWS, ivaap, OSDU

Nov 30 2021

INT Achieves AWS Energy Competency Status

This announcement highlights INT as an AWS Partner with deep industry expertise and follows a rigorous technical validation process and customer reference audit.

INT announced today that it has achieved Amazon Web Services (AWS) Energy Competency status. This designation recognizes that INT has demonstrated deep expertise helping customers leverage AWS cloud technology to transform complex systems and accelerate the transition to a sustainable energy future.

Achieving the AWS Energy Competency differentiates INT as an AWS Partner with deep expertise and technical proficiency within this unique industry, including proven customer success developing solutions across the value chain, from production operations and optimization to new energy solutions, and more.

To receive the designation, AWS Partners undergo a rigorous technical validation process, including a customer reference audit. The AWS Energy Competency provides energy customers the ability to more easily select skilled Partners to help accelerate their digital transformations with confidence.


“INT is extremely proud to achieve the AWS Energy Competency designation,” said Olivier Lhemann, President at INT. “Our team is dedicated to helping our customers accelerate their transformation to the cloud by leveraging our platform, IVAAP, which offers complex subsurface visualization, dashboarding, and collaboration capabilities—all accessed seamlessly in the cloud with AWS.”


AWS is enabling scalable, flexible, and cost-effective solutions from startups to global enterprises. To support the seamless integration and deployment of these solutions, AWS established the AWS Competency Program to help customers identify AWS Partners with deep industry experience and expertise.

INT helps energy companies accelerate the development of energy digital solutions by embedding complex data visuals with IVAAP visualization platform in the cloud. INT works closely with over 100 energy companies such as TGS, a provider of a diverse range of Energy Data for more than 40 years.


“Our partnership with INT and the integration of IVAAP with our ecommerce/cloud platform allowed us to greatly reduce our time to market while delivering robust visualization tools that our clients wanted,” said Jim Burke, Software Development Manager at TGS. “Now, our clients can not only visualize log data, but they can also perform analytics—all on AWS.”


Filed Under: IVAAP Tagged With: AWS, energy, ivaap

Mar 24 2021

INT Supports The Open Group OSDU™ Forum Mercury Release with Advanced Domain Data Visualization in the Cloud

As a long-standing OSDU Forum Member, INT has worked closely with the OSDU development teams to ensure seamless integration of IVAAP visualization of OSDU data on all major cloud providers.

Houston, TX – March 24, 2021 – INT is pleased to announce our partnership with The Open Group OSDU™ Forum as part of the new Mercury Release. INT’s flagship data visualization platform, IVAAP, offers a unique way for operators to search, explore, interact with, and automate their data on OSDU in a single platform in the cloud. 

Developed by The Open Group OSDU™ Forum, the OSDU Data Platform is an Open Source, standards-based and technology-agnostic data platform for the energy industry that stimulates innovation, industrializes data management, and reduces time to market for new solutions.

For companies adopting OSDU, IVAAP is a powerful, fast, and cost-effective alternative to custom building an application or assembling multiple components to visualize domain data. INT partners with all major cloud providers that support OSDU — AWS, Microsoft Azure, Google Cloud Platform, and RedHat OpenShift by IBM. And it includes multiple customization options, including an SDK to provide a complete, end-to-end visualization solution.


Olivier Lhemann, founder and president of INT, explains: “As more energy companies transition their data and workflows to the cloud, it’s more important than ever to have a common data standard. Our work with OSDU is critical to helping companies solve the challenge of interoperability, of viewing their data from a single application, eliminating silos and liberating workflows. IVAAP is a universal cloud viewer that significantly reduces time to market and accelerates the adoption of innovative technologies.”


To learn more about IVAAP and how it works with OSDU, visit INT.com/IVAAP.

Read the full press release on PRWeb.

About INT:

INT software empowers the energy companies to visualize their complex data (seismic, well log, reservoir, and schematics in 2D/3D). INT offers a visualization platform (IVAAP) and libraries (GeoToolkit) that developers can use with their data ecosystem to deliver subsurface solutions (Exploration, Drilling, Production). INT’s powerful HTML5/JavaScript technology can be used for data aggregation, API services, high-performance visualization of G&G and petrophysical data in a browser. INT simplifies complex subsurface data visualization.

About The Open Group

The Open Group is a global consortium that enables the achievement of business objectives through technology standards. Our diverse membership of more than 800 organizations includes customers, systems and solutions suppliers, tool vendors, integrators, academics, and consultants across multiple industries. For more information, visit www.opengroup.org.

INT, the INT logo, and IVAAP are trademarks of Interactive Network Technologies, Inc., in the United States and/or other countries.


Open Subsurface Data Universe™ and OSDU™ are trademarks of The Open Group.

Filed Under: IVAAP, Press Release Tagged With: AWS, cloud, IBM, ivaap, Microsoft, open group, OSDU

Nov 20 2020

A New Era in O&G: Critical Components of Bringing Subsurface Data to the Cloud

The oil and gas industry is historically one of the first industries generating actionable data in the modern sense. For example, the first seismic imaging was done in 1932 by John Karcher.


first-seismic
Seismic dataset in 1932.


Since that first primitive image, seismic data has been digitized and has grown exponentially in size. It is usually represented in monolith data sets which may span in size from a couple of gigabytes to petabytes if pre-stack. 

seismic-faults
Seismic datasets today.


The long history, large amount of data, and the nature of the data pose unique challenges that often make it difficult to take advantage of advancing cloud technology. Here is a high-level overview of the challenges of working with oil and gas data and some possible solutions to help companies take advantage of the latest cloud technologies. 

Problems with Current Data Management Systems

Oil and Gas companies are truly global companies, and the data is often distributed among multiple disconnected systems in multiple locations. This not only makes it difficult to find and retrieve data when necessary but also makes it difficult to know what data is available and how useful it is. This often requires person-to-person communication, and some data may even be in offline systems or on someone’s desk.

The glue between those systems is data managers who are amazing at what they do but still introduce a human factor to the process. They have to understand which dataset is being requested, then search for it on various systems, and finally deliver it to the original requester. How much does this process take? You guessed it—way too much! And in the end, the requester may realize that it’s not the data they were hoping to get, and the whole process is back to square one.

After the interpretation and exploration process, decisions are usually made on the basis of data screenshots and cherry-picked views, which limit the ability of specialists to make informed decisions. Making bad decisions based on incomplete or limited data can be very expensive. This problem would not exist if the data was easily accessible in real-time. 

And that doesn’t even factor in collaboration between teams and countries. 

How can O&G and service companies manage
their massive subsurface datasets better
by leveraging modern cloud technologies?

3 Key Components of Subsurface Data Lake Implementation

There are three critical components of a successful subsurface data lake implementation: a strong cloud infrastructure, a common data standard, and robust analysis and visualization capabilities. 


3-key-components


AWS: Massive Cloud Architecture

While IVAAP is compatible with any cloud provider—along with on-premise and hybrid installations—AWS offers a strong distributed cloud infrastructure, reliable storage, compute, and more than 150 other services to empower cloud workflows. 

OSDU: Standardizing Data for the Cloud

The OSDU Forum is an Energy Industry Forum formed to establish an open subsurface Reference Architecture, including a cloud-native subsurface data platform reference architecture, with usable implementations for major cloud providers. It includes Application Standards (APIs) to ensure that all applications (microservices), developed by various parties, can run on any OSDU data platform, and it leverages Industry Data Standards for frictionless integration and data access. The goal of OSDU is to bring all existing formats and standards under one umbrella which can be used by everyone, while still supporting legacy applications and workflows. 

IVAAP: Empowering Data Visualization

A data visualization and analysis platform such as IVAAP, which is the third key component to a successful data lake implementation, provides industry-leading tools for data discovery, visualization, and collaboration. IVAAP also offers integrations with various Machine Learning and artificial intelligence workflows, enabling novel ways of working with data in the cloud.

ivaap-benefits


Modern Visualization — The Front End to Your Data

To visualize seismic data, as well as other types of data, in the cloud, INT has developed a native web visualization platform called IVAAP. IVAAP consists of a front-end client application as well as a backend. The backend takes care of accessing, reading, and preparing data for visualization. The client application provides a set of widgets and UI components empowering search, visualization, and collaboration for its users. The data reading and other low-level functions are abstracted from the client by a Domain API, and work through connector microservices on the backend. To provide support for a new data type, you only need to create a new connector. Both parts provide an SDK for developers, and some other perks as well. 

Compute Close to Your Data

Once the data is in the cloud, a variety of services become available. For example, one of them is ElasticSearch from AWS, which helps index the data and provides a search interface. Another service that becomes available is AWS EC2, which provides compute resources that are as distributed as the data is. That’s where IVAAP gets installed.

One of the cloud computing principles is that data has a lot of gravity and all the computing parts tend to get closer to it. This means that it is better to place the processing computer as close to the data as possible. With AWS EC2, we at INT can place our back end very close to the data, regardless of where it is in the world, minimizing latency for the user and enabling on-demand access. Elastic compute resources also enable us to scale up when the usage increases and down when fewer users are active.


AWS-INT

All of this works together to make your data on-demand—when the data needs to be presented, all the tools and technologies mentioned above come into play, visualizing the necessary data in minutes, or even seconds, with IVAAP dashboards and templates. And of course, the entire setup is secure on every level. 

Empower Search and Discovery

The next step is to make use of this data. And to do so, we need to provide users a way to discover it. What should be made searchable, how to set up a search, and how to expose the search to the users? 

Since searching through numerical values of the data won’t provide a lot of discovery potential, we need some additional metadata. This metadata is extracted along with the data and also uploaded to the cloud. All of it or a subset of metadata is then indexed using AWS Elasticsearch. IVAAP uses an Elasticsearch connector to the search, as well as tools to invoke the search through an interactive map interface or filter forms presented to the user.

How can you optimize web performance of massive domain datasets?

Visualizing Seismic Datasets on the Web

There are two very different approaches to visualizing data. One is to do it on the server and send rendered images to the client. This process lacks interactivity, which limits the decisions that can be made from those views. The other option is to send data to the client and visualize it on the user’s machine. IVAAP implements either approach. 

While the preferred method—sending data to the client’s machine—provides limitless interactivity and responsiveness of the visuals, it also poses a special challenge: the data is just too big. Transferring terabytes of data from the server to the user would mean serious problems. So how do we solve this challenge? 

First, it is important to understand that not all the data is always visible. We can calculate which part of the data is visible on the user’s screen at any given moment and only request that part. Some of the newer data formats are designed to operate with such reads and provide ways to do chunk reads out of the box. A lot of legacy data formats—for example, SEG-Y—are often unstructured. To properly calculate and read the location of the desired chunk, we need to first have a map—called an Index—that is used to calculate the offset and the size of chunks to be read. Even then, the data might still be too large. 

Luckily, we don’t always need the whole resolution. If a user’s screen is 3,000 pixels wide, they won’t be able to display all 6,000 traces, so we can then adaptively decrease the number of traces to provide for optimal performance.

reduce-pixels

Often the chunks which we read are in different places in the file, making it necessary to do multiple reads at the same time. Luckily, both S3 storage and IVAAP support such behavior. We can fire off thousands of requests in parallel, maximizing the efficiency of the network. Live it to the full, as some people like to say. And even then, once the traces are picked and ready to ship, we do some vectorized compression before shipping the data to the client. 

We were talking about legacy file formats here, but it’s worth mentioning that GPU compression is also available for newer file formats like VDS/OpenVDS and ZGY/OpenZGY. It’s worth mentioning that the newer formats provide perks like brick storage format, random access patterns, adaptive level of detail, and more.

Once the data reaches the client, JavaScript and Web Assembly technologies come together to decompress the data. The data is then presented to the user using the same technologies through some beautiful widgets, providing interactivity and a lot of control. From there, building a dashboard—drilling, production monitoring, exploration, etc.—with live data takes minutes.

All the mentioned processes are automated and require minimal human management. With all the work mentioned above, we enable a user to search for the data of interest, add it to desired visualization widgets (multiple are available for each type of data), and display on their screen with a set of interactive tools to manipulate the visuals. All within minutes, and while being in their home office. 

That’s not all—a user can save the visualizations and data states into a dashboard and share it with their colleagues sitting on a different continent, who can then open the exact same view in a matter of minutes. With more teams working remotely, this seamless collaboration helps facilitate collaboration and reduce data redundancy and errors. 

dash

Data Security

How do we keep this data secure? There are two layers of authentication and authorization implemented in such a system. First, AWS S3 has identity-based access guarantees that data can be visible to only authorized requests. IVAAP uses OAuth2 integrated with AWS Cognito to authenticate the user and authorize the requests. The user logs into the application and gets a couple of tokens that allow them to communicate with IVAAP services. The client passes tokens back to the IVAAP server. In the back end, IVAAP validates the same tokens with AWS Cognito whenever data reads need to happen. When validated, a new, temporary signed access token is issued by S3, which IVAAP uses to make the read from the file in a bucket.

Takeaways

Moving to the cloud isn’t a very simple task and poses a lot of challenges. By using technology provided by AWS and INT’s IVAAP and underlined by OSDU data standardization, we can create a low-latency data QC and visualization system which puts all the data into one place, provides tools to search for data of interest, enables real-time on-demand access to the data from any location with the Internet, and does all that in a secure manner.

For more information on IVAAP, please visit int.com/ivaap/ or to learn more about how INT works with AWS to facilitate subsurface data visualization, check out our webinar, “A New Era in O&G: Critical Components of Bringing Subsurface Data to the Cloud.”


Filed Under: IVAAP Tagged With: AWS, cloud, data visualization, digital transformation, ivaap, subsurface data visualization

  • Page 1
  • Page 2
  • Go to Next Page »

Footer

Solutions

  • Real-Time Visualization
  • Visualization Components
  • New Energy Visualization
  • OSDU Visualization
  • Machine Learning
  • Developer Tools
  • Cloud Partners
  • Customer Success Stories

Products

  • IVAAP
  • GeoToolkit
  • INTViewer
  • IVAAP Demos
  • GeoToolkit Demos

About

  • News
  • Events
  • Careers
  • Management Team

Resources

  • Blog
  • FAQ

Support

  • JIRA
  • Developer Community

Contact

INT logo
© 1989–2024 Interactive Network Technologies, Inc.
Privacy Policy
  • Careers
  • Contact Us
  • Search

COPYRIGHT © 2025 INTERACTIVE NETWORK TECHNOLOGIES, Inc