• Skip to main content
  • Skip to footer

INT

Empowering Visualization

COMMUNITY BLOG
CONTACT US SUPPORT
MENUMENU
  • Solutions
    • Overview
    • Real-Time Visualization
    • Visualization Components
    • New Energy Visualization
    • OSDU Visualization
    • Machine Learning
    • Developer Tools
    • Cloud Partners
  • Products
    • IVAAP™
          • SOLUTIONS

            Real-Time Visualization

            OSDU Visualization

            Visualization Components

            New Energy Visualization

            Upstream Data Visualization

          • SUCCESS STORIES

            WEATHERFORD
            Well delivery optimization software

            BARDASZ
            Data management, data quality monitoring

            ANPG / SATEC-MIAPIA
            Virtual data room

            MAILLANCE
            High-performance visualization of ML algorithms

            SEE ALL >

          • SUPPORT

            DEVELOPER COMMUNITY
            Join or log in to the INT Developer Community.

            GET SUPPORT
            Log a ticket for an issue or bug.

            CONTACT US

          • DEMOS

            IVAAP DEMOS
            Cloud-Based Demos

            FIRST TIME HERE?
            Register to access our
            IVAAP demos

    • GeoToolkit™
          • SUCCESS STORIES

            CAYROS
            Field development planning

            TOTALENERGIES
            High-performance large dataset reservoir rendering

            IFP ENERGIES NOUVELLES
            Seismic and structural interpretation validation

            SEE ALL >

          • SUPPORT

            DEVELOPER COMMUNITY
            Join or log in to the INT Developer Community.

            GET SUPPORT
            Log a ticket for an issue or bug.

            CONTACT US

          • DEMOS

            GEOTOOLKIT DEMOS
            Geoscience Demos

    • INTViewer™
          • SUCCESS STORIES

            STRYDE
            Fast seismic QA/QC in the field

            SILVERTHORNE SEISMIC
            Efficient 2D/3D seismic data delivery

            WIRELESS SEISMIC
            Drones, IoT, and Advanced Onsite Seismic Data Validation

            SEE ALL >

          • SUPPORT

            GET SUPPORT
            Log a ticket for an issue or bug.

            CONTACT US

          • PLUG-INS

            EXTEND INTVIEWER
            More than 65 plugins available

  • Demos
    • GeoToolkit Demos
    • IVAAP Demos
  • Success Stories
  • Resources
    • Blog
    • Developer Community
    • FAQ
    • INT Resources Library
  • About
    • Overview
    • News
    • Events
    • Careers
    • Meet Our Team
    • About INT

cloud

Aug 10 2023

INT Simplifies Machine Learning and Processing and Augments Analytics Capabilities with Latest Release of IVAAP Data Visualization Platform

The latest release of IVAAP by INT introduces an array of exciting new features and enhancements, providing users with unparalleled capabilities to extract deeper insights from their subsurface data.

Houston, TX — August 10, 2023 — INT announced today the launch of IVAAP™ 2.11, the latest version of our Universal Cloud Data Visualization Platform. With powerful features and enhanced capabilities, IVAAP™ 2.11 takes subsurface data exploration and visualization to new heights, empowering users to make critical decisions with confidence and efficiency.

Some of the key highlights include: 

  1. External Workflows to Support Machine Learning and Data Processing: With IVAAP™ 2.11, users can now seamlessly integrate external processing workflows and ML capabilities, unlocking the true potential of their data through advanced analytics and data automation.
  2. Unit System Management: IVAAP™ introduces Unit System Management, offering users enhanced control over data consistency and clarity by efficiently managing unit conversions.
  3. WellLog Enhancements: WellLog module sees significant improvements, including support for stacked patterns curve, curve editing, lithology editing, and discrete raster files.
  4. Dynamic Range Intervals: Selected depth intervals can be highlighted in multiple widgets like cross-plot, pie charts, histograms, and more. Moving intervals along the depth are reflected automatically across all widgets.
  5. OSDU™ Data Platform Compatibility: IVAAP now offers full support for perforation intervals, stratigraphic columns, well-core images, hole sections, and collections on the OSDU Data Platform. Additionally, KPIs are now available on the IVAAP Home page.

“IVAAP 2.11 represents a significant milestone in our journey towards providing the oil and gas industry with the most advanced and comprehensive data visualization platform. With the introduction of external workflow support for machine learning and data processing and full compatibility with the OSDU Data Platform, IVAAP continues to empower geoscientists and engineers to explore, visualize, and automate their data like never before,” said Hugues Thevoux, VP of Cloud Solutions at INT. “This release underscores our commitment to delivering cutting-edge solutions that drive efficiency, foster innovation, and enable our clients to make smarter decisions with confidence.”


IVAAP 2.11 is now available for all existing users. To experience the power of IVAAP or to schedule a personalized demo, visit int.com/demo-gallery/ivaap/ or contact our sales team at intinfo@int.com.

To learn more about IVAAP 2.11, please visit int.com/products/ivaap/ or contact us at intinfo@int.com.

Read the IVAAP 2.11 Release Notes.
Read the press release on PRWeb.

____________

ABOUT IVAAP:

IVAAP™ is a Universal Cloud Data Visualization Platform where users can explore domain data, visualize 2D/3D G&G data (wells, seismic, horizons, surface), and perform data automation by integrating with external processing workflows and ML.

ABOUT INT:

INT software empowers the largest energy and services companies in the world to visualize their complex subsurface data (seismic, well log, reservoir, and schematics in 2D/3D). INT offers a visualization platform (IVAAP) and libraries (GeoToolkit) developers can use with their data ecosystem to deliver subsurface solutions (Exploration, Drilling, Production). INT’s powerful HTML5/JavaScript technology can be used for data aggregation, API services, and high-performance visualization of G&G and petrophysical data in a browser. INT simplifies complex subsurface data visualization.

For more information about IVAAP or INT’s other data visualization products, please visit https://int.flywheelstaging.com.

INT, the INT logo, and GeoToolkit are trademarks of Interactive Network Technologies, Inc., in the United States and/or other countries.
Filed Under: IVAAP, Press Release, Uncategorized Tagged With: cloud, Data Processing, data visualization, ivaap, machine learning, ml, OSDU, welllog

Jan 26 2022

Raster Log and TIFF Rendering in the Cloud with GeoToolkit.JS

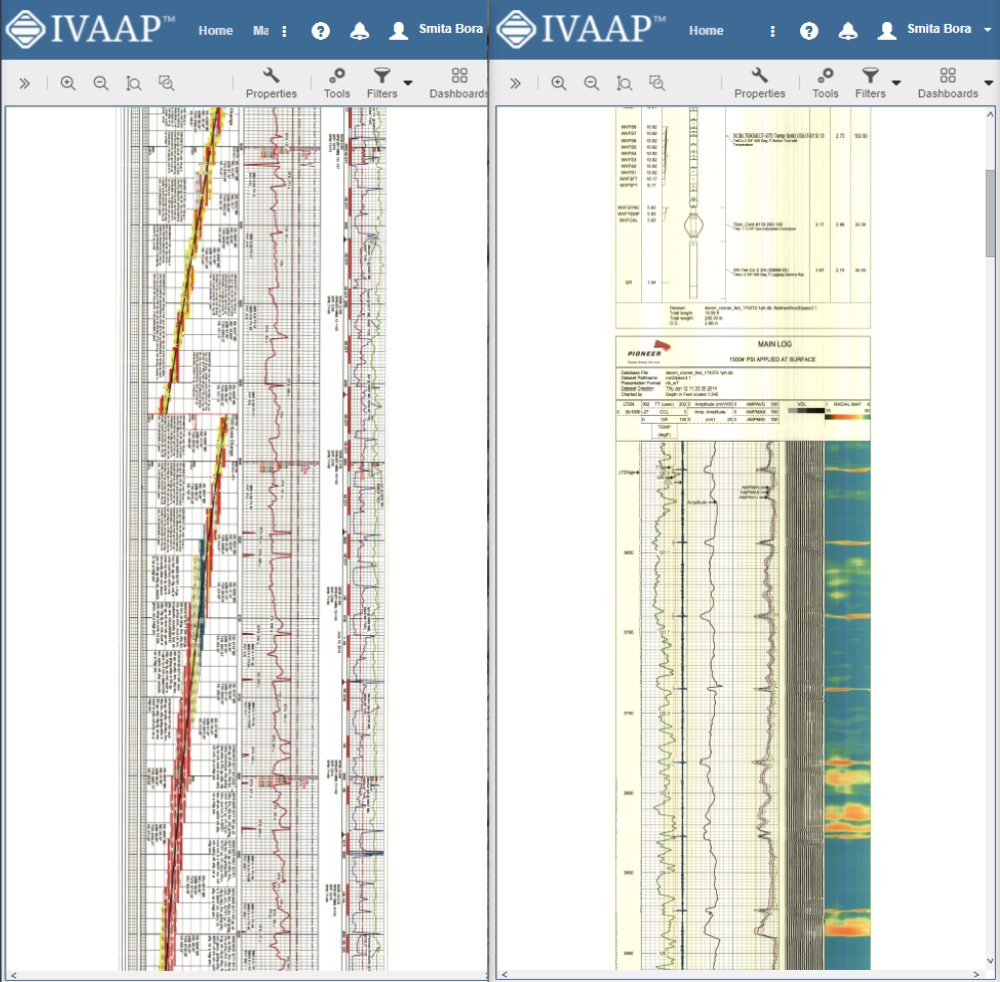
A common challenge that our users face is a need to render and display huge images like raster logs and GeoTIFF files. Interactions occur in the client’s server architecture, and while these images can be stored in the cloud or on a server, they are usually very large files, making it difficult to move from the server to the client. It is also time-consuming to read data from the cloud and unpack operations for TIFFs.

When trying to open these files, the user may have to wait up to several minutes to start to receive data from the server. This can lead to a poor user experience because the client doesn’t know if a server is working or if it’s already halted the solution that we applied. So we wanted to improve this for our users.


Reducing Calculation Complexity

In order to optimize several areas for the client as well as on the server, we decided to focus on the server data loading from cloud storage and enhance the unpacking of TIFFs. We found a way to minimize the number of requests from client to server and pass more calculations from server to client, reducing the calculation complexity on the server.

So, how did we do it? On the client side, we have a class called tiled shape which requests tiles from the server.

raster 1

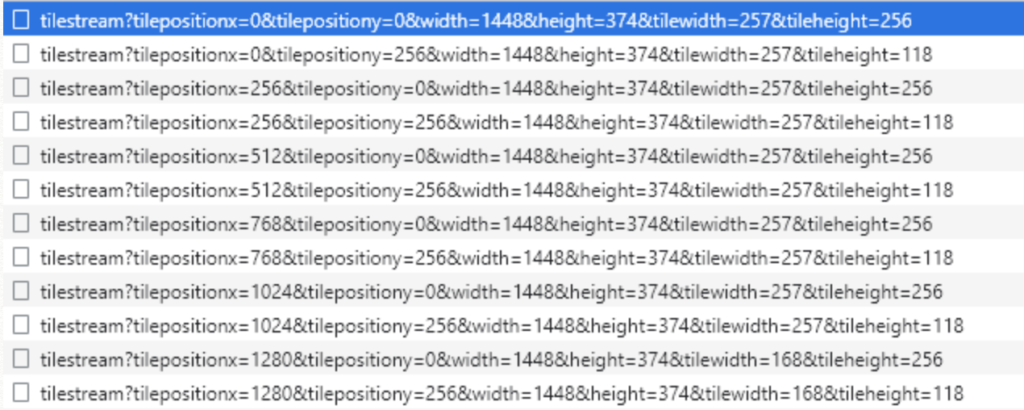
For each tile, the client requests its X and Y position, height, and scaling. In the past, when a user would interact with an image and send a request to the server, requesting new tiles, it would be too much for the server to handle, causing even more delays.

To minimize the impact this request has on the server, we decided to check if the  user stops interaction by timer. After any interaction on the client’s side with the image, we start a timer. Before the timer is up, if no requests are sent from the client to the server, this timer finishes quickly and the image loads. This allows us to minimize the number of requests from client to server.

Calculation and Caching

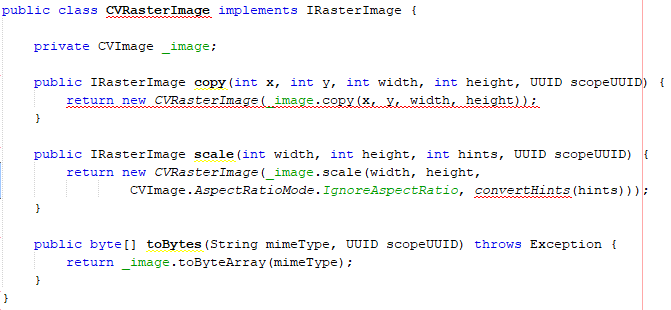
Another feature we optimized is the ability to pass information from the server to plan calculations for the correct tile position and correct tile transformation. By passing the data from server to client, the client calculates the correct position for tile on each side. We also use a cache of tiles on the client side to ensure that we do not request the same tiles. Image cache on a server side is also possible, but after the first request, it is necessary to download the requested image from the cloud, unpack the image, and then start to copy and scale the requested tile to convert this image.


Unpacking the Image

On the server side, we implemented TIFF unpacking on a highly performing native implementation. This is a multithreaded and thread safe solution., which allows us to deal with several requests from clients at the same time. As a result, a large TIFF image file can be stored in the cloud without a problem and an unpacking time of less than four seconds compared to the previous solution’s 60 seconds. We also optimized the cloud access speed on the server side by renting a high-performance AWS instance with high-speed access to AWS cloud storage. This allows us to download the whole TIFF image from the cloud in less than three seconds, making the download speeds about 800 megabytes per second.


raster2

Faster Rasters

As a result, we spend around three seconds to download the image from cloud storage and about four seconds to unpack the image. So it only takes roughly seven seconds to download, unpack the image, deal with client requests, scale the requested tiles, and send them back to the client as opposed to having to wait several minutes to possibly hours for the same process.  Overall, this process greatly improves the user experience.

The new raster logs and cloud TIFF rendering are just one of the many new features and improvements from the latest GeoToolkit.JS 2021.1 release.

To learn more about GeoToolkit.JS 2021, please visit int.com/products/geotoolkit/or contact us at support@int.com.


Filed Under: GeoToolkit, Uncategorized Tagged With: cloud, geotiff, raster, TIFF

Dec 08 2021

Latest Release of INT’s GeoToolkit.JS Brings More Advanced Features to Develop the Next Generation of Energy Applications

The GeoToolkit.JS 2021.1 release innovation includes new Live Code Sandbox, new features in Schematics and Seismic libraries, and optimized display of 3D Reservoir in a web browser.

Houston, TX — INT’s latest release of GeoToolkit.JS data visualization libraries and toolkit integrates many new features, including new live code sandbox, 3D reservoir optimization, schematics customization capabilities, faster TIFF and raster log rendering, time series customization, and more.

With the new live code playground, developers can work with GeoToolkit code in real time, instantly testing their customizations and iterating quickly to fine-tune functionality.

Developers can use the new dual schematics widget which shows/compares two states of schematics in GeoToolkit.JS to implement more complex visualizations, such as planned versus actual drilling. And features like the added horizon intersection for seismic time slice add a layer of context to seismic visualization.

INT is constantly looking at improving performance, adding new functionality, and helping developers enhance the UX experience. But INT is not limiting its technology to the client side. For large datasets, like seismic, reservoir, or big images, the visualization and the web services are tightly coupled so that only a minimum amount of data is sent based on the viewport and the LOD (Level Of Detail).


“We work closely with our users to understand and incorporate their needs within our products. With this GeoToolkit release, we delivered more features and improvements that will further expand our users’ capabilities so they have what they need to customize, build, and deliver their advanced web-based, exploration, drilling and production applications,” said Dr. Olivier Lhemann, President of INT.


GeoToolkit.JS 2021.1 also includes capabilities such as improved TypeScript headers, generation and API reverence, revisited reports generation, and more.

RELEASE HIGHLIGHTS:

  • Live code sandbox — Run tutorials in live code sandbox to test functionality
  • Raster Logs and Cloud TIFF Rendering — Server downloads image from cloud, unpacks TIFF image, copy and scale requested tile, convert image to byte array, send bytes array
  • 3D Reservoir Optimization and Intersection with Seismic — Optimized reservoir grid with anti-aliasing and improved reservoir performances by filtering cells by IJK/value and neighbor occlusion, intersection of reservoir grid with seismic, and improved seismic intersection points performance and fix interpolation color
  • Time Series Styles and Customization — Added barchart mode to TimeSeriesWidget and improved auto limits calculation for TimeSeriesWidget
  • Creating PDF Reports with Multiple Widgets — New set of tutorials, CSS support to Document and DocumentViewWidget, virtual DOM
Widgets integration, added text alignment in cell, added page header/footer support, CSS Pseudo-classes, CSS borders, CSS margins

For more information about GeoToolkit.JS or INT’s other data visualization products, please visit int.flywheelstaging.com or contact us at intinfo@int.com.

Read the press release on PRWeb.

To learn more about GeoToolkit.JS 2021, please visit int.com/products/geotoolkit/ or contact us at support@int.com.

____________

ABOUT INT:

INT software empowers the largest energy and services companies in the world to visualize their complex subsurface data (seismic, well log, reservoir, and schematics in 2D/3D). INT offers a visualization platform (IVAAP) and libraries (GeoToolkit) developers can use with their data ecosystem to deliver subsurface solutions (Exploration, Drilling, Production). INT’s powerful HTML5/JavaScript technology can be used for data aggregation, API services, and high-performance visualization of G&G and petrophysical data in a browser. INT simplifies complex subsurface data visualization.

For more information about GeoToolkit or INT’s other data visualization products, please visit https://int.flywheelstaging.com.

INT, the INT logo, and GeoToolkit are trademarks of Interactive Network Technologies, Inc., in the United States and/or other countries.
Filed Under: GeoToolkit, GeoToolkit (Geoscience), JavaScript, Press Release Tagged With: cloud, energy, oil and gas, subsurface data visualization, time series

May 20 2021

Deploying IVAAP Services to Google App Engine

One of the productivity features of the IVAAP Data Backend SDK is that the services developed with this SDK are container-agnostic. Practically, it means that a REST service developed on your PC using your favorite IDE and deployed locally to Apache Tomcat will run without changes on IVAAP’s Play cluster.

While the Data Backend SDK is traditionally used to serve data, it is also a good candidate when it comes to developing non-data-related services. For example, as part of IVAAP 2.8, we worked on a gridding service. In a nutshell, this service computes a grid surface based upon the positions of a top across the wells of a project. When we tested this service, we didn’t deploy it to IVAAP’s cluster; it was deployed as a standalone application, as a servlet, on a virtual machine (VM).

Deploying Apache Tomcat on a virtual machine is “old school”. Our customers are rapidly moving to the cloud, and while VMs are often a practical choice, other options are sometimes available. One of these options is Google App Engine. Google App Engine is a bit of a pioneer of cloud-based deployments. It was the first product that allowed servlet deployments that scale automatically, without having to worry about the underlying infrastructure of virtual machines. This “infinite” scalability comes with quite a few constraints, and I was curious to find out whether services developed with the IVAAP Data Backend SDK could live within these constraints (spoiler alert: it can).

Synchronous Servlet Support

The first constraint was the lack of support for asynchronous servlets. Google App Engine doesn’t support asynchronous servlets and the IVAAP servlet shipped with the SDK is strictly asynchronous. Supporting the synchronous requirements of Google App Engine didn’t take much time. The main change was to modify the concrete implementation of
com.interactive.ivaap.server.servlets.async.AbstractServiceRequest.waitForResponse
and wait on a java.util.concurrent.CountDownLatch instead of calling javax.servlet.startAsync().

Local File Access

The second constraint was the lack of a local file system. Google App Engine doesn’t let developers access the local files of the virtual machine where an application is deployed. The IVAAP Data Backend SDK typically doesn’t make much use of the local file system, except at startup when it reads its service configuration. To authorize users, the services developed with the IVAAP Data Backend SDK need to know how to validate Bearer tokens, and this validation requires the knowledge of the host name of the IVAAP Admin Backend. The Admin Backend exposes REST services for the validation of Bearer tokens. To support Google App Engine, I had to make the discovery of these configuration files pluggable so that they can be read from the WEB-INF directory of the servlet instead of a directory external to that servlet.

Persistence Mechanism

The third constraint was the lack of persistence. Google App Engine doesn’t provide a way to “remember” information between two HTTP calls. To effectively support computing services, a REST API cannot make an HTTP client “wait” for the completion of this computing. The computation might take minutes, even hours. The REST API of a computing service has to give a “ticket” number back to the client when a process starts, and provide a way for this client to observe the progress of that ticket, all the way to the completion. In a typical servlet deployment, there are many options to achieve this: the service can use the Java Heap to store the ticket information or use a database. To achieve the same result with Google App Engine, I needed to pick a persistence mechanism. For simplicity’s sake, I picked Google Cloud Storage. The state of each ticket is stored as a file in that storage. 

Background Task Executions

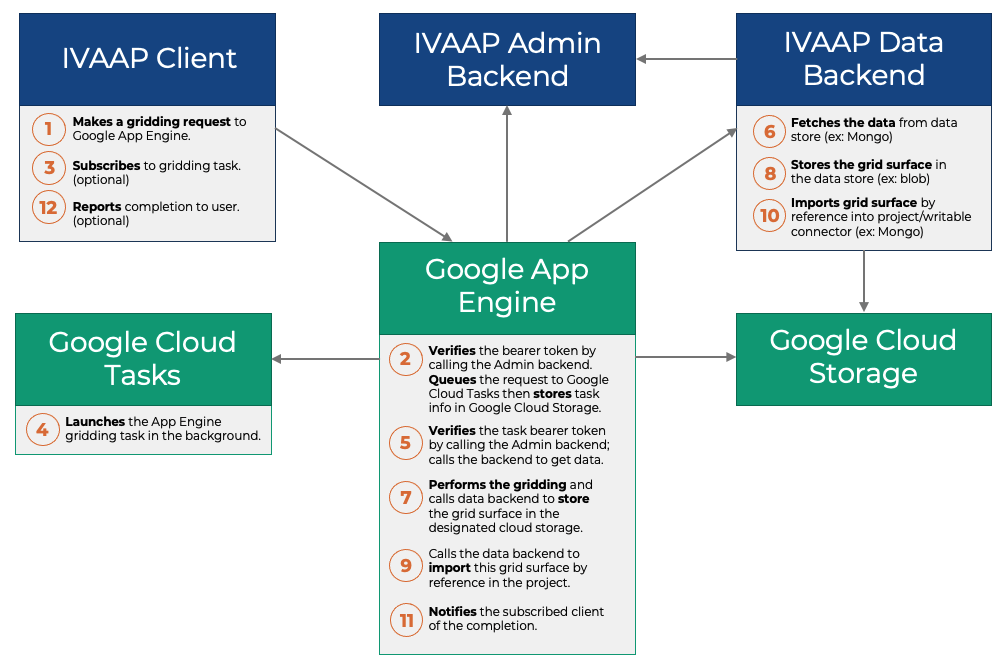
The fourth constraint was the lack of support for background executions. Google App Engine by itself doesn’t allow processes to execute in the background. Google however provides integration with another product called Google Cloud Tasks. Using the Google Cloud Tasks API, you can submit HTTP requests to a queue, and Google Cloud Tasks will make sure these requests get executed eventually. Essentially, when the gridding service receives an HTTP request, it creates a ticket number, submits this HTTP request immediately to Google Cloud Tasks, which in turn calls back Google App Engine. The IVAAP service recognizes that the call comes from Google Cloud Tasks and stores the result to a file in Google Cloud Storage instead of the servlet output stream. It then notifies the client that the process has completed.

Here’s a diagram that describes the complete workflow: 

INT_GCP_Workflow

Constraints and Considerations

While the SDK did provide the API to implement this workflow out of the box, getting this to work took a bit of time. I had to learn 3 Google products at once to get it working. Also, I encountered obstacles that I will share here so that other developers benefit:

  1. The first obstacle was that the Java SDK for Google App Engine requires the Eclipse IDE. There is no support for the NetBeans IDE. I am more proficient with NetBeans.
  2. The second obstacle was that I had to register my Eclipse IDE with Google so I can deploy code from that environment. It just happened that that day, the Google registration server was having issues, blocking me from making progress.
  3. The third obstacle was the use of Java 8. The Google Cloud SDK required Java 8, but Eclipse defaulted to Java 11. It took me a while to understand the arcane error messages thrown at me.
  4. The fourth obstacle was that I had to pick a flavor of Google App Engine, either “Standard” or “Flexible”. The “Standard” option is cheaper to run because it doesn’t require an instance running at all times. The “Flexible” option has less warmup time because there is always at least one instance running. There are many more differences, not all of them well documented. The two options are similar, but do not share the same API. You don’t write the same code for both environments. In the end, I picked the “Standard” option because it was the most constraining, better suited to a proof of concept.
  5. The fifth obstacle was the confusion due to the word “Promote” used by the Google SDK when deploying an instance. In this context, “Promote” doesn’t mean “advertising”, it means “production”. For a while, I couldn’t figure out why my application wouldn’t show any changes where I expected them. The answer was that I didn’t “promote” them.
  6. The last obstacle was the logging system. Google has a “Google Logging” product to access logs produced by your application. Logging is essential to debugging unruly code that you can’t run locally. Despite several weeks of use, I still haven’t figured out how this product really works. It is designed to be used to monitor an application in production, not so much for debugging. Debugging with logs is difficult. There might be several reasons why you can’t find a log. The first possibility is that the code doesn’t go where you think it’s going, and the log is not produced. The second possibility is that the log was produced, but I am too impatient, there is a significant delay and it hasn’t shown up yet. The third possibility is that it has shown up, but is nested inside some obscure hierarchy, and you won’t see it unless you expand the entire tree of logs. The log search doesn’t help much and has some strange UI quirks. I found that the most practical way to explore logs is to download them locally, then use the search capabilities of a text editor. Because the running servlet is not local to your development environment, debugging a Google App Engine application is a time-consuming activity.

In the end, the IVAAP Data Backend SDK passed this proof of concept with flying colors. Despite the constraints and obstacles of the environment, all the REST services that were written with the IVAAP Cluster in mind are compatible with Google App Engine, without any changes. Programming is hard, it’s an investment in time and resources. Developing with the IVAAP Data Backend SDK preserves your investment because it makes a minimum amount of assumptions on how and where you will run this code.

For more information or for a free demo of IVAAP, visit int.com/products/ivaap/.


Filed Under: IVAAP Tagged With: API, cloud, Google, Google App Engine, ivaap, SDK

May 11 2021

IVAAP Data Visualization Platform Unlocks the Power of Energy Data with New Connector for Machine Learning and Processing Services

Rapidly connect IVAAP to ANY processing service or model to give end-users instant control over input/output, execution, and visualization of their data science.

Houston, TX — May 11, 2021 —INT is pleased to announce the newest release of its enterprise data visualization platform, IVAAP™ 2.8. This release includes new, game-changing machine learning capabilities utilizing IVAAP’s services-based architecture to quickly plug new processes and workflows into IVAAP’s data visualization admin. 

As energy companies are in the process of ingesting data and migrating to the cloud to empower search and work with their energy data, one key piece — leveraging machine learning and processing — becomes even more important to help them automate their workflows. 

IVAAP can now connect to any machine learning or processing service, allowing users to execute a complete, end-to-end workflow all in one platform. For data scientists, this means they can easily connect the dots — they can consume data, trigger and execute processing or machine learning models in a simple way, and visualize the results of their data science quickly. Once complete, the workflow can write the results back to the selected cloud storage and the output can be visualized instantly. 

Product owners can offer their end users a robust, web-based platform with a dynamic UI leveraging self-describing JSON technology to generate dialogs on the fly without a costly rebuild or time-intensive redeploy. These model dialogs mean users can select relevant data and parameters, start processing, and visualize the process output, all in one platform. 


“Machine learning and AI are at the forefront of the current data revolution, so it was important for us to explore and create new ways to interact with data science and deliver intuitive user experience that developers can easily build,” said Hugues Thevoux-Chabuel, Vice President, Cloud Solutions at INT. “Many of our clients have asked how to easily connect to their existing models and programs to consume their data without having these services hard-coded and difficult to invoke and maintain.”


This IVAAP release also features a new basemap widget, a reporting widget, improvements to IVAAP’s schematics display, including new 2D deviated schematics plus additional visualization in 3D, such as perforations, casing, casing shoe, and tubing. IVAAP supports integration with all major cloud providers — AWS, Microsoft Azure, Google Cloud Platform, and IBM — and supports on-premise installations. 

IVAAP is an upstream visualization platform that enables search and visualization of energy, geophysical and production data in the cloud. It allows product owners, developers, and architects to rapidly build next-level subsurface digital solutions anywhere without having to start from scratch. 

Read the press release on PRWeb.

For more information, please visit int.flywheelstaging.com or contact us at intinfo@int.com.

Visit us online at int.com/ivaap for a preview of IVAAP or for a demo of INT’s other data visualization products. 


____________

ABOUT INT:

INT software empowers the largest energy and services companies in the world to visualize their complex subsurface data (seismic, well log, reservoir, and schematics in 2D/3D). INT offers a visualization platform (IVAAP) and libraries (GeoToolkit) developers can use with their data ecosystem to deliver subsurface solutions (Exploration, Drilling, Production). INT’s powerful HTML5/JavaScript technology can be used for data aggregation, API services, and high-performance visualization of G&G and petrophysical data in a browser. INT simplifies complex subsurface data visualization.

For more information about IVAAP or INT’s other data visualization products, please visit https://int.flywheelstaging.com.

INT, the INT logo, and IVAAP are trademarks of Interactive Network Technologies, Inc., in the United States and/or other countries.
Filed Under: IVAAP, Press Release Tagged With: cloud, connector, energy, machine learning, subsurface data visualization

  • Page 1
  • Page 2
  • Page 3
  • Page 4
  • Go to Next Page »

Footer

Solutions

  • Real-Time Visualization
  • Visualization Components
  • New Energy Visualization
  • OSDU Visualization
  • Machine Learning
  • Developer Tools
  • Cloud Partners
  • Customer Success Stories

Products

  • IVAAP
  • GeoToolkit
  • INTViewer
  • IVAAP Demos
  • GeoToolkit Demos

About

  • News
  • Events
  • Careers
  • Management Team

Resources

  • Blog
  • FAQ

Support

  • JIRA
  • Developer Community

Contact

INT logo
© 1989–2024 Interactive Network Technologies, Inc.
Privacy Policy
  • Careers
  • Contact Us
  • Search

COPYRIGHT © 2025 INTERACTIVE NETWORK TECHNOLOGIES, Inc