• Skip to main content
  • Skip to footer

INT

Empowering Visualization

COMMUNITY BLOG
CONTACT US SUPPORT
MENUMENU
  • Solutions
    • Overview
    • Real-Time Visualization
    • Visualization Components
    • New Energy Visualization
    • OSDU Visualization
    • Machine Learning
    • Developer Tools
    • Cloud Partners
  • Products
    • IVAAP™
          • SOLUTIONS

            Real-Time Visualization

            OSDU Visualization

            Visualization Components

            New Energy Visualization

            Upstream Data Visualization

          • SUCCESS STORIES

            WEATHERFORD
            Well delivery optimization software

            BARDASZ
            Data management, data quality monitoring

            ANPG / SATEC-MIAPIA
            Virtual data room

            MAILLANCE
            High-performance visualization of ML algorithms

            SEE ALL >

          • SUPPORT

            DEVELOPER COMMUNITY
            Join or log in to the INT Developer Community.

            GET SUPPORT
            Log a ticket for an issue or bug.

            CONTACT US

          • DEMOS

            IVAAP DEMOS
            Cloud-Based Demos

            FIRST TIME HERE?
            Register to access our
            IVAAP demos

    • GeoToolkit™
          • SUCCESS STORIES

            CAYROS
            Field development planning

            TOTALENERGIES
            High-performance large dataset reservoir rendering

            IFP ENERGIES NOUVELLES
            Seismic and structural interpretation validation

            SEE ALL >

          • SUPPORT

            DEVELOPER COMMUNITY
            Join or log in to the INT Developer Community.

            GET SUPPORT
            Log a ticket for an issue or bug.

            CONTACT US

          • DEMOS

            GEOTOOLKIT DEMOS
            Geoscience Demos

    • INTViewer™
          • SUCCESS STORIES

            STRYDE
            Fast seismic QA/QC in the field

            SILVERTHORNE SEISMIC
            Efficient 2D/3D seismic data delivery

            WIRELESS SEISMIC
            Drones, IoT, and Advanced Onsite Seismic Data Validation

            SEE ALL >

          • SUPPORT

            GET SUPPORT
            Log a ticket for an issue or bug.

            CONTACT US

          • PLUG-INS

            EXTEND INTVIEWER
            More than 65 plugins available

  • Demos
    • GeoToolkit Demos
    • IVAAP Demos
  • Success Stories
  • Resources
    • Blog
    • Developer Community
    • FAQ
    • INT Resources Library
  • About
    • Overview
    • News
    • Events
    • Careers
    • Meet Our Team
    • About INT

cloud

Jun 02 2020

INT Brings OpenVDS Java Binding to the OSDU Community

Recently, INT announced our partnership with Bluware and our integration of Bluware’s OpenVDS format into IVAAP, our enterprise data visualization platform. We are very excited about this partnership, as well as our collaboration with OSDU. This new format was designed to empower users to browse seismic data in the cloud with high performance and lower cost.

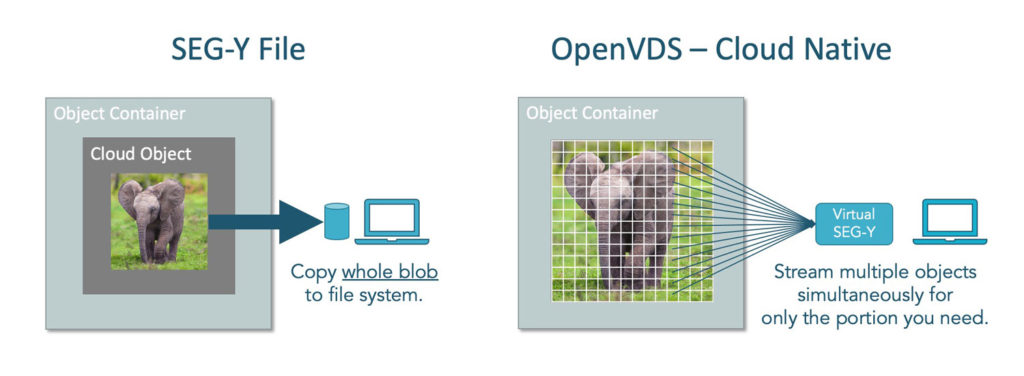
If you are not familiar with its capabilities: OpenVDS is a cloud-native way to store seismic data in the cloud. Unlike SEG-Y, which is linear, OpenVDS data is broken into small objects and stored in the cloud object store to provide very fast access to any part of the data. OpenVDS is serverless and supports any type of seismic data, including pre-stack.

Here’s an example of how seismic data can be stored in the cloud:
seismic-data-cloud
Graphic courtesy of Bluware Corp.


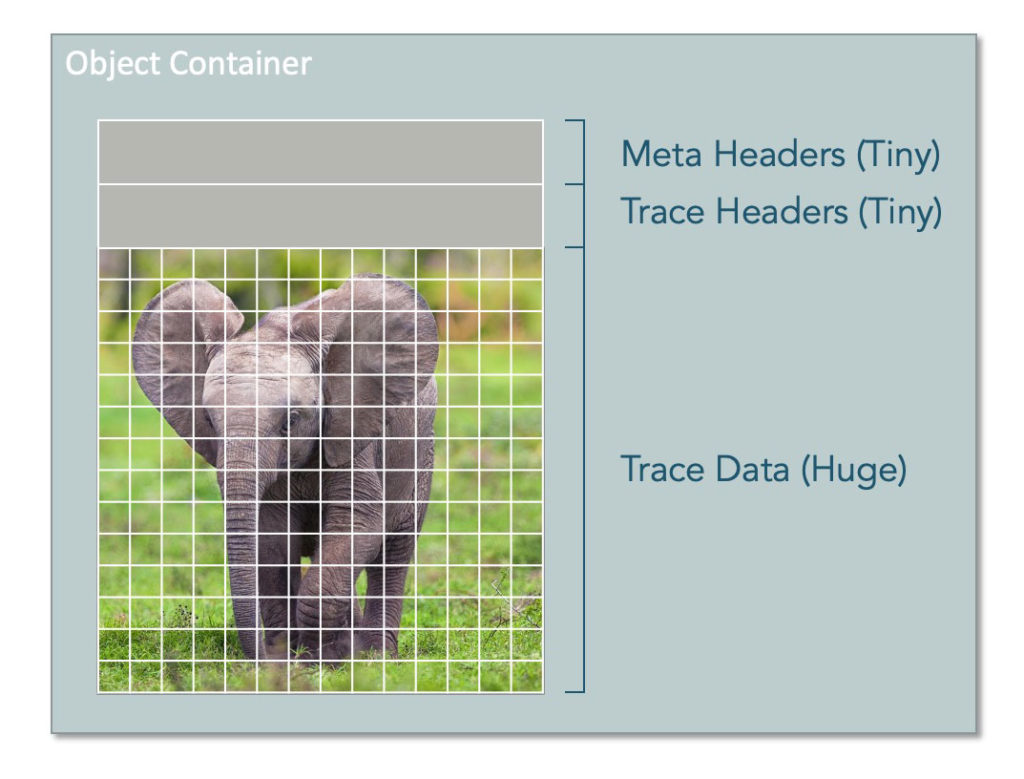
But with OpenVDS, you have the option to store headers in the hot tier and trace data in the cold or cool tier (to restore as needed).
openvds-anatomy
Graphic courtesy of Bluware Corp.
 

Through our process of integrating this format, we realized that we could offer a bit more functionality to help more users adopt OpenVDS by offering also a JAVA binding option. Here’s a timeline of our process:

Late March 2020

After completing the VDS integration into IVAAP, we started work on OpenVDS compatibility.

Unfortunately, there was no Java binding for OpenVDS at the time. With Java being the most popular platform for complex web application backends, it seemed it would be profitable to all if the OpenVDS technology was easily usable in these environments.

Thus, we decided to bring our expertise to the community and started working on an open-source Java binding.

April 2020

Our expert team worked on the binding. After testing different approaches, we decided to avoid automatic binding technologies (Swig, …) and to write the JNI code manually.

This decision would allow us to ensure finer control over memory management, allowing us to reduce the cost of memory transfers between Java and native C++ worlds.

We also paid particular attention to the stability and error management since this library is to be used in server backends with huge uptimes.

May 18, 2020

We’re done! We are proud to announce that the work of our experts has been accepted and merged into the OpenVDS repository.

A special thank you to Bluware for their support and to Roman Matyaschuk, Ilia Mikhailichenko, and Camille Perin with INT for making this a success story.

For more information on IVAAP, please visit int.flywheelstaging.com/products/ivaap/

Filed Under: IVAAP Tagged With: Bluware, cloud, ivaap, openVDS, OSDU, seismic data

Jan 31 2020

What Is Kubernetes?: An Introduction and Overview of the Popular Platform

Over the last several years, Kubernetes has been a developing trend in the tech world, gaining popularity as more and more companies begin to take advantage of cloud-based services. As a non-developer living in a developer world, I wanted to understand more about why we develop our software to work with Kubernetes. So I sat down with INT’s Senior Product Manager Steven Reynolds and Senior Architect James Velasco to learn more about Kubernetes and the advantages of working with it.

Christin: So, Steven, tell me — what in the world is Kubernetes??

Steven: Kubernetes is described as an orchestration platform. It’s usually associated with getting big software up and running. For example, with some of our clients, we have our build set up so that all of the software assets are pushed out and deployed using Kubernetes which takes care of monitoring (pods). If a pod fails, Kubernetes will restart it, and it has nice hooks that can spin up new pods if there’s too much work for one pod to handle.

Christin: What are the advantages of using Kubernetes?

James: Traditionally, you have a service provided by a server. If you migrated, changed, or updated the service, there would be a lot of work to change or configure, set up the new server providing it, and with cloud and cloud providers like AWS, they are moving to automating things. So instead of manually going in and doing all of it, you have tools to automate updating an old version, and switching over to the new one automatically.

Christin: The term microservices is used with Kubernetes — can you go into what microservices does?

James: Microservices is an architectural trend happening right now. Instead of having one big server running everything for a web service, you may have that same web service decomposed into little servers that do separate, well defined parts.

Steven: So the idea of Kubernetes and microservice are different concepts, but they’re talked about together. When using a microservice architecture, it’s an advantage, but it’s also a headache to keep track of all the components.

Christin: So when is it best to use Kubernetes?

Steven: We have 15 to 20 services, and it’s a headache to manage, but you can use Kubernetes to help organize it and help it be more manageable for human beings. There are trade-offs because it makes it better to manage, but there are many tradeoffs as in anything else. It’s the engineer’s dilemma.

James: It tends to only be an advantage if you’re managing a lot of services. So if you’re just managing one or two, then it’s iffy. But if you’re managing 10+ or even just 4 or 5 and those 4 or 5 are made up of 10 or 15 subparts, that is when it makes sense. If I divided all my services like that I may have 10 or 20 and then you may have other vendors or services and you can literally have 100 to 200 of these things. You have to swap out in a unique order and all need to come up and down and all need to be monitored, so that’s what Kubernetes helps you do. Kubernetes is also great to scale up or down.

Christin: That’s really cool. So, Steven mentioned that we have built projects to run on Kubernetes. Does that mean IVAAP can be supported on Kubernetes if requested?

James: Kubernetes is one of the environments that IVAAP targets, if a client requests it. It’s important that we do support it because it is one of the modern deployment styles. And it is common that clients use IVAAP running on Kubernetes. Some clients use Azure or AWS so we have to make sure we can run in all different environments.

******

So there you have it. As a growing trend in software development, Kubernetes can be a better way for companies to deploy and maintain software quickly, especially in a cloud environment. For INT, supporting Kubernetes is an important aspect of how we help meet the needs of our many diverse clients. For more information on IVAAP, check out int.com/ivaap or schedule a demo with one of our team.


Filed Under: IVAAP Tagged With: AWS, Azure, cloud, ivaap, microservices

May 17 2018

What Cloud Data Lakes Mean for Geoscience

With the explosion of storage capacity, cloud computing, and bandwidth availability, a trend has emerged in the oil and gas industry over the last few years. Data that was previously aggregated and discarded is now maintained and stored, creating an opportunity for the industry. Coupled with new advancements in machine learning and Al, this data availability is poised to drive more data driven decision making in well planning, drilling & completions, and well operations.

After our conversations with major operators over the last few months, we realized that the concept of a data lake is still pretty new and can be perceived differently. We thought this would be a great opportunity to explain what this technology approach is and its benefits and how major operators can leverage INT’s enterprise data visualization platform to help garner insights from geoscience data in the cloud.

What is a Data Lake?

The idea behind a data lake is that as businesses gather more data, this data cannot be used the same way it has been used in the past. Databases are not a good fit for big data, not just because of the size of that data but also because this data cannot be normalized. A Data Lake is a large storage of raw data where each data point is stored in its native format, along with relevant metadata.

This approach solves a problem that the oil and gas industry has faced for a long time. Despite industry efforts to standardize data formats, these formats are loosely followed and too limited to contain all information related to a particular seismic survey or an oil field. Keeping the data as is makes your job of extracting valuable information difficult. And if you opt to normalize that data, you inevitably lose information. The concept of Data Lake opens the possibility of both keeping your original data while allowing its exploitation.

How do you exploit data from a Data Lake?

When you add files to your Lake, you carry along these files’ relevant metadata. When the right set of metadata is provided, you can search your data from this set. For example, if each document is geo-referenced, you can search for all documents relative to a geographical area.

How is the concept of Data Lake different from a search engine?

Search engines can’t really exploit files in SEG-Y or LAS formats. And even for well-known formats such as PDF, search engines have no awareness of which attributes of a PDF file are important to you. For example, if your metadata indicates that a file documents the characteristics of a well at a particular location, a Data Lake will allow you to find this file just by selecting the right region of interest.

How are cloud providers helping with Data Lakes?

Microsoft Azure, Amazon Web Services, and Google Cloud have developed a wide range of products and components to facilitate the creation and use of data lakes, such as nearly infinite storage, artificial intelligence, and machine learning to provide a seamless way to ingest and consume your data. The technology behind such advanced indexing and analytics cannot be reproduced in-house—you need a world-class partner.

How is INT helping with Data Lakes?

INT helps in two ways: We have unique experience in the industry. Working with so many actors, we have acquired the knowledge required to read multiple data formats, even when these formats are not strictly followed. Our tools facilitate the extraction of the metadata required for the Lake to function as intended, and not as a “swamp.”

And, of course, our visualization technology is what makes it all possible, all from the comfort of your browser. Our IVAAP Enterprise Cloud Viewer allows you to visualize the datasets and documents stored remotely in your Data Lake. You’ll see how you can start from a map and drill down all the way down to the log curves of a well found on that map. In the same screen, you’ll be able to review PDF reports for that well and navigate through the slices of the matching seismic survey as if it was stored locally.

For more information about our enterprise data visualization solutions, visit the IVAAP product page, or contact us.


Filed Under: IVAAP Tagged With: cloud, data lake, geoscience, ivaap

Dec 01 2017

How to Improve Performance and Reduce Latency of Your Geoscience Data

Storing and accessing large, sometimes sensitive geoscience data is one challenge many top E&P companies face.

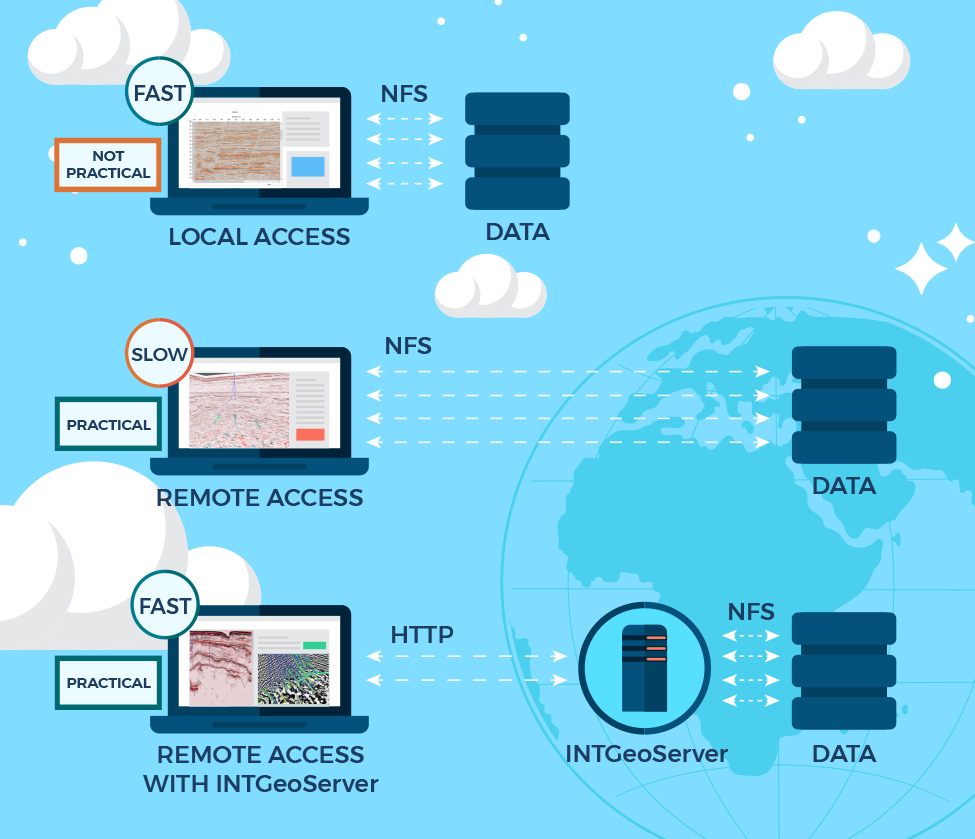
Local access is great, but not every user in the world can have local access to the same data. Replication is an option, but with the size of seismic datasets reaching terabytes, this is not practical. In the real world, users only have access to a limited set of local data.

Common Solution Leads to Performance Issues

Many companies store data all over the world. The common infrastructure to allow ubiquitous access to data is to share these files using NFS, a well-known distributed file system protocol used by Linux-based servers.

The issue with NFS is that it is a “chatty” protocol: Many messages are sent back and forth between the client and the server. This is fine when all machines are physically close to each other, but the further away they get, the more latency you introduce. As a result, performance degrades.

NFS is also essentially transparent to the software using it. Some software, like INTViewer, doesn’t “know” that your data is remote, so it can’t optimize its data fetching strategy to the characteristics of your infrastructure. Actually, for seismic data, it assumes that access to individual traces is fast.

A Better Option

This is where INTGeoServer comes into play. Access to data hosted on INTGeoServer—a server with a modern architecture that uses web services to stream geoscience data—is optimized so that there is a limited number of back-and-forth messages. In other words, by installing INTGeoServer next to your data, you make this data accessible from remote places as if it were local.

INTGeoServerNFSGraphic2

To visualize any geoscience file in INTViewer, simply drag and drop that file from the file system to INTViewer’s main window and its content appears automatically. From this experience, it might seem that INTViewer is tied to the file system where it resides, meaning it can only read data from that file system. While this is a common use case, using INTGeoServer removes the requirement to have INTViewer and your data on the same file system.

From an INTViewer user point-of-view, the protocol used to access the data doesn’t change the interaction—the visualizations are the same, the analysis tools work the same way. From a system administrator point of view, however, the burden of maintaining worldwide NFS shares is lifted. And the benefit of accessing that data in larger chunks is that the performance profile improves substantially.

For more information about INTViewer and INTGeoServer, visit the INTViewer product page, or contact us for a free trial.


Filed Under: Uncategorized Tagged With: cloud, data storage, INTGeoServer, INTViewer

Jul 27 2017

Accessing INTViewer Remotely

In our blog post on Microsoft Azure, we describe various ways customers can move their data to the cloud. In the configuration where INTViewer is hosted on a remote server and needs to be accessed from a local workstation, a Teradici client is one solution.

These configurations are increasingly popular with our customers. For performance reasons, it makes sense to host INTViewer next to your data. But this data tends to be large and hosted in remote data centers.

Teradici is not the only software we have tested with INTViewer. Other softwares allow such remote access. The minimum sophistication of remote access software depends on what you plan to do with INTViewer. If you only plan to visualize data in 2D, most software will work off the shelf. On Linux, a well-known solution built into the operating system is to use X11 forwarding. On Windows, there are various free software solutions widely available such Microsoft Remote Desktop Connection (bundled with Windows) and VNC.

If you need to display your data in 3D or if you need cross-plotting, these widely available solutions won’t work. In many cases, users will encounter an annoying “Can’t display 3D window” or “Can’t display cross-plot” message. INTViewer uses OpenGL to render cross-plot and 3D visualization, and this technology imposes specific requirements. INTViewer requires OpenGL v3 or greater, and most classic solutions only support OpenGL v2.

As a result, in addition to Teradici, INTViewer has been tested with commercial software such as HP RGS. INTViewer has also been tested with VirtualGL. VirtualGL is open source so there is no cost to download and set up the product. Another product some clients have used is called ThinLinc by Cendio. ThinLinc is not an open-source product, but they offer a limited trial version.

If you need assistance setting up your remote desktop environment, contact us at support@int.com for help.


Filed Under: INTViewer Tagged With: cloud, INTViewer, Microsoft, remote, teradici

  • « Go to Previous Page
  • Page 1
  • Page 2
  • Page 3
  • Page 4
  • Go to Next Page »

Footer

Solutions

  • Real-Time Visualization
  • Visualization Components
  • New Energy Visualization
  • OSDU Visualization
  • Machine Learning
  • Developer Tools
  • Cloud Partners
  • Customer Success Stories

Products

  • IVAAP
  • GeoToolkit
  • INTViewer
  • IVAAP Demos
  • GeoToolkit Demos

About

  • News
  • Events
  • Careers
  • Management Team

Resources

  • Blog
  • FAQ

Support

  • JIRA
  • Developer Community

Contact

INT logo
© 1989–2024 Interactive Network Technologies, Inc.
Privacy Policy
  • Careers
  • Contact Us
  • Search

COPYRIGHT © 2025 INTERACTIVE NETWORK TECHNOLOGIES, Inc