• Skip to main content
  • Skip to footer

INT

Empowering Visualization

COMMUNITY BLOG
CONTACT US SUPPORT
MENUMENU
  • Solutions
    • Overview
    • Real-Time Visualization
    • Visualization Components
    • New Energy Visualization
    • OSDU Visualization
    • Machine Learning
    • Developer Tools
    • Cloud Partners
  • Products
    • IVAAP™
          • SOLUTIONS

            Real-Time Visualization

            OSDU Visualization

            Visualization Components

            New Energy Visualization

            Upstream Data Visualization

          • SUCCESS STORIES

            WEATHERFORD
            Well delivery optimization software

            BARDASZ
            Data management, data quality monitoring

            ANPG / SATEC-MIAPIA
            Virtual data room

            MAILLANCE
            High-performance visualization of ML algorithms

            SEE ALL >

          • SUPPORT

            DEVELOPER COMMUNITY
            Join or log in to the INT Developer Community.

            GET SUPPORT
            Log a ticket for an issue or bug.

            CONTACT US

          • DEMOS

            IVAAP DEMOS
            Cloud-Based Demos

            FIRST TIME HERE?
            Register to access our
            IVAAP demos

    • GeoToolkit™
          • SUCCESS STORIES

            CAYROS
            Field development planning

            TOTALENERGIES
            High-performance large dataset reservoir rendering

            IFP ENERGIES NOUVELLES
            Seismic and structural interpretation validation

            SEE ALL >

          • SUPPORT

            DEVELOPER COMMUNITY
            Join or log in to the INT Developer Community.

            GET SUPPORT
            Log a ticket for an issue or bug.

            CONTACT US

          • DEMOS

            GEOTOOLKIT DEMOS
            Geoscience Demos

    • INTViewer™
          • SUCCESS STORIES

            STRYDE
            Fast seismic QA/QC in the field

            SILVERTHORNE SEISMIC
            Efficient 2D/3D seismic data delivery

            WIRELESS SEISMIC
            Drones, IoT, and Advanced Onsite Seismic Data Validation

            SEE ALL >

          • SUPPORT

            GET SUPPORT
            Log a ticket for an issue or bug.

            CONTACT US

          • PLUG-INS

            EXTEND INTVIEWER
            More than 65 plugins available

  • Demos
    • GeoToolkit Demos
    • IVAAP Demos
  • Success Stories
  • Resources
    • Blog
    • Developer Community
    • FAQ
    • INT Resources Library
  • About
    • Overview
    • News
    • Events
    • Careers
    • Meet Our Team
    • About INT

data

May 08 2023

Production Geology Workflows with IVAAP

In this blog post, we will explore how IVAAP, a platform developed by INT, is revolutionizing the production geology workflow for geoscientists. GeomodL International, a consultancy based in the UAE, specializes in this field and has been utilizing IVAAP to enhance its production geology workflow. In this blog post, Raffik Lazar, founder and principal at GeomodL International, will share his insights on how IVAAP has helped streamline their production geology workflow, allowing them to visualize and cross-visualize various data sets in a single location, leading to better decision-making, cost-saving, and optimization of development plans.

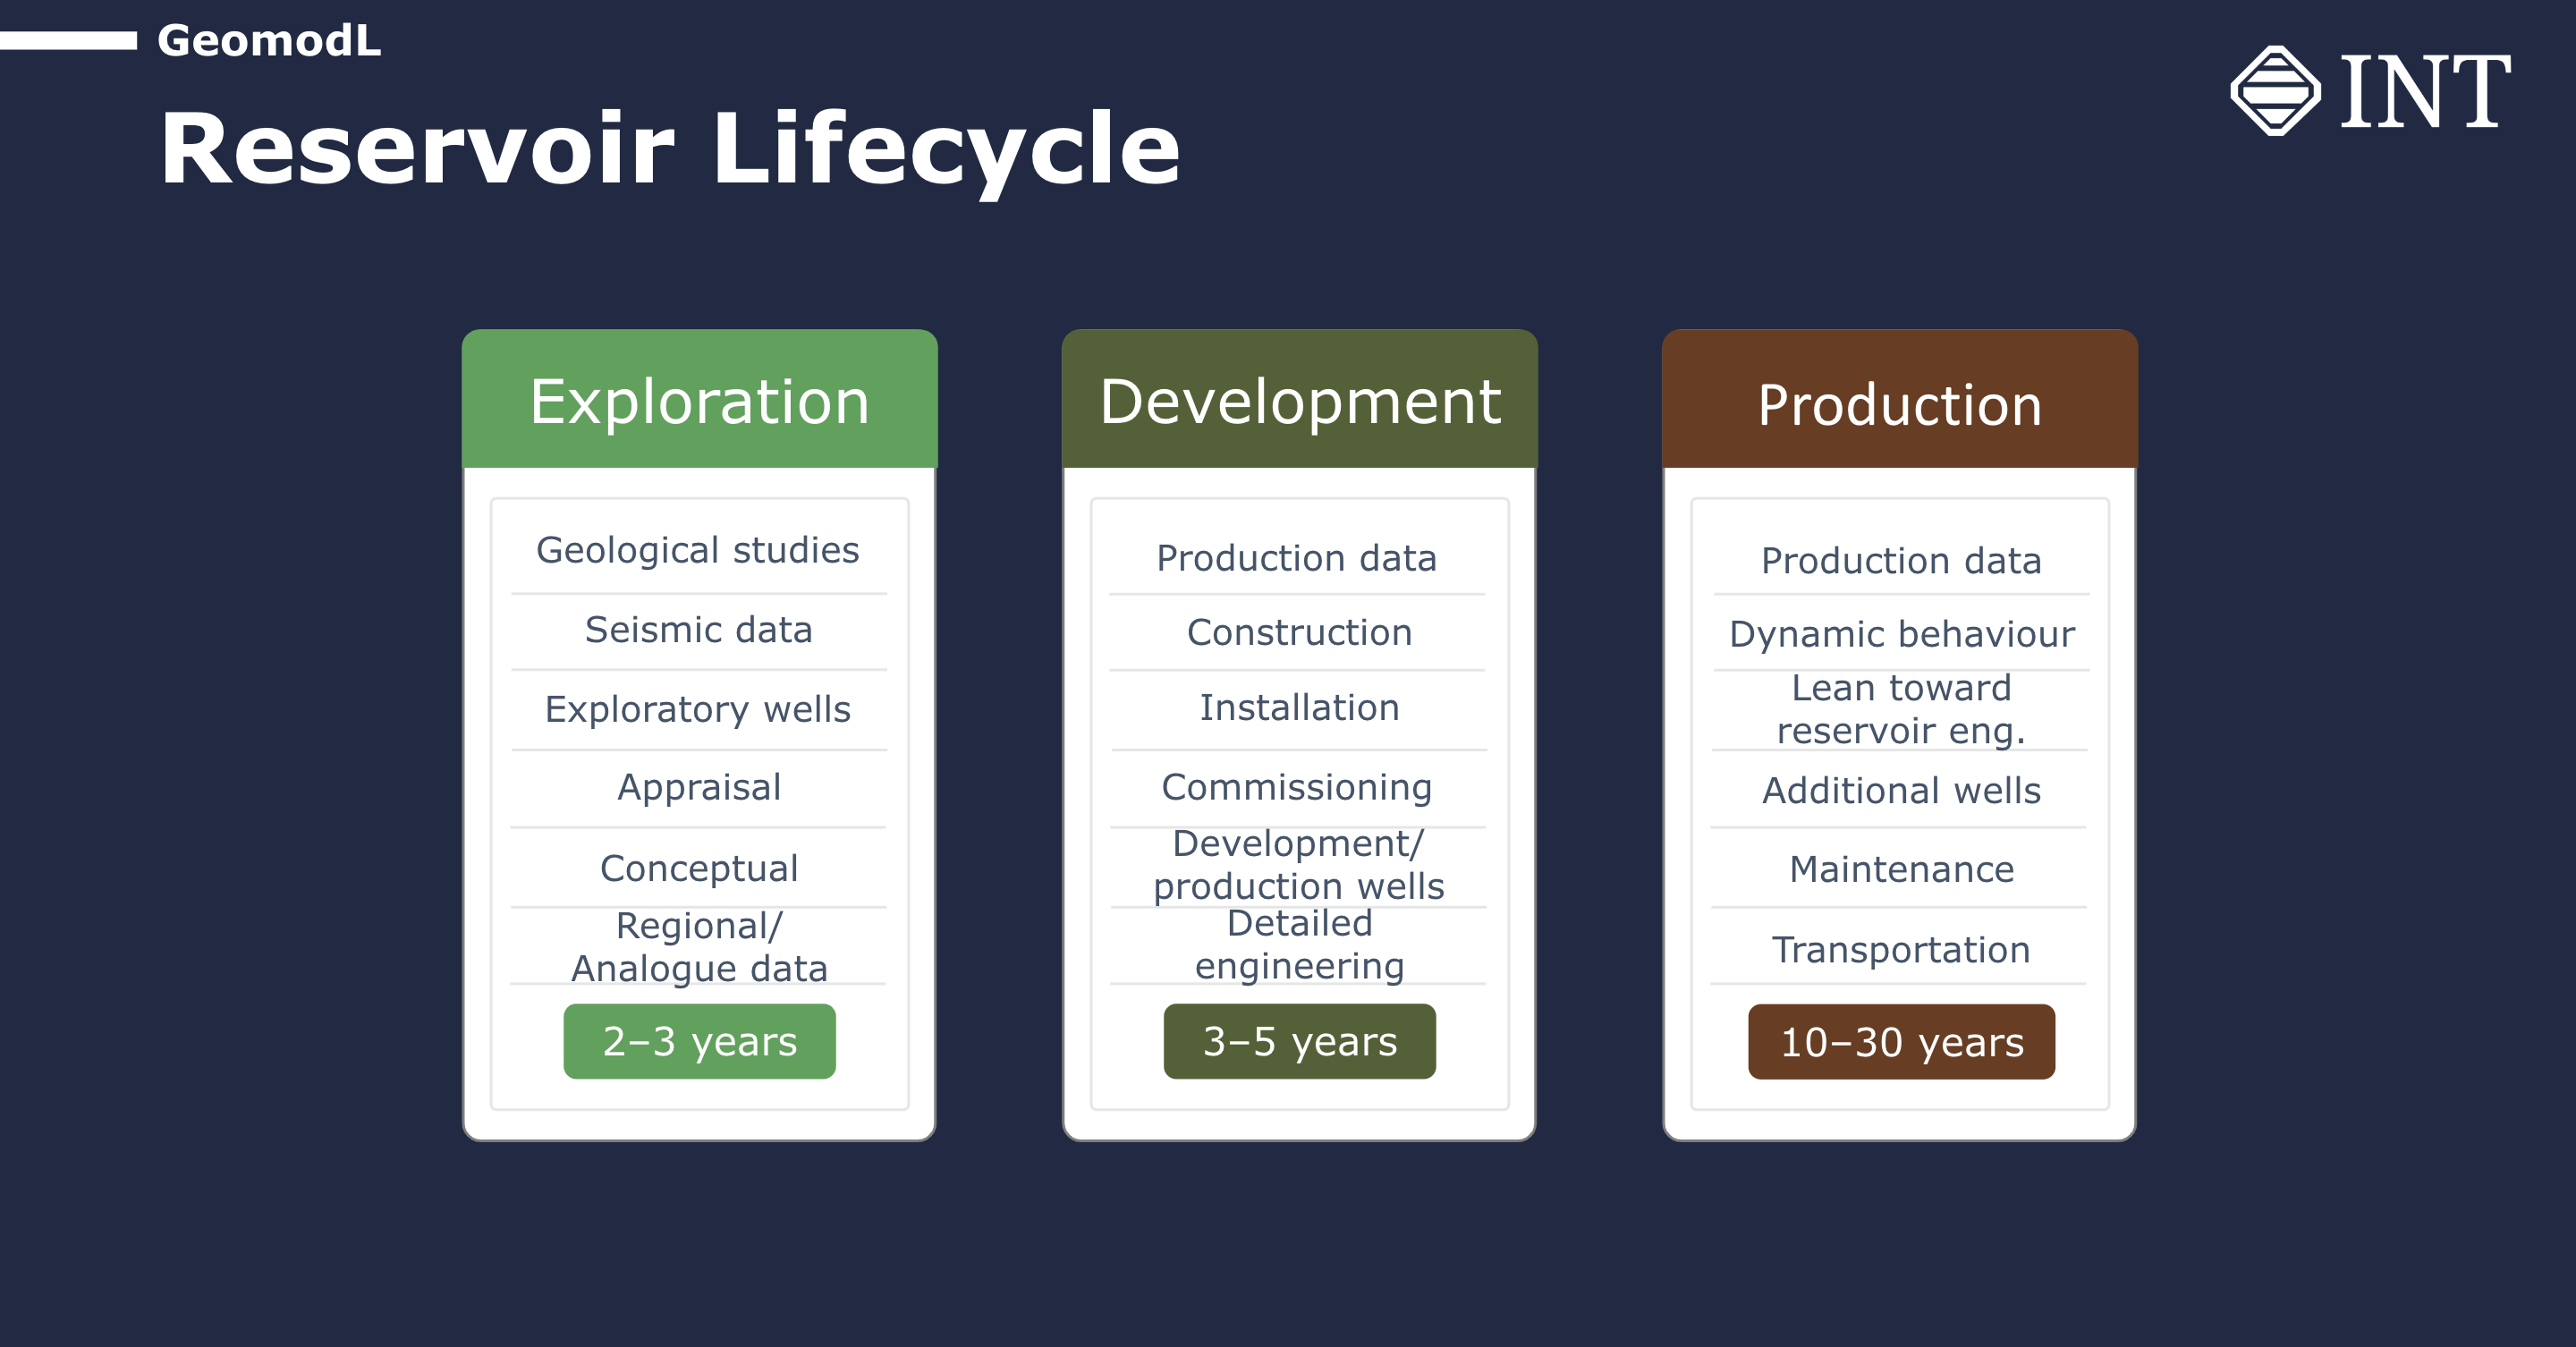
Reservoir Lifecycle and Production Geology Workflow 

As many of you know, the reservoir lifecycle typically starts with exploration, which can take two to three years. During this phase, geoscientists rely heavily on seismic data to understand the basin’s geology. Exploration wells are drilled, and projections of the reservoir are developed. Once an asset is identified to be commercially relevant, the project transitions into the development phase, which can take three to five years on average. During this phase, wells are drilled, and surface structures are commissioned. Production data starts to become available, providing insights into the behavior of the reservoir. The production phase, which can last for 10 to 30 years, involves drilling additional wells within the same field based on the dynamic behavior of the reservoir and refining the static model with the help of geology and geophysics (G&G) data and production data.

pic 1_GeomodL

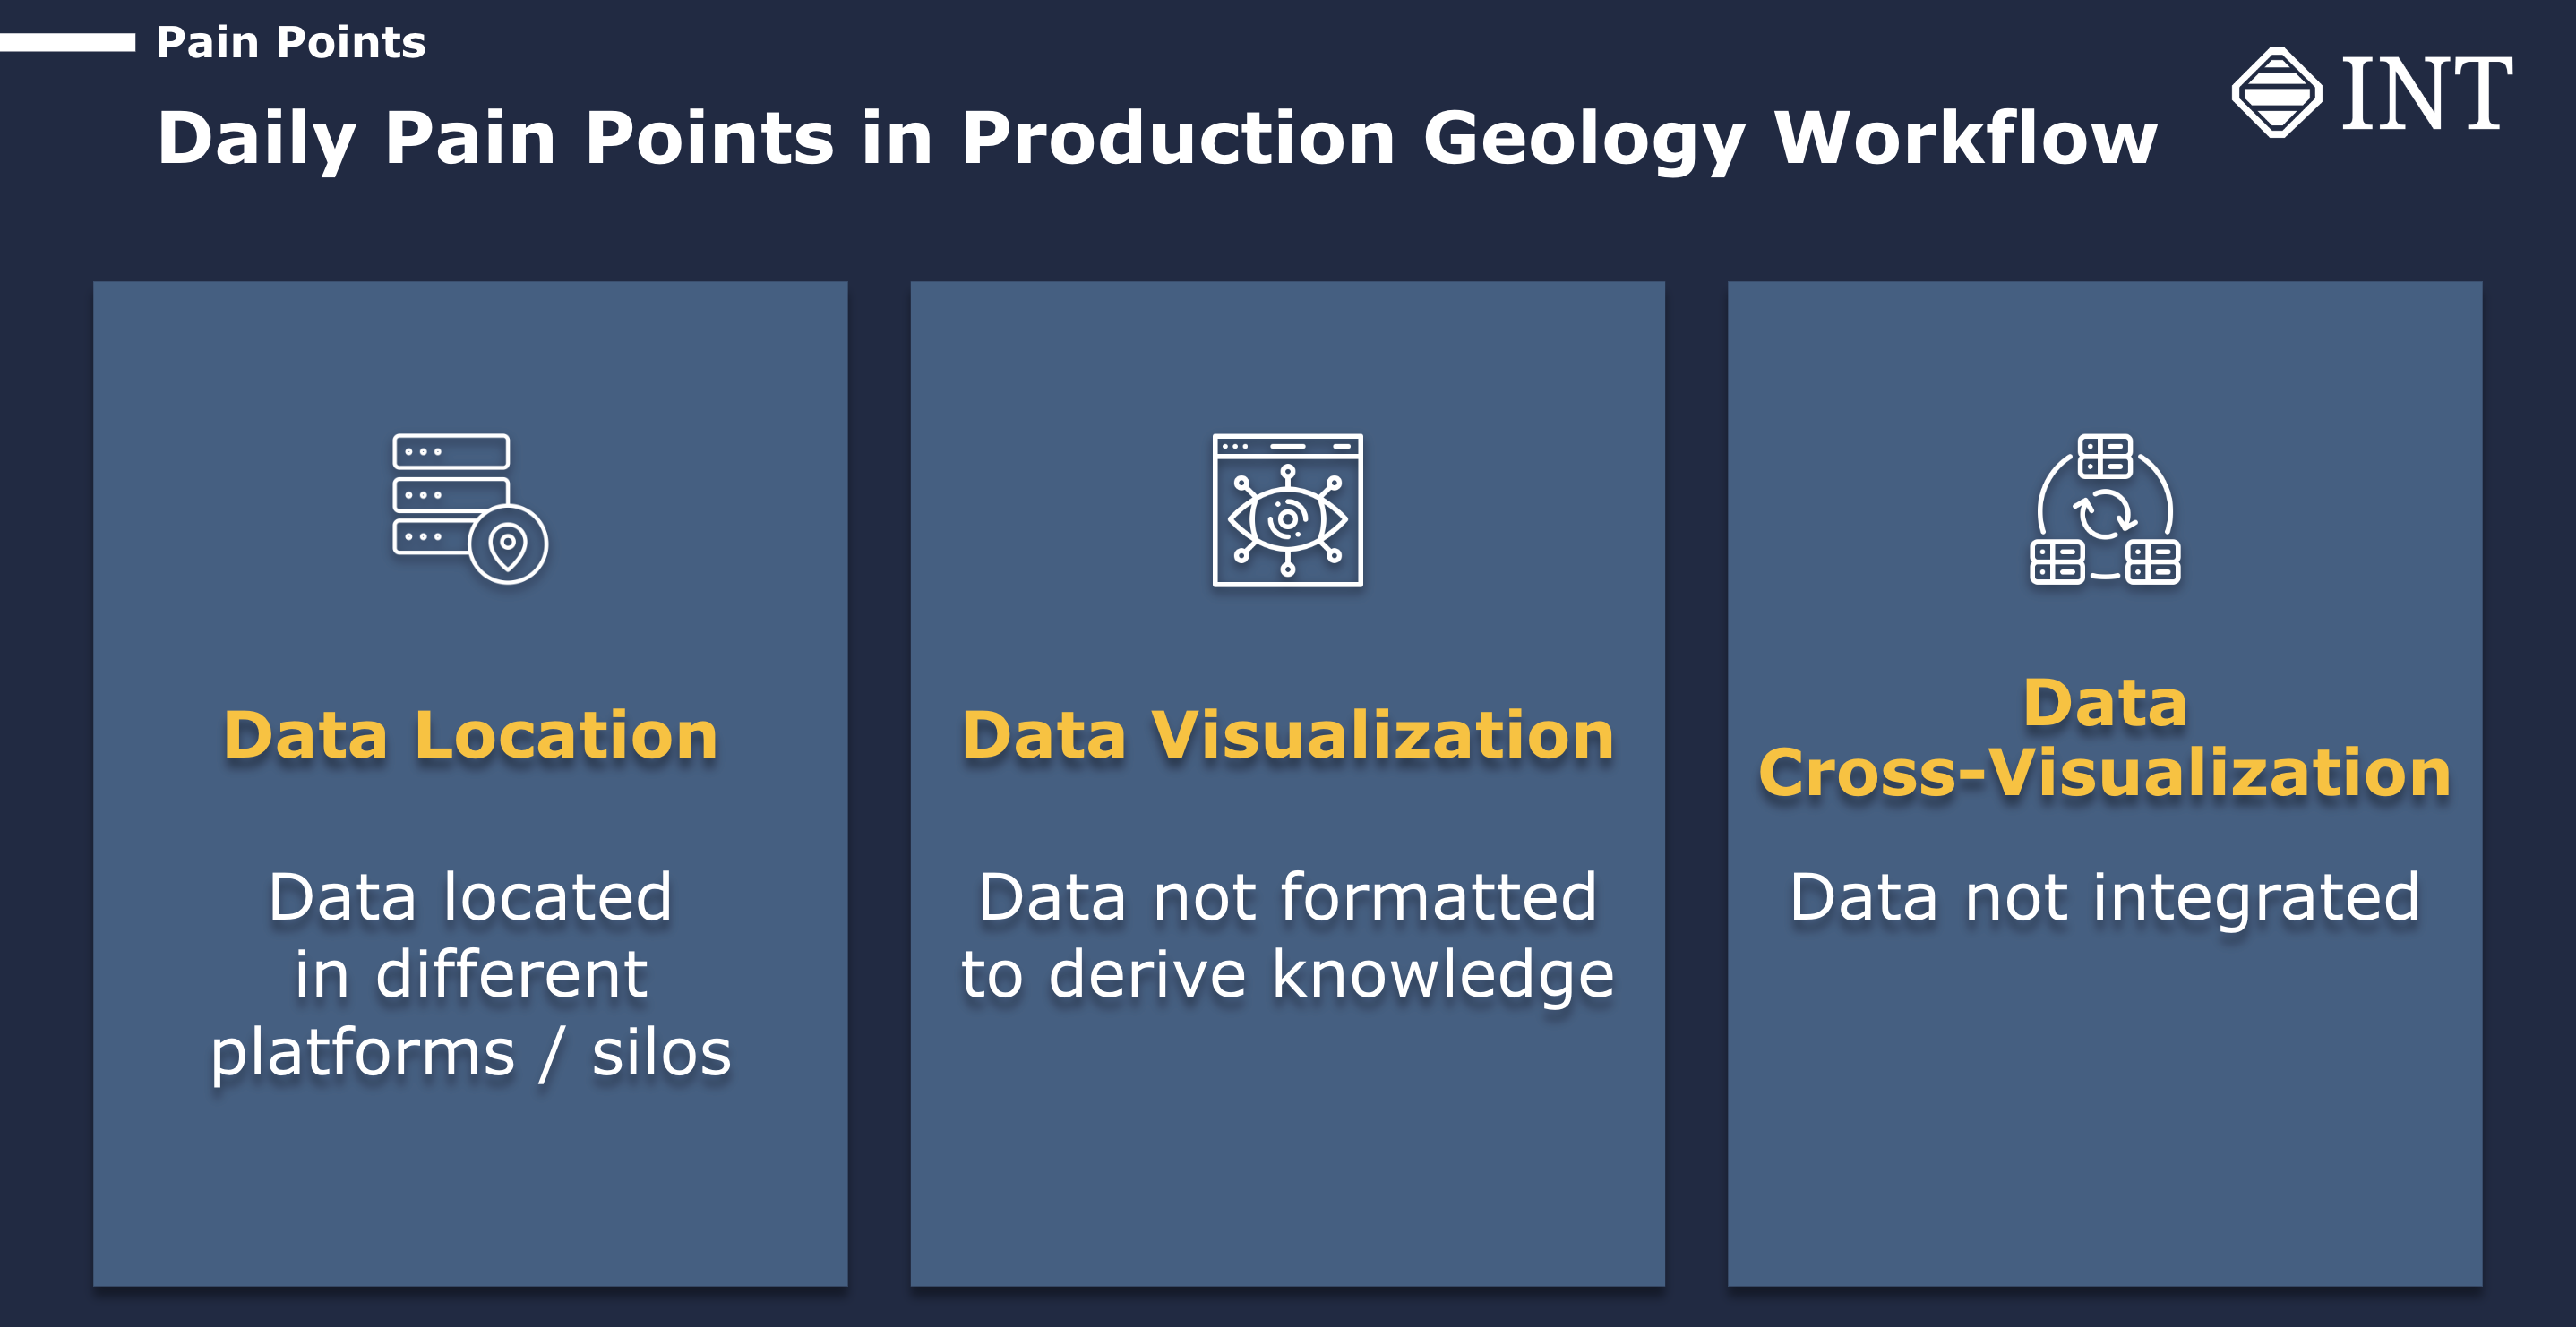
Challenges in Production Geology Workflow

One of the challenges in the production geology workflow is the fragmented nature of data, which is typically located in different platforms or silos. Production data is often in Excel formats, while G&G data may be stored in Petrel or other data sets, making it difficult to visualize and analyze the data in an integrated manner. Additionally, the time-consuming process of manually cross-visualizing data from different sources hinders the geoscientists’ ability to gain insights and make informed decisions quickly.

Pic 2_GeomodL

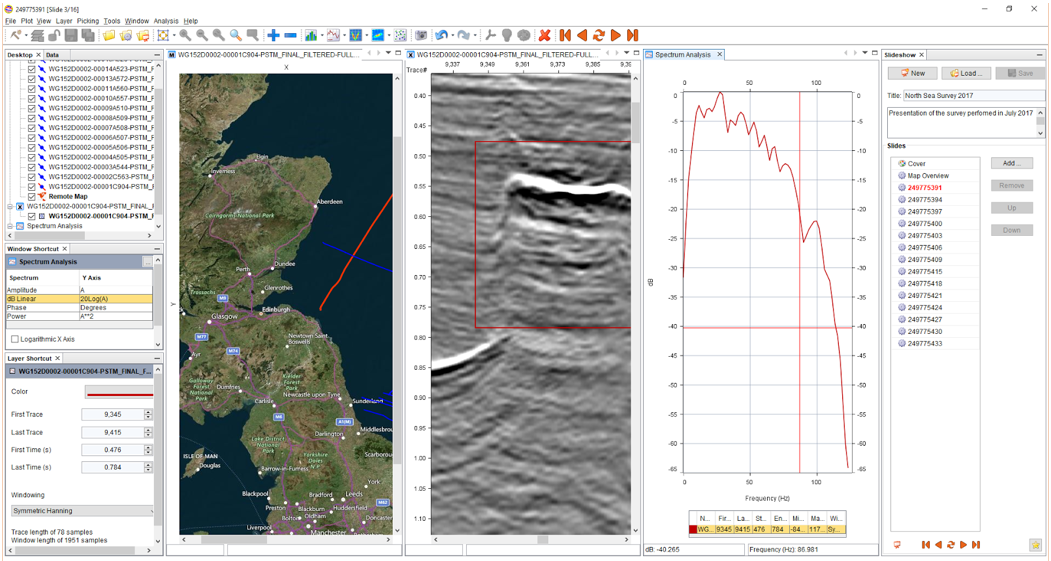
The Power of Data Visualization with IVAAP 

IVAAP, a web-based platform developed by INT, has emerged as a game-changer in production geology. It provides geoscientists with a single platform to access and visualize various data sets, including production data, G&G data, and 3D models, all in one location. This eliminates the need to manually search for and integrate data from different sources, saving time and effort. With IVAAP, geoscientists can easily cross-visualize data, allowing them to gain insights far more effectively than looking at each data set in isolation. The ability to visualize data in a comprehensive and integrated manner enables geoscientists to understand the behavior of the reservoir better and make informed decisions for development plans, leading to cost-saving and optimization of resources.

Pic 3_GeomodL

Case Study: Coevorden Field 

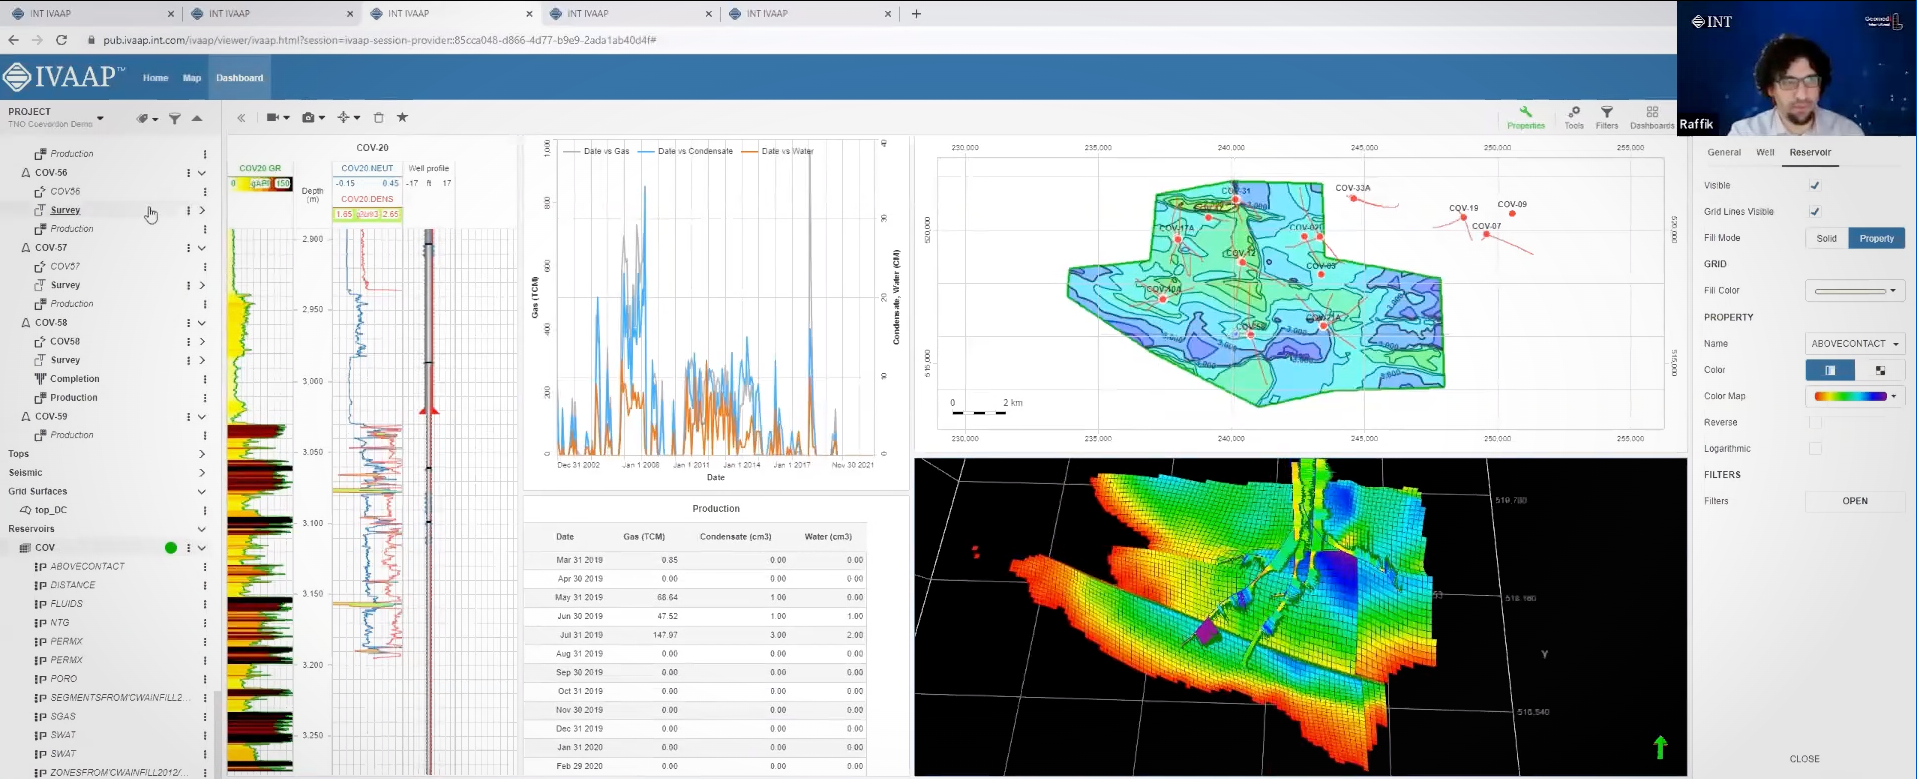
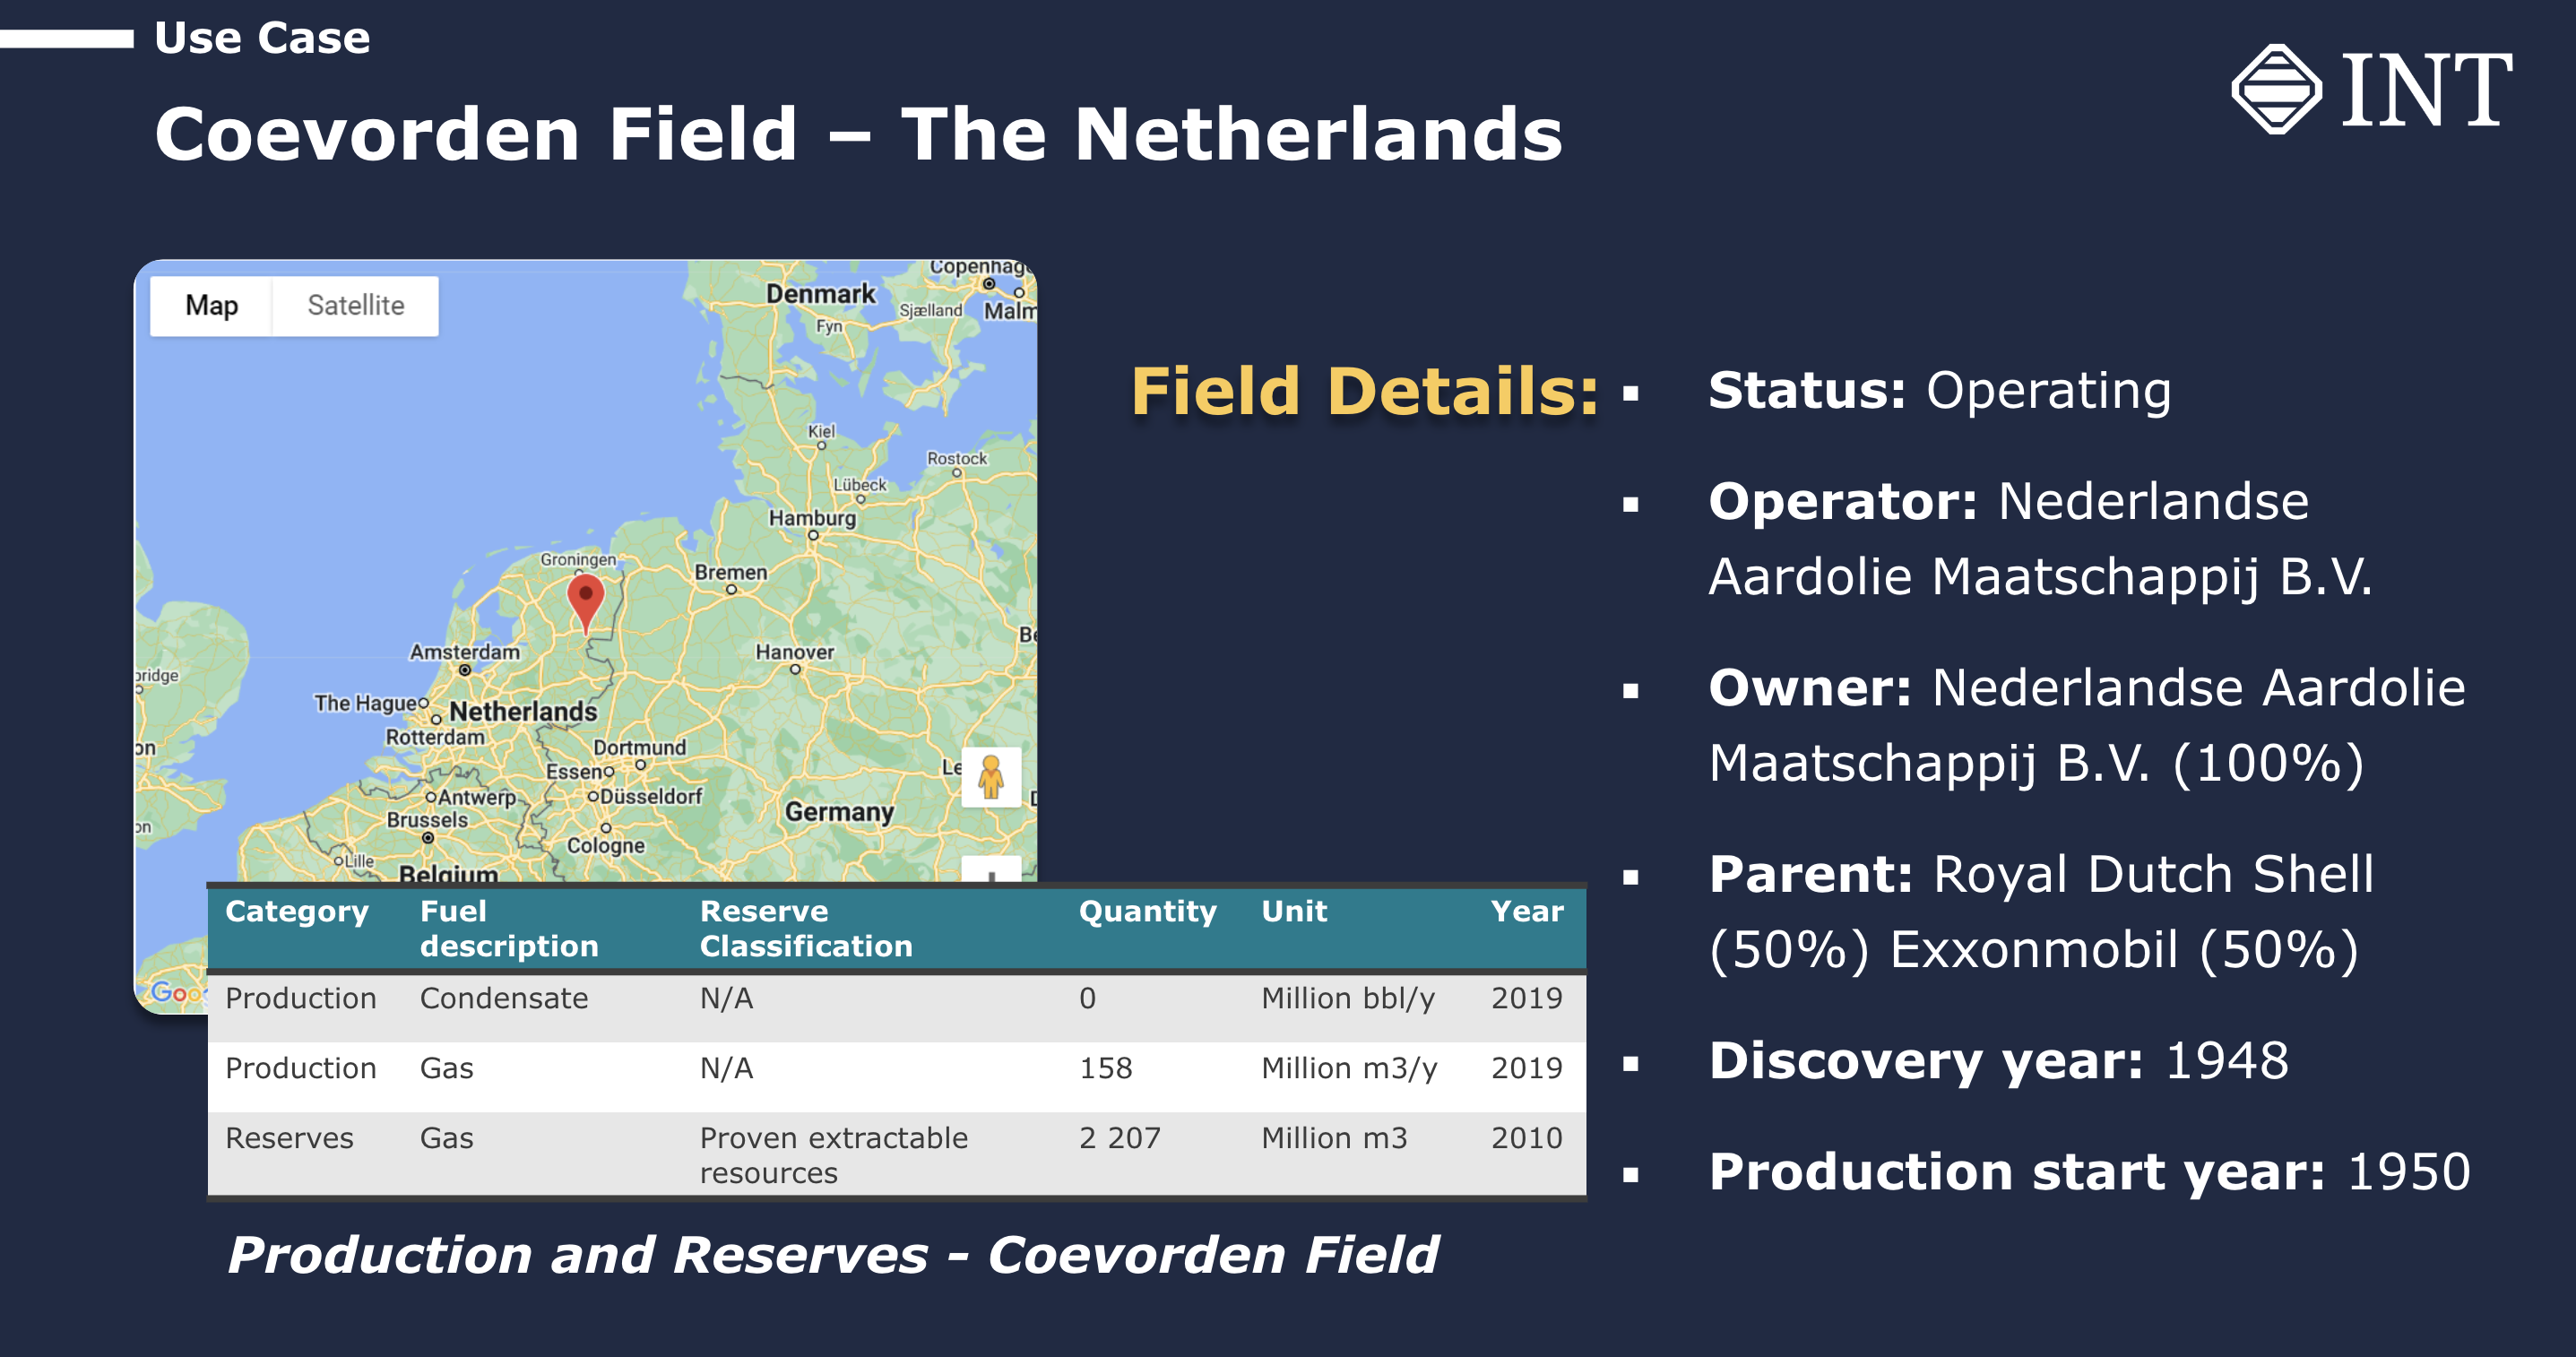
To illustrate the power of IVAAP in streamlining the production geology workflow, let’s look at the case study of the Coevorden Field, a gas field in the Netherlands. This field is still operating as a joint venture between Shell and ExxonMobil and is considered a very mature field with significant gas reserves. GeomodL International used IVAAP to analyze the production data, G&G data, and 3D models of the Coevorden Field.

Pic 4_GeomodL

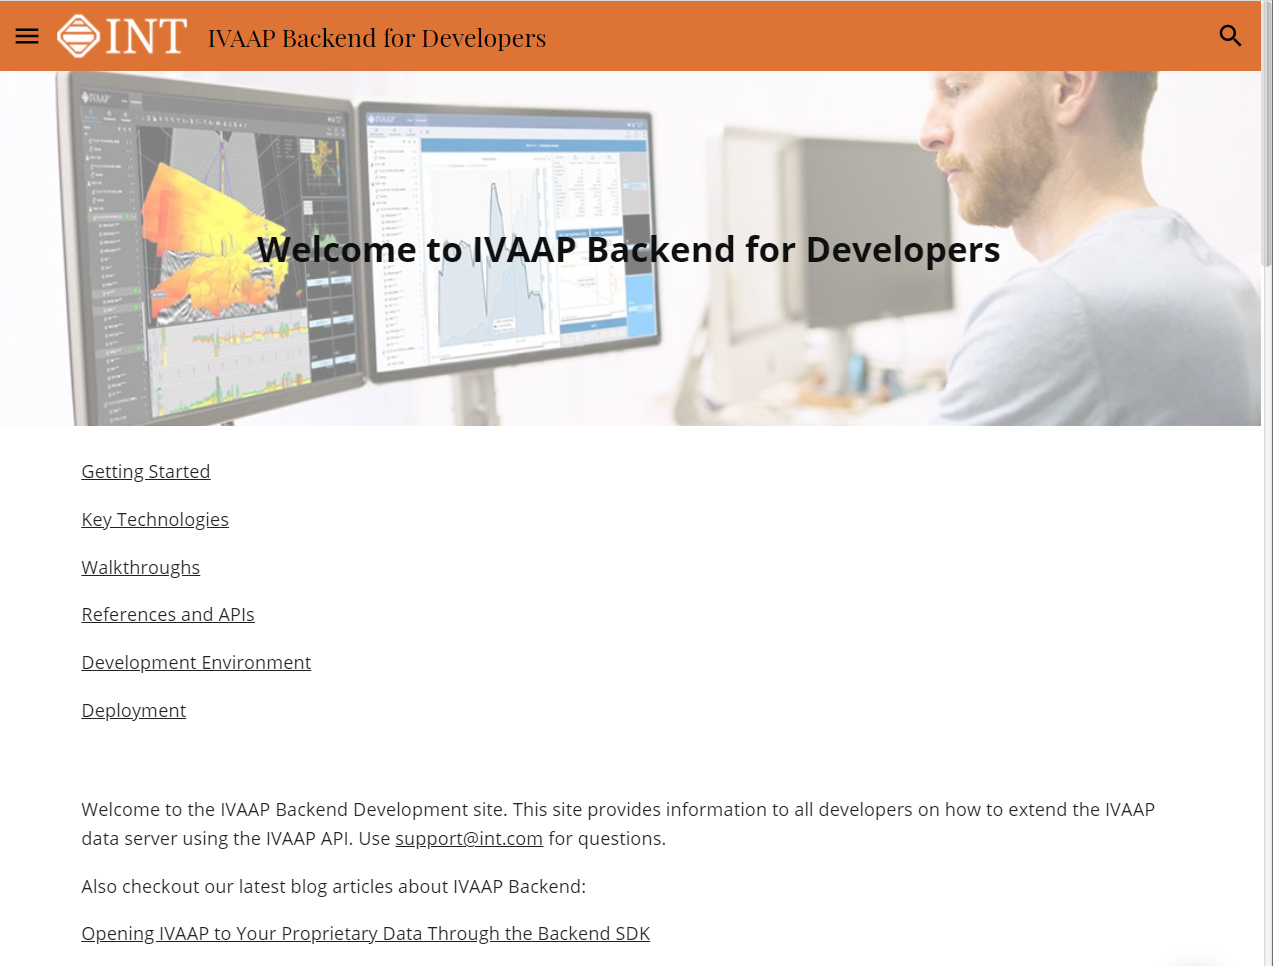
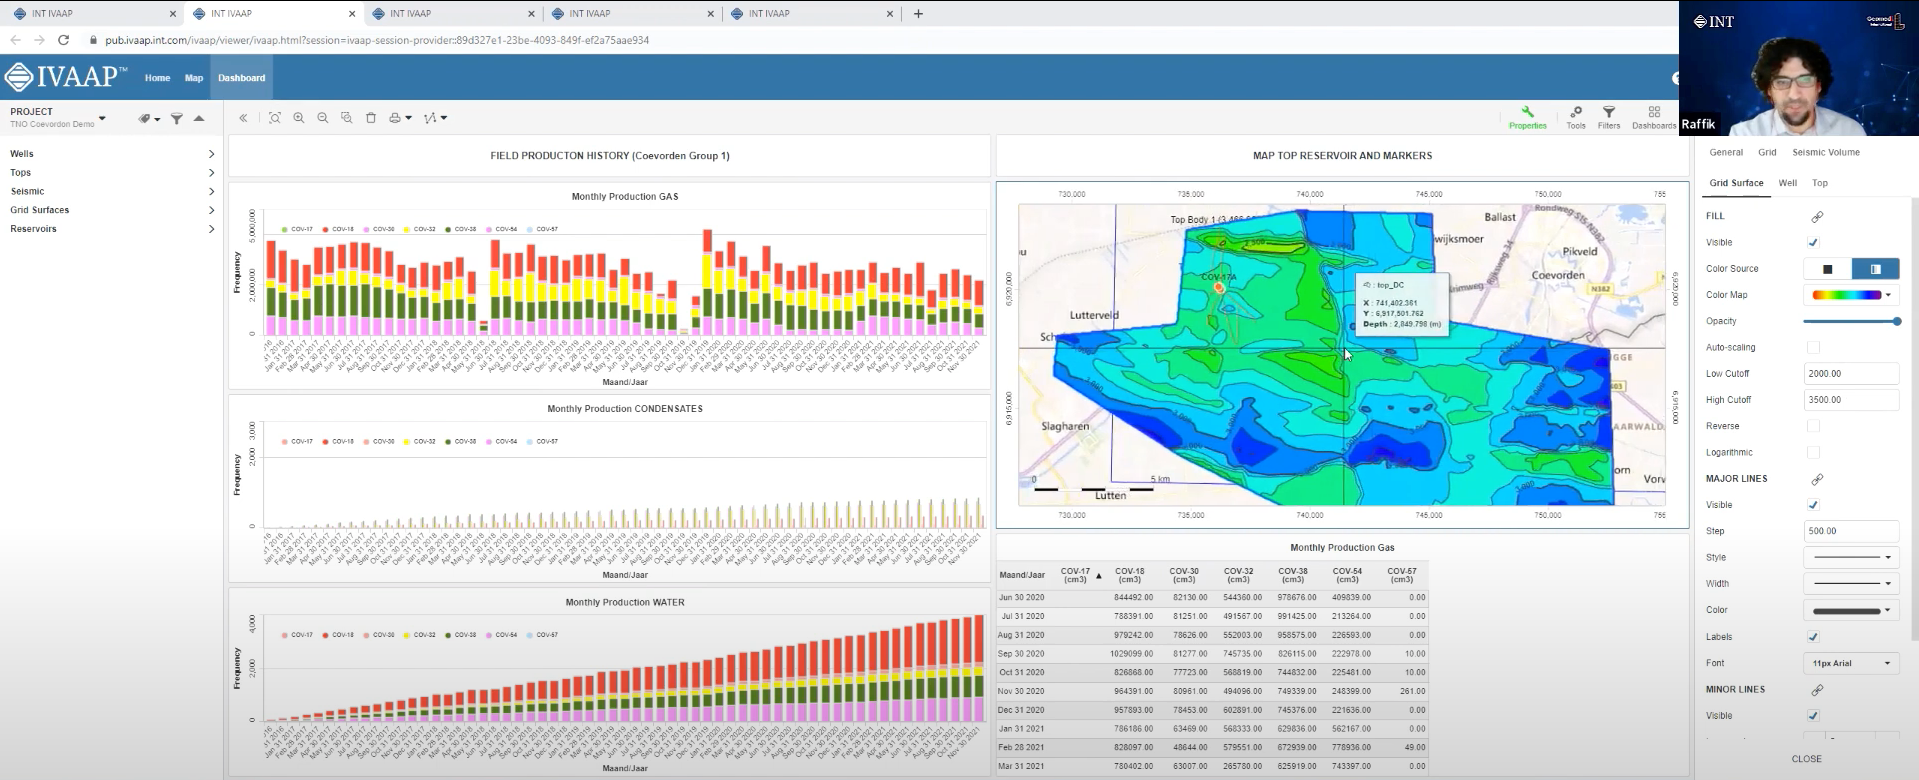
IVAAP is a web-based platform accessible through a modern browser that supports HTML5 and WebSockets, eliminating the need for specific hardware or a powerful machine to perform complex analyses. Upon launching IVAAP, users are greeted with dashboards that can be opened individually to access various tools and functionalities. The dashboards are organized with data on the left, parameters and settings on the right, and widgets such as charts, maps, and 3D windows in the middle.

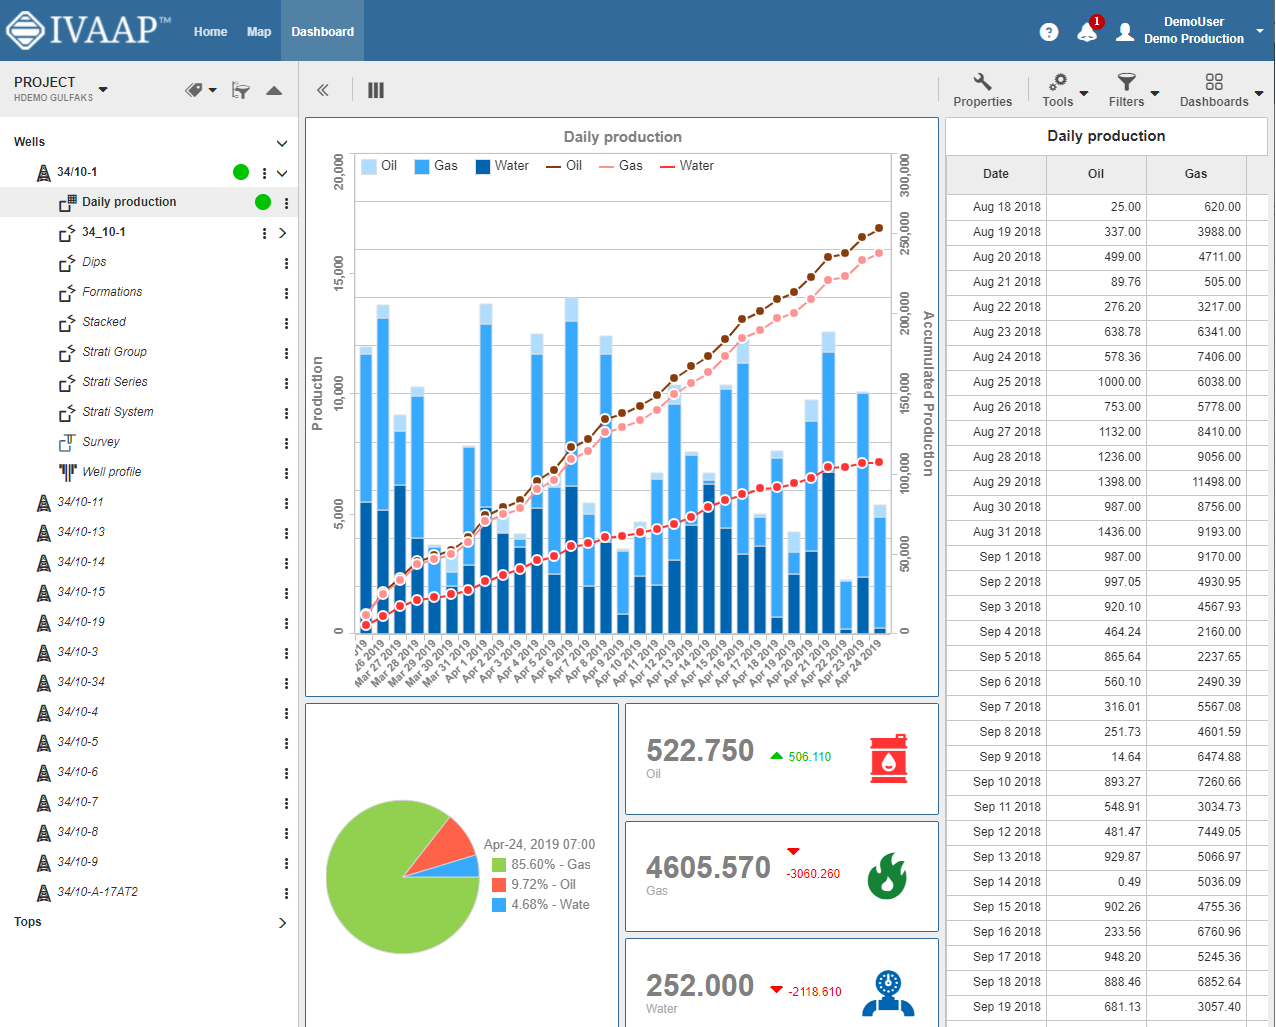
The first dashboard that proves beneficial for geologists is the production dashboard. It allows users to visualize the performance of wells in the field over time. Users can adjust settings such as the time period and view production data for individual wells or groups of wells. For example, users can track the cumulative production of a group of wells on a monthly or yearly basis and even compare gas production with condensate and water production. The dashboard provides interactive tools to manipulate and analyze the data, such as adjusting time periods to understand the production trends in the field comprehensively.


Pic X_GeomodL

Watch the complete use case here.


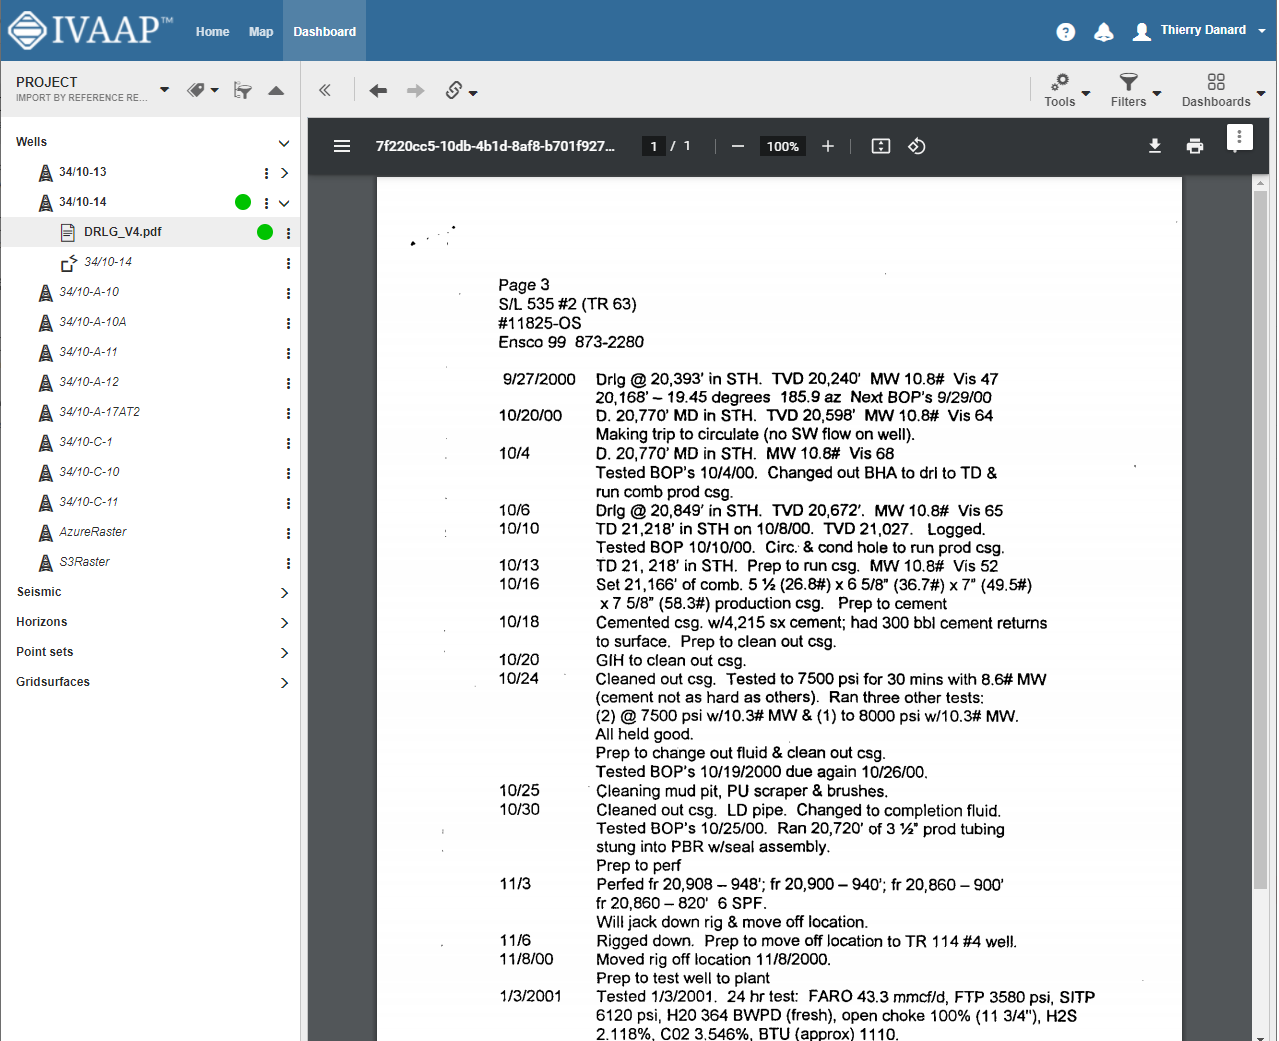
The second dashboard in IVAAP provides more detailed well-level information. Users can access individual well data, including production curves, well logs, and 3D models of the reservoir. The 3D window allows for seamless zooming in and out, and users can interact with the well logs and maps in a synchronized manner. For example, users can view the location of perforations and casing shoes in the well schematic and simultaneously see the corresponding changes in the well logs. This integrated approach allows geologists to analyze production data in the context of the reservoir model, enabling a more comprehensive understanding of the field’s performance.

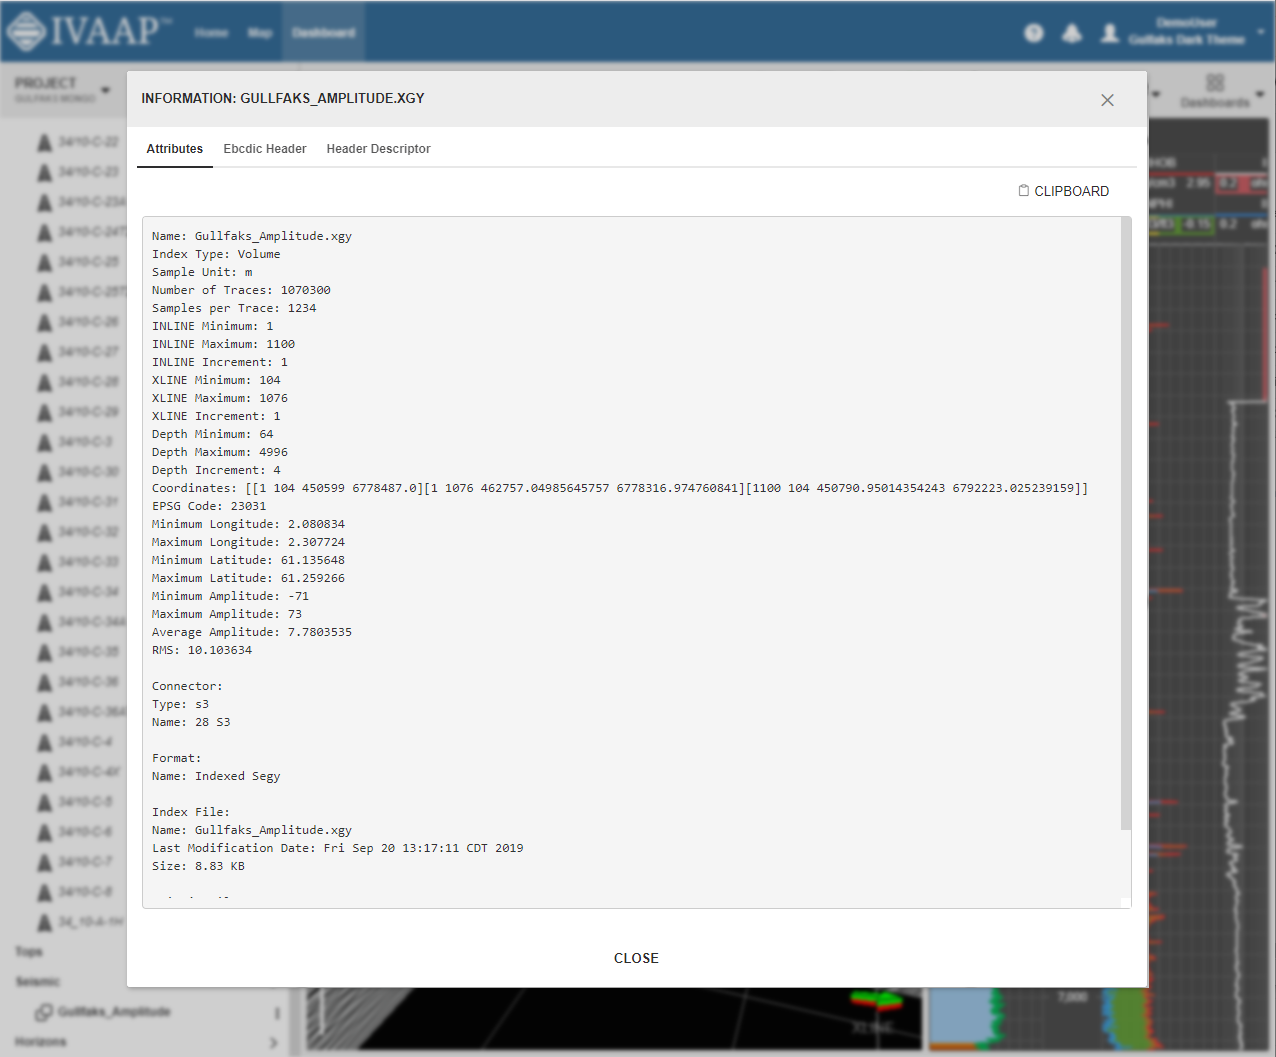
One of the notable features of IVAAP is its ability to provide a holistic view of the field’s data under the same roof. Geologists and reservoir engineers can access 3D models, top reservoir maps, well schematics, well logs, and production data in one platform. This integrated approach streamlines the analysis process and allows for a more efficient workflow, saving time and resources.


Pic 3_GeomodL

Watch the complete use case here.

As the industry continues to evolve and face new challenges, platforms like IVAAP provide a cutting-edge solution for geoscientists to manage complex data and make informed decisions effectively. By harnessing the power of technology, geoscientists can unlock the full potential of their reservoirs, leading to improved exploration, appraisal, and development strategies. With IVAAP, geoscientists can confidently navigate the reservoir life cycle from exploration to mature fields and drive greater success in oil and gas operations, all from a single point of access.

Visit us online at int.com/ivaap for a preview of IVAAP or for a demo of INT’s other data visualization products. 

For more information, please visit int.flywheelstaging.com or contact us at intinfo@int.com.

____________

ABOUT INT

INT software empowers energy companies to visualize their complex data (geoscience, well, surface reservoir, equipment in 2D/3D). INT offers a visualization platform (IVAAP) and libraries (GeoToolkit) that developers can use with their data ecosystem to deliver subsurface solutions (Exploration, Drilling, Production). INT’s powerful HTML5/JavaScript technology can be used for data aggregation, API services, and high-performance visualization of G&G and energy data in a browser. INT simplifies complex subsurface data visualization.

INT, the INT logo, and IVAAP are trademarks of Interactive Network Technologies, Inc., in the United States and/or other countries.


Filed Under: IVAAP Tagged With: data, data visualization, drilling, Geology, Geoscientists, ivaap, Production, Production geology

Jan 19 2022

An Inside Look at the New Release of the IVAAP Data Backend SDK

INT recently announced the release of IVAAP 2.9. We sat down with Thierry Danard, INT’s VP of Core Platform Technologies, for a quick chat about what this release includes for the Data Backend SDK.


Hi Thierry, what can you tell us about IVAAP 2.9 for the Data Backend?

There are a few low-level changes that won’t make it to the release notes, but that will make a difference for users. For example, we optimized the data caching mechanism. Instead of being based on the number of datasets, the data caches are now based on the size of these datasets. This typically means lower latency as more datasets tend to be cached within the same memory space. This is a feature we initially used only with WITSML wells that we have extended to other connectors and data types.

At a high level, we added a powerful “tiled images” feature. Some INT customers have large rasters that they need to visualize, or that their customers need to visualize as part of a portal. These images are stored as good old TIFF image files on a local file system or in the cloud. To visualize these images in IVAAP, you just need to point at the location of these tiles, and IVAAP does the rest. While the idea of visualizing images online might seem mundane, there is quite a lot of technology to make this happen.

First, these image files are LARGE. They can be up to 4 GB in TIFF format, and that’s a compressed format! To make the visualization of these images seamless, you need to be really good at:

  1. Downloading these files from the cloud, fast
  2. Reading these images in their native format
  3. Rendering these images as small tiles and sending these tiles to the viewer efficiently
  4. Stitching these images back together as one raster on the viewer side
  5. Caching these images long enough, but not too long
  6. Doing all this concurrently, for a large number of simultaneous users

That’s the technology side of it. From a business perspective, what’s really interesting is that there is no preprocessing of the images required. The ingestion workflow requires no specialized tooling. There’s no need to “precut” each TIFF as multiple tiles at multiple resolution levels. The “cutting” is all done on the fly and it’s seamless to end users. This is particularly important to keep storage to a minimum when you migrate your image library to the cloud. When each TIFF file takes gigabytes, a library of only a few thousand files already has a significant footprint, so you don’t want to expand that footprint with file duplication.


Is this image tiling feature something I could use for my own image storage?

Yes. The technology we developed makes abstraction of the storage mechanism possible. The reading, cutting, rendering, and caching are part of the IVAAP Data Backend SDK’s API. You can reuse these parts in your code.


What’s the purpose of this SDK, and how does it apply to images?

One of the strengths of IVAAP is that it allows the visualization of data from multiple data sources. For example, just for visualization of wells, IVAAP supports Peloton WellView, PPDM, WITSML, LAS files in the cloud, etc. These data sources typically share a common data model, but what’s different between them is the medium or protocol to access this data. The typical use case of the IVAAP Data Backend SDK is to facilitate the implementation of that access layer.

Images are treated as data. Just like we have “well” web services, we have “image” web services. The image web services are generic in nature—it’s the same service code running regardless of their underlying storage mechanism. It’s only the access code that differs. As a matter of fact, we implemented access to four types of image stores on top of our SDK:

  • Images stored locally on disk
  • Images stored in Amazon S3
  • Images stored in Microsoft Azure Blob Storage
  • Images stored in Google Cloud Storage

In this particular example, we used our own SDK to develop both the data layer and the web service layer.


Is the IVAAP Data Backend SDK a web framework?

While this SDK does provide an API to create your own web services, it goes well beyond that. If you call the IVAAP Data Backend SDK a framework, then it’s a highly specialized framework. And it’s not just a web framework, it’s also a data framework. Also, web frameworks tend to force you into a container. To scale your application, you are limited by the capabilities of this container. The IVAAP Data Backend SDK abstracts the container away, giving customers multiple options for how to deploy it and scale it.

From a technical perspective, a good SDK should empower developers. Often, this means requiring the least amount of effort to get the job done. From a business perspective, a good SDK should reduce development costs. Calling the IVAAP Data Backend SDK “yet another web framework” is missing the point of its value. Its value is not about doing the same thing as your favorite “other framework,” it’s about fitting your use case in the most effective way.


Then … how is the IVAAP Data Backend SDK a good fit?

Obviously, the integration with the rest of IVAAP is a strong benefit. You could write your data access object (DAO) layer using the API of your choice, but you would still need to write more mundane aspects, such as:

  • Exposing this data in a REST API, following the exact protocol that the IVAAP client expects. There would be hundreds of REST services to implement.
  • Integrating with services from the Admin server. For example, how users are identified, how to find out who has access to what, what are the datasets within a project, etc.

The second fit is that the SDK is designed to work with geoscience data. It integrates the data models of multiple data types, such as wells, seismic, surfaces … and raster images. While the IVAAP Data Backend SDK can be used outside of a geoscience context, a good portion of its API is geoscience-specific.

During design, we were particularly careful not to make any assumptions about how our customers’ geoscience data is stored. No matter how exotic your data systems might be, the IVAAP Data Backend will be able to access them. We are not just talking about storage, we are also talking about real-time feeds and machine learning (ML) workflows. We verified this multiple times. One particularly visible example is OSDU. INT has been on the leading edge of OSDU development, following the multiple iterations or flavors of OSDU services without requiring a change to our SDK.


How is the IVAAP Data Backend SDK effective?

Its API is quite simple to learn. Multiple INT customers have used this SDK to develop their own IVAAP customizations, and its API has always been well received. One aspect that is particularly liked is the lookup architecture. Plugging a class requires no XML, just one Java annotation, and it’s the same annotation used across the entire API. It’s an elegant mechanism, easy to learn, and even easier to use.

The real proof of the IVAAP Data Backend SDK’s effectiveness is the time it takes external developers to learn it and develop their own connector. We tested the effectiveness of the SDK by asking new hires to develop a connector, only armed with their knowledge of Java. Without any prior geoscience knowledge, the average time to get that connector up and running has been 2 weeks.

Another way that the backend keeps developers effective is by not taking away their favorite development tool. While the IVAAP Data Backend uses a powerful cluster architecture in production deployments, the typical developer’s day is with their favorite IDE (NetBeans, Eclipse, IntelliJ, etc.) and a well-known application server (Tomcat, Glassfish). Development is much faster when you don’t need to launch an entire cluster for a simple debugging session.

Effectiveness and fit are key. The goal of a typical framework is to help you get started faster. It provides a shortcut to skip the implementation of the mundane concerns of an application. In IVAAP’s case, for many customers, the application itself is already written. For these customers, the IVAAP Data Backend SDK helps you get finished faster instead. It provides customers with the API to finish the last mile of an IVAAP deployment, the access layer to their proprietary data store.

For more information or for a free demo of IVAAP, visit int.com/products/ivaap/.


Filed Under: IVAAP Tagged With: backend, data, IDE, image, ivaap, OSDU, raster, SDK, TIFF

Jun 17 2021

How to Extend the IVAAP Data Model with the Backend SDK

The IVAAP Data Backend SDK’s main purpose is to facilitate the integration of INT customers’ data into IVAAP. A typical conversation between INT’s technical team and a prospective customer might go like this:

Can I visualize my data in IVAAP?

Yes, the backend SDK is designed to make this possible, without having to change the UI or even write web services.

What if my data is stored in a proprietary data store?

The SDK doesn’t make any assumptions on how your data is stored. Your data can be hidden away behind REST services, in a SQL database, in files, etc.

What are the steps to integrate my data?

The first step is to map your data model with the IVAAP data model. The second step is to identify, for each entity of that data model, how records are identified uniquely. The third step is to plug your data source. The fourth and final step is to implement, for each entity, the matching finders.

What if I want to extend the IVAAP data model?

My typical answer to this last question is “it depends”. The SDK has various hooks to make this possible. Picking the right “hook” depends on the complexity of what’s being added.

Using Properties

The IVAAP data model was created after researching the commonalities between the industry data models. However, when we built it, we kept in mind that each data store carries its own set of information, information that is useful for users to consume. This is why we made properties a part of the data model itself. From an IVAAP SDK point of view. Properties is a set of name-value pairs that you can associate with specific entities within the IVAAP Data Model.

For example, if a well dataset is backed by an .LAS file in Amazon S3 or Microsoft Azure Blob Storage, knowing the location of that file is a valuable piece of information as part of a QC workflow. But not all data stores are backed by files, a file location is not necessarily relevant to a user accessing data from PPDM. As a result, the set of properties shown when opening a dataset backed by Azure will typically be different from a set coming from PPDM, even for the same well.


properties dialog example
An example of properties dialog, showing multiple properties of a seismic dataset stored in Amazon S3.


Calling the properties a set of name-value pairs does not do justice to its flexibility. While a simple name+value is the most common use, you can create a tree of properties and attach additional attributes to each name-value pair. The most common additional attribute is a unit, qualifying the value to make this property more of a measurement.  Another attribute allows name-value pairs to be invisible to users. The purpose of invisible properties is to facilitate the integration with other systems than the IVAAP client. For example, while a typical user might be interested in the size of a file, this size should be rounded and expressed in KB, MB or GB. An external software consuming the IVAAP Properties REST services would need the exact number of bytes.

One of the benefits of using properties to carry information is that it’s simple to implement your own property finder, and it requires no additional work. No custom REST services to write, and no widget to implement to visualize these properties. The IVAAP HTML5 client is designed to consume the IVAAP services of the data backend, and show these properties in the UI.

Adding Your Own Tables and Documents

One of the limitations of properties is they don’t provide much interaction. Users can only view properties. The simplest way to extend the IVAAP model in a way that users can interact with that data is to add tables. For example, the monthly production of a well is an easy table  to make accessible as a node under a well. Once the production of a well is accessible as a table, users have multiple options to graph this production: as a 2D Plot, as a pie chart, as an histogram, etc. And this chart can be saved as part of a dashboard or a template, making IVAAP a portal.

The IVAAP Data Backend SDK has been designed to make the addition of tables a simple task. Just like for properties, the HTML5 Viewer of IVAAP doesn’t need to be customized to discover and display these tables. It’s the services of the data backend that direct the viewer on how to build the data tree shown to users. And while the data backend might advertise many reports, only non-empty reports will be shown as nodes by the viewer. 


tabular reports
An example of tabular reports related to a well.


In the many customization projects that I’ve been involved in, the tabular features of IVAAP have been used the most. I have seen dozens of reports under wells. The IVAAP Data Backend makes no assumptions about where this production data is stored relative to where the well is stored. For example, you can mix the schematics from Peloton WellView with the production reports from Peloton ProdView. From a user point of view, the source of the data is invisible, IVAAP combines the data from several sources in a transparent way. Extending the IVAAP data model doesn’t just mean exposing more data from your data source, it also means enriching your data model with data from other sources.

Data enrichment is sometimes achieved just by making accessible the documents associated with a well. For example, for Staatsolie’s portal, the IVAAP UI was giving direct access to the documentation of a well, stored in Schlumberger’s ESearch.


PDF document related to a well
An example of PDF document related to a well.


Adding Your Own Entities and Services

When data cannot be expressed as properties, tables or documents, the next step is to plug your own model. The API of the Backend SDK makes it possible to plug your own entities under any existing entity of the built-in data model. In this use case, not only code to access data needs to be developed, but also code to expose this data to the viewer. The IVAAP data model is mature, so this is a rare occurrence.

There are hundreds of services implemented with the IVAAP Data Backend SDK, developers who embark on a journey involving adding their own data types can be reassured by the fact that the path they follow is the same path the INT developers follow every day as we augment the IVAAP data model. INT makes use of its own SDK every day.


IVAAP Data Backend SDK Homepage
Home page of the website dedicated to the IVAAP Data Backend SDK.


Whether IVAAP customers need to pepper the IVAAP UI with proprietary properties or their own data types, these customers have options. The SDK is designed to make extensions straightforward, not just for INT’s own developers, but for INT customers as well. You do not need to contract INT’s services to roll your own extensions. You can, but you don’t have to. When IVAAP gets deployed, we don’t just give you the keys to IVAAP as an application, we also give you the keys to IVAAP as a platform, where you can independently control its capabilities.

For more information on IVAAP, please visit int.flywheelstaging.com/products/ivaap/


Filed Under: IVAAP Tagged With: backend, data, html5, ivaap, SDK

Nov 09 2020

Human Friendly Error Handling in the IVAAP Data Backend

As the use cases of IVAAP grow, the implementation of the data backend evolves. Past releases of IVAAP have been focused on providing data portals to our customers. Since then, a new use case has appeared where IVAAP is used to validate the injection of data in the cloud. Both use cases have a lot in common, but they differ in the way errors should be handled.

In a portal, when a dataset fails to load, the reason why needs to stay “hidden” to end-users. The inner workings of the portal and its data storage mechanisms should not be exposed as they are irrelevant to the user trying to open a new dataset. When IVAAP is used to validate the results of an injection workflow, many more details about where the data is and how it failed to load need to be communicated. And these details should be expressed in a human friendly way.

To illustrate the difference between a human-friendly message and a non-human friendly message, let’s take the hypothetical case where a fault file should have been posted as an object in Amazon S3,… but the upload part of the ingestion workflow failed for some reason. When trying to open that dataset, the Amazon SDK would report this low-level error: “The specified key does not exist. (Service S3, Status Code: 404, Request ID: XXXXXX)”. In the context of an ingestion workflow, a more human friendly message would be “This fault dataset is backed by a file that is either missing or inaccessible.”


Screen Shot 2020-11-05 at 4.28.12 PM


The IVAAP Data Backend is written in Java. This language has a built-in way to handle errors, so a developer’s first instinct is to use this mechanism to pass human friendly messages back to end users. However, this approach is not as practical as it seems.  The Java language doesn’t make a distinction between human-friendly error messages and low-level error messages such as the one sent by the Amazon SDK, meant to be read only by developers. Essentially, to differentiate them, we would need to create a HumanFriendlyException class, and use this class in all places where an error with a human-friendly explanation is available.

This approach is difficult to scale to a large body of code like IVAAP’s. And the IVAAP Data Backend is not just code, it also comes with a large set of third-party libraries that have their own idea of how to communicate errors. To make matters worse, It’s very common for developers to do this:


    try {

             // do something here

        } catch (Exception ex) {

            throw new RuntimeException(ex);

        }


This handling wraps the exception, making it difficult to catch by the caller. A “better” implementation would be:


try {

             // do something here

       } catch (HumanFriendlyException ex) {

            throw ex;

        } catch (Exception ex) {

            throw new RuntimeException(ex);

        }


While this is possible to enforce this style for the entirety of IVAAP’s code, you can’t do this for third party libraries calling IVAAP’s code.

Another issue with Java exceptions is that they tend to occur at a low-level, where very little context is known. If a service needs to read a local file, a message “Can’t read file abc.txt” will only be relevant to end users if the primary function of the service call was to read that file. If reading this file was only accessory to the service completion, bubbling up an exception about this file all the way to the end-user will not help.

To provide human-friendly error messages, IVAAP uses a layered approach instead:

  • High level code that catches exceptions reports these exceptions with a human friendly message to a specific logging system
  • When exceptions are thrown in low level code, issues that can expressed in a human friendly way are also reported to that same logging system

With this layered approach where there is a high-level “catch all”, IVAAP is likely to return relevant human friendly errors for most service calls. And the quality of the message improves as more low-level logging is added. This continuous improvement effort is more practical than a pure exception-based architecture because it can be done without having to refactor how/when Java exceptions are thrown or caught. 

To summarize, the architecture of IVAAP avoids using Java exceptions when human-friendly error messages can be communicated. But this is not just an architecture where human-friendly errors use an alternate path to bubble up all the way to the user. It has some reactive elements to it.

For example, if a user calls a backend service to access a dataset, and this dataset fails to load, a 404/Not Found HTTP status code is sent by default with no further details. However, if a human friendly error was issued during the execution of this service, the status code changes to 500/Internal Server Error, and the content of the human friendly message is included in the JSON output of this service. This content is then picked up by the HTML5 client to show to the user. I call this approach “reactive” because unlike a classic logging system, the presence of logs modifies the visible behavior of the service.

With the 2.7 release of IVAAP, we created two categories of human friendly logs. One is connectivity. When a human friendly connectivity log is present, 404/Not Found errors and empty collections are reported with a 500/Internal Server Error HTTP status code. The other is entitlement. When a human friendly entitlement log is present, 404/Not Found errors and empty collections are reported with a 403/Forbidden HTTP status code.

The overall decision on which error message to show to users belongs to the front-end. Only the front-end knows the full context of the task a user is performing. The error handling in the IVAAP Data Backend provides a sane default that the viewer can elect to use, depending on context. OSDU is one of the deployments where the error handling of the data backend is key to the user experience. The OSDU platform has ingestion workflows outside of IVAAP, and with the error reporting capabilities introduced in 2.7, IVAAP becomes a much more effective tool to QA the results of these workflows.

For more information on INT’s newest platform, IVAAP, please visit int.flywheelstaging.com/products/ivaap/


Filed Under: IVAAP Tagged With: data, ivaap, java, SDK

Aug 22 2017

How to Create Interactive Slideshows (VIDEO)

Presenting data to clients regularly poses many challenges, especially considering that today’s datasets are likely to exceed a petabyte or more. Presentations made with tools like PowerPoint may take hours to create, are instantly obsolete, and frequently don’t fully answer your clients’ questions.

With one simple plugin, INTViewer transforms the art of showing data to your clients by combining the simplicity of a slideshow with the power of live data.

Quick tip: Check out our INTViewer slideshow tutorial to get started!


Create, Share, and Standardize Presentations

The INTViewer slideshow plugin streamlines how your company presents data to potential customers.

Data managers can create slideshows in INTViewer and share them with their colleagues.

Large datasets can be transferred to laptops without any loss of definition using the lattice decimation plugin, making INTViewer slideshows portable.

This new presentation medium saves time and can help standardize how your sales team presents data, while leaving enough flexibility to answer customer questions.

Easy to Learn, Easy to Use

Presentations built using INTViewer work just like other presentation software—once you load the slideshow, press play to start, then press the Next button to go from one slide to another.

Create slideshows easily with INTViewer.

The slideshow window allows you to jump to a different slide without losing context.

2D-map-lines
This slide shows all of the lines at once.
verify-data-easily
The next slide shows the map and a cross-section of the highlighted 2D line.
Manipulating the data is incredibly easy. For example, to verify the definition of your data, you can zoom in just by holding the shift key and drawing a box around the section you want to view.

And to investigate a problematic area, you can view a spectrum analysis with just one click (S+draw a box).

seismic-analysis

Ready to make your presentations interactive?

For more information about INTViewer, check out our other blogs, visit the INTViewer product page, or contact us for a free trial.


Filed Under: INTViewer Tagged With: data, INTViewer, presentation, slideshow

Footer

Solutions

  • Real-Time Visualization
  • Visualization Components
  • New Energy Visualization
  • OSDU Visualization
  • Machine Learning
  • Developer Tools
  • Cloud Partners
  • Customer Success Stories

Products

  • IVAAP
  • GeoToolkit
  • INTViewer
  • IVAAP Demos
  • GeoToolkit Demos

About

  • News
  • Events
  • Careers
  • Management Team

Resources

  • Blog
  • FAQ

Support

  • JIRA
  • Developer Community

Contact

INT logo
© 1989–2024 Interactive Network Technologies, Inc.
Privacy Policy
  • Careers
  • Contact Us
  • Search

COPYRIGHT © 2025 INTERACTIVE NETWORK TECHNOLOGIES, Inc