• Skip to main content
  • Skip to footer

INT

Empowering Visualization

COMMUNITY BLOG
CONTACT US SUPPORT
MENUMENU
  • Solutions
    • Overview
    • Real-Time Visualization
    • Visualization Components
    • New Energy Visualization
    • OSDU Visualization
    • Machine Learning
    • Developer Tools
    • Cloud Partners
  • Products
    • IVAAP™
          • SOLUTIONS

            Real-Time Visualization

            OSDU Visualization

            Visualization Components

            New Energy Visualization

            Upstream Data Visualization

          • SUCCESS STORIES

            WEATHERFORD
            Well delivery optimization software

            BARDASZ
            Data management, data quality monitoring

            ANPG / SATEC-MIAPIA
            Virtual data room

            MAILLANCE
            High-performance visualization of ML algorithms

            SEE ALL >

          • SUPPORT

            DEVELOPER COMMUNITY
            Join or log in to the INT Developer Community.

            GET SUPPORT
            Log a ticket for an issue or bug.

            CONTACT US

          • DEMOS

            IVAAP DEMOS
            Cloud-Based Demos

            FIRST TIME HERE?
            Register to access our
            IVAAP demos

    • GeoToolkit™
          • SUCCESS STORIES

            CAYROS
            Field development planning

            TOTALENERGIES
            High-performance large dataset reservoir rendering

            IFP ENERGIES NOUVELLES
            Seismic and structural interpretation validation

            SEE ALL >

          • SUPPORT

            DEVELOPER COMMUNITY
            Join or log in to the INT Developer Community.

            GET SUPPORT
            Log a ticket for an issue or bug.

            CONTACT US

          • DEMOS

            GEOTOOLKIT DEMOS
            Geoscience Demos

    • INTViewer™
          • SUCCESS STORIES

            STRYDE
            Fast seismic QA/QC in the field

            SILVERTHORNE SEISMIC
            Efficient 2D/3D seismic data delivery

            WIRELESS SEISMIC
            Drones, IoT, and Advanced Onsite Seismic Data Validation

            SEE ALL >

          • SUPPORT

            GET SUPPORT
            Log a ticket for an issue or bug.

            CONTACT US

          • PLUG-INS

            EXTEND INTVIEWER
            More than 65 plugins available

  • Demos
    • GeoToolkit Demos
    • IVAAP Demos
  • Success Stories
  • Resources
    • Blog
    • Developer Community
    • FAQ
    • INT Resources Library
  • About
    • Overview
    • News
    • Events
    • Careers
    • Meet Our Team
    • About INT

data storage

Jul 16 2020

Jumpstart the Development of Your Next Cloud Application with GeoToolkit.JS and INTGeoServer

The Oil and Gas industry is turning to the cloud for its digital transformation. In the race to revolutionize E&P, companies are faced with a chicken-and-egg problem:

  • How to build cloud-based applications when the data is still within the confines of the company network?
  • Why move to the cloud when there are no applications that are able to use this data?

INT has been a long-time pioneer by providing JavaScript components that empower developers to build geoscience applications that run in a browser. The GeoToolkit.JS libraries cut years of development time for any company creating a new application or replacing a legacy system. However, the added value of this kind of application is not just in accessing and visualizing geoscience data, it’s also in the integration of the company’s knowledge within this application.

While GeoToolkit.JS provides the tools to visualize geoscience data, INTGeoServer provides the tools to access remote data. This server has been designed to serve seismic and well data efficiently to web clients. It uses the HTTP protocol and works natively with your existing files (such as SEG-Y, SEP, and LAS). In just a few clicks, you can have a running instance of INTGeoServer, upload files to the cloud, and visualize them immediately with GeoToolkit.JS.

Most customers using INTGeoServer elect to install several instances. To work efficiently with seismic data, INTGeoServer needs to be close to that data. Since E&P companies have their data scattered all over the globe, so are the installations of INTGeoServer, allowing access to datasets from multiple sources in one application. In a classic configuration, data ubiquity is typically achieved by deploying worldwide file systems. INTGeoServer optimizes remote data access by applying several techniques that networks cannot use: only sending the data that the GeoToolkit.JS client needs through the network, limiting the round trips, and compressing the data leveraging similarities between adjacent traces.
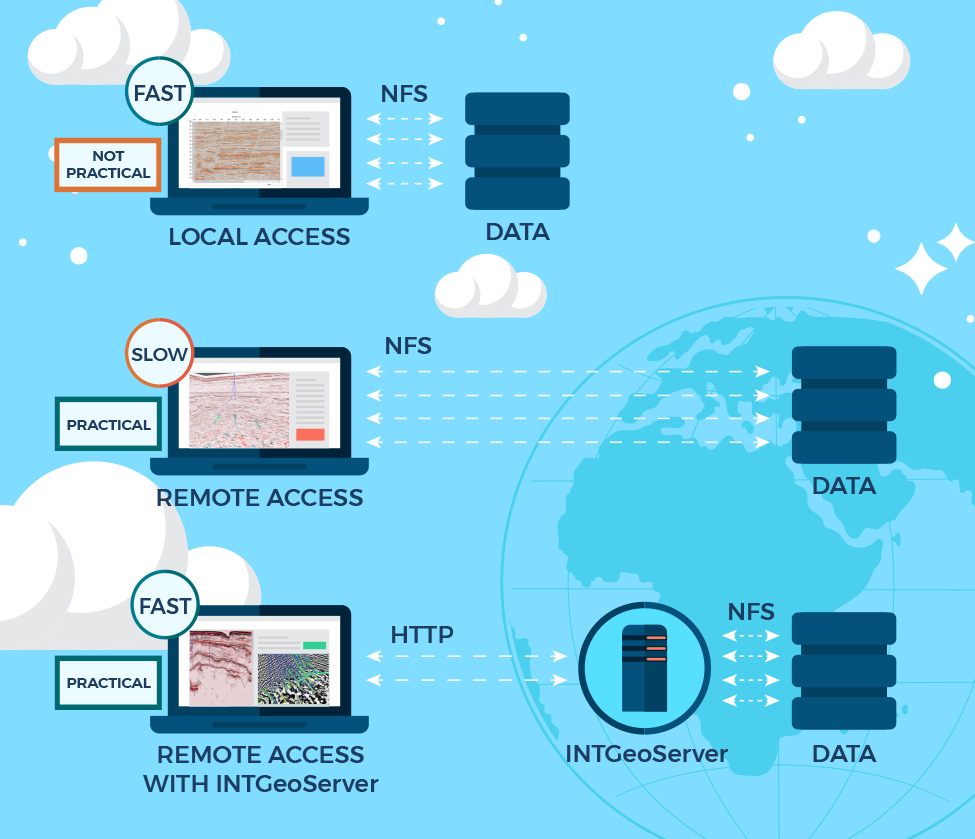
 
INTGeoServerNFSGraphic2
 
GeoToolkit.JS has a built-in API to access INTGeoServer instances. It only takes a few lines of code to program a JavaScript application that will read remote data and visualize it. As a result, programmers are free to focus on the added value of their application.

INTGeoServer also offers a nice transition from classic file systems to cloud-based storage. From the perspective of the web client, the code is storage-agnostic. While a company works on migrating its data to the cloud, its developers can use instances of INTGeoServer that are bound to the company network. Once the cloud is ready, no changes to the application are required. You do not need to decide in advance which cloud provider will host your data. INTGeoServer works with Amazon S3, Microsoft Azure Blob Storage, and Google Cloud Storage. If your application serves data from multiple vendors, you can let each vendor choose their own cloud.

GeoToolkit.JS is meant to empower developers. It provides ready-to-use components that can be customized by developers outside of INT. Similarly, INTGeoServer is a platform. It has an API allowing you to add your own data formats, your own security, and your own science. As the audience of your application grows, you might elect to implement your own data server. INTGeoServer facilitates this future transition by documenting the HTTP protocol it implements. You are free to implement your own version of this protocol, keeping your JavaScript web application running without requiring any changes. In this particular scenario, INTGeoServer gives you a definitive time-to-market advantage.

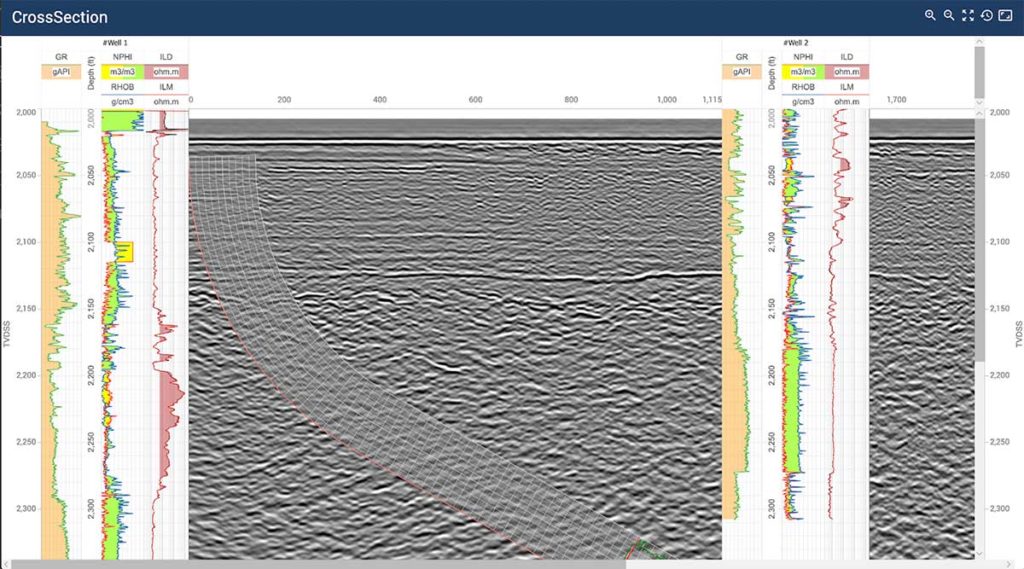
GeoToolkit.JS allows requesting seismic data, log curves, trajectories and horizons form INTGeoServer. The following screenshot displays a cross-section display built with data located on INTGeoServer.

cross-section

LogCurve can be requested using a simple REST API from INTGeoServer and visualized inside WellLogWidget or MultiWellWidget.

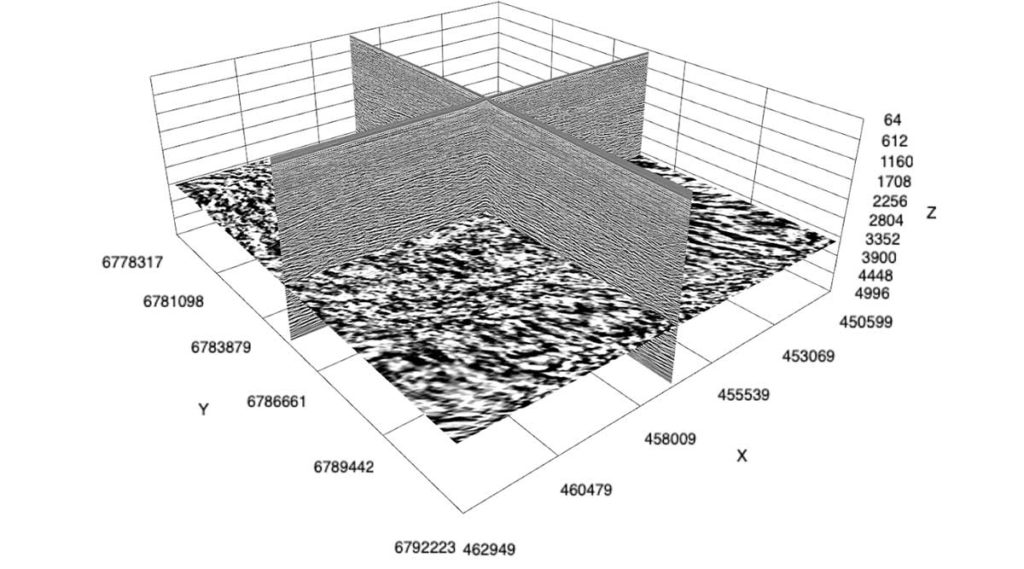
Seismic data in different formats like SEG-Y, SEG-D, SU, and others can be indexed by a utility provided with INTGeoServer, and GeoToolkit.JS can leverage it using sophisticated queries. It is easy to request seismic sections using RemoteSeismicDataSource and specify an arbitrary path or INLINE and XLINE to get data located in cloud or private storage. Moreover, the seismic volume can be visualized in 3D with the Carnac3D module of GeoToolkit.JS.

crossline

As the industry continues to shift towards a digital transformation, more and more E&P companies will migrate their data to the cloud. And with the support of GeoToolkit.JS and INTGeoServer, it becomes simple and efficient to integrate, access, and visualize a company’s data within an application in the cloud.

For more information about GeoToolkit and INTGeoServer, visit the GeoToolkit product page or contact us for a free trial.
Filed Under: GeoToolkit, INTGeoServer Tagged With: cloud, data storage, geotoolkit, INTGeoServer

Dec 01 2017

How to Improve Performance and Reduce Latency of Your Geoscience Data

Storing and accessing large, sometimes sensitive geoscience data is one challenge many top E&P companies face.

Local access is great, but not every user in the world can have local access to the same data. Replication is an option, but with the size of seismic datasets reaching terabytes, this is not practical. In the real world, users only have access to a limited set of local data.

Common Solution Leads to Performance Issues

Many companies store data all over the world. The common infrastructure to allow ubiquitous access to data is to share these files using NFS, a well-known distributed file system protocol used by Linux-based servers.

The issue with NFS is that it is a “chatty” protocol: Many messages are sent back and forth between the client and the server. This is fine when all machines are physically close to each other, but the further away they get, the more latency you introduce. As a result, performance degrades.

NFS is also essentially transparent to the software using it. Some software, like INTViewer, doesn’t “know” that your data is remote, so it can’t optimize its data fetching strategy to the characteristics of your infrastructure. Actually, for seismic data, it assumes that access to individual traces is fast.

A Better Option

This is where INTGeoServer comes into play. Access to data hosted on INTGeoServer—a server with a modern architecture that uses web services to stream geoscience data—is optimized so that there is a limited number of back-and-forth messages. In other words, by installing INTGeoServer next to your data, you make this data accessible from remote places as if it were local.

INTGeoServerNFSGraphic2

To visualize any geoscience file in INTViewer, simply drag and drop that file from the file system to INTViewer’s main window and its content appears automatically. From this experience, it might seem that INTViewer is tied to the file system where it resides, meaning it can only read data from that file system. While this is a common use case, using INTGeoServer removes the requirement to have INTViewer and your data on the same file system.

From an INTViewer user point-of-view, the protocol used to access the data doesn’t change the interaction—the visualizations are the same, the analysis tools work the same way. From a system administrator point of view, however, the burden of maintaining worldwide NFS shares is lifted. And the benefit of accessing that data in larger chunks is that the performance profile improves substantially.

For more information about INTViewer and INTGeoServer, visit the INTViewer product page, or contact us for a free trial.


Filed Under: Uncategorized Tagged With: cloud, data storage, INTGeoServer, INTViewer

Footer

Solutions

  • Real-Time Visualization
  • Visualization Components
  • New Energy Visualization
  • OSDU Visualization
  • Machine Learning
  • Developer Tools
  • Cloud Partners
  • Customer Success Stories

Products

  • IVAAP
  • GeoToolkit
  • INTViewer
  • IVAAP Demos
  • GeoToolkit Demos

About

  • News
  • Events
  • Careers
  • Management Team

Resources

  • Blog
  • FAQ

Support

  • JIRA
  • Developer Community

Contact

INT logo
© 1989–2024 Interactive Network Technologies, Inc.
Privacy Policy
  • Careers
  • Contact Us
  • Search

COPYRIGHT © 2025 INTERACTIVE NETWORK TECHNOLOGIES, Inc