• Skip to main content
  • Skip to footer

INT

Empowering Visualization

COMMUNITY BLOG
CONTACT US SUPPORT
MENUMENU
  • Solutions
    • Overview
    • Real-Time Visualization
    • Visualization Components
    • New Energy Visualization
    • OSDU Visualization
    • Machine Learning
    • Developer Tools
    • Cloud Partners
  • Products
    • IVAAP™
          • SOLUTIONS

            Real-Time Visualization

            OSDU Visualization

            Visualization Components

            New Energy Visualization

            Upstream Data Visualization

          • SUCCESS STORIES

            WEATHERFORD
            Well delivery optimization software

            BARDASZ
            Data management, data quality monitoring

            ANPG / SATEC-MIAPIA
            Virtual data room

            MAILLANCE
            High-performance visualization of ML algorithms

            SEE ALL >

          • SUPPORT

            DEVELOPER COMMUNITY
            Join or log in to the INT Developer Community.

            GET SUPPORT
            Log a ticket for an issue or bug.

            CONTACT US

          • DEMOS

            IVAAP DEMOS
            Cloud-Based Demos

            FIRST TIME HERE?
            Register to access our
            IVAAP demos

    • GeoToolkit™
          • SUCCESS STORIES

            CAYROS
            Field development planning

            TOTALENERGIES
            High-performance large dataset reservoir rendering

            IFP ENERGIES NOUVELLES
            Seismic and structural interpretation validation

            SEE ALL >

          • SUPPORT

            DEVELOPER COMMUNITY
            Join or log in to the INT Developer Community.

            GET SUPPORT
            Log a ticket for an issue or bug.

            CONTACT US

          • DEMOS

            GEOTOOLKIT DEMOS
            Geoscience Demos

    • INTViewer™
          • SUCCESS STORIES

            STRYDE
            Fast seismic QA/QC in the field

            SILVERTHORNE SEISMIC
            Efficient 2D/3D seismic data delivery

            WIRELESS SEISMIC
            Drones, IoT, and Advanced Onsite Seismic Data Validation

            SEE ALL >

          • SUPPORT

            GET SUPPORT
            Log a ticket for an issue or bug.

            CONTACT US

          • PLUG-INS

            EXTEND INTVIEWER
            More than 65 plugins available

  • Demos
    • GeoToolkit Demos
    • IVAAP Demos
  • Success Stories
  • Resources
    • Blog
    • Developer Community
    • FAQ
    • INT Resources Library
  • About
    • Overview
    • News
    • Events
    • Careers
    • Meet Our Team
    • About INT

data visualization

Aug 10 2023

INT Simplifies Machine Learning and Processing and Augments Analytics Capabilities with Latest Release of IVAAP Data Visualization Platform

The latest release of IVAAP by INT introduces an array of exciting new features and enhancements, providing users with unparalleled capabilities to extract deeper insights from their subsurface data.

Houston, TX — August 10, 2023 — INT announced today the launch of IVAAP™ 2.11, the latest version of our Universal Cloud Data Visualization Platform. With powerful features and enhanced capabilities, IVAAP™ 2.11 takes subsurface data exploration and visualization to new heights, empowering users to make critical decisions with confidence and efficiency.

Some of the key highlights include: 

  1. External Workflows to Support Machine Learning and Data Processing: With IVAAP™ 2.11, users can now seamlessly integrate external processing workflows and ML capabilities, unlocking the true potential of their data through advanced analytics and data automation.
  2. Unit System Management: IVAAP™ introduces Unit System Management, offering users enhanced control over data consistency and clarity by efficiently managing unit conversions.
  3. WellLog Enhancements: WellLog module sees significant improvements, including support for stacked patterns curve, curve editing, lithology editing, and discrete raster files.
  4. Dynamic Range Intervals: Selected depth intervals can be highlighted in multiple widgets like cross-plot, pie charts, histograms, and more. Moving intervals along the depth are reflected automatically across all widgets.
  5. OSDU™ Data Platform Compatibility: IVAAP now offers full support for perforation intervals, stratigraphic columns, well-core images, hole sections, and collections on the OSDU Data Platform. Additionally, KPIs are now available on the IVAAP Home page.

“IVAAP 2.11 represents a significant milestone in our journey towards providing the oil and gas industry with the most advanced and comprehensive data visualization platform. With the introduction of external workflow support for machine learning and data processing and full compatibility with the OSDU Data Platform, IVAAP continues to empower geoscientists and engineers to explore, visualize, and automate their data like never before,” said Hugues Thevoux, VP of Cloud Solutions at INT. “This release underscores our commitment to delivering cutting-edge solutions that drive efficiency, foster innovation, and enable our clients to make smarter decisions with confidence.”


IVAAP 2.11 is now available for all existing users. To experience the power of IVAAP or to schedule a personalized demo, visit int.com/demo-gallery/ivaap/ or contact our sales team at intinfo@int.com.

To learn more about IVAAP 2.11, please visit int.com/products/ivaap/ or contact us at intinfo@int.com.

Read the IVAAP 2.11 Release Notes.
Read the press release on PRWeb.

____________

ABOUT IVAAP:

IVAAP™ is a Universal Cloud Data Visualization Platform where users can explore domain data, visualize 2D/3D G&G data (wells, seismic, horizons, surface), and perform data automation by integrating with external processing workflows and ML.

ABOUT INT:

INT software empowers the largest energy and services companies in the world to visualize their complex subsurface data (seismic, well log, reservoir, and schematics in 2D/3D). INT offers a visualization platform (IVAAP) and libraries (GeoToolkit) developers can use with their data ecosystem to deliver subsurface solutions (Exploration, Drilling, Production). INT’s powerful HTML5/JavaScript technology can be used for data aggregation, API services, and high-performance visualization of G&G and petrophysical data in a browser. INT simplifies complex subsurface data visualization.

For more information about IVAAP or INT’s other data visualization products, please visit https://int.flywheelstaging.com.

INT, the INT logo, and GeoToolkit are trademarks of Interactive Network Technologies, Inc., in the United States and/or other countries.
Filed Under: IVAAP, Press Release, Uncategorized Tagged With: cloud, Data Processing, data visualization, ivaap, machine learning, ml, OSDU, welllog

May 08 2023

Production Geology Workflows with IVAAP

In this blog post, we will explore how IVAAP, a platform developed by INT, is revolutionizing the production geology workflow for geoscientists. GeomodL International, a consultancy based in the UAE, specializes in this field and has been utilizing IVAAP to enhance its production geology workflow. In this blog post, Raffik Lazar, founder and principal at GeomodL International, will share his insights on how IVAAP has helped streamline their production geology workflow, allowing them to visualize and cross-visualize various data sets in a single location, leading to better decision-making, cost-saving, and optimization of development plans.

Reservoir Lifecycle and Production Geology Workflow 

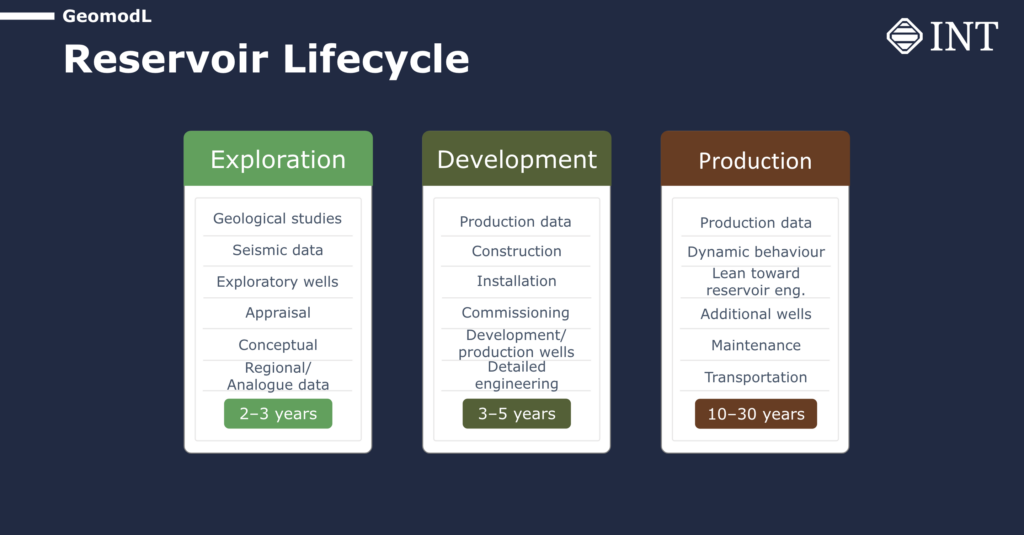
As many of you know, the reservoir lifecycle typically starts with exploration, which can take two to three years. During this phase, geoscientists rely heavily on seismic data to understand the basin’s geology. Exploration wells are drilled, and projections of the reservoir are developed. Once an asset is identified to be commercially relevant, the project transitions into the development phase, which can take three to five years on average. During this phase, wells are drilled, and surface structures are commissioned. Production data starts to become available, providing insights into the behavior of the reservoir. The production phase, which can last for 10 to 30 years, involves drilling additional wells within the same field based on the dynamic behavior of the reservoir and refining the static model with the help of geology and geophysics (G&G) data and production data.

pic 1_GeomodL

Challenges in Production Geology Workflow

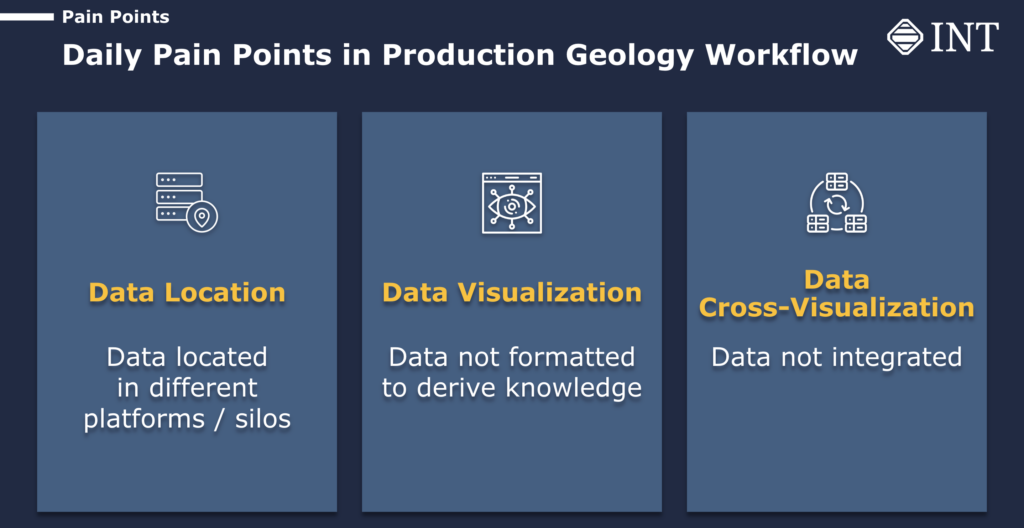
One of the challenges in the production geology workflow is the fragmented nature of data, which is typically located in different platforms or silos. Production data is often in Excel formats, while G&G data may be stored in Petrel or other data sets, making it difficult to visualize and analyze the data in an integrated manner. Additionally, the time-consuming process of manually cross-visualizing data from different sources hinders the geoscientists’ ability to gain insights and make informed decisions quickly.

Pic 2_GeomodL

The Power of Data Visualization with IVAAP 

IVAAP, a web-based platform developed by INT, has emerged as a game-changer in production geology. It provides geoscientists with a single platform to access and visualize various data sets, including production data, G&G data, and 3D models, all in one location. This eliminates the need to manually search for and integrate data from different sources, saving time and effort. With IVAAP, geoscientists can easily cross-visualize data, allowing them to gain insights far more effectively than looking at each data set in isolation. The ability to visualize data in a comprehensive and integrated manner enables geoscientists to understand the behavior of the reservoir better and make informed decisions for development plans, leading to cost-saving and optimization of resources.

Pic 3_GeomodL

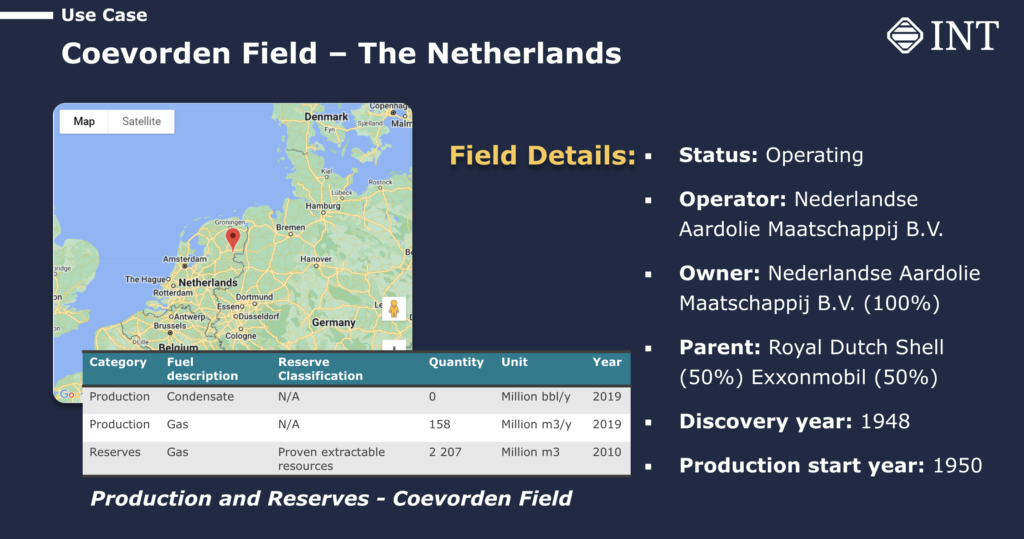
Case Study: Coevorden Field 

To illustrate the power of IVAAP in streamlining the production geology workflow, let’s look at the case study of the Coevorden Field, a gas field in the Netherlands. This field is still operating as a joint venture between Shell and ExxonMobil and is considered a very mature field with significant gas reserves. GeomodL International used IVAAP to analyze the production data, G&G data, and 3D models of the Coevorden Field.

Pic 4_GeomodL

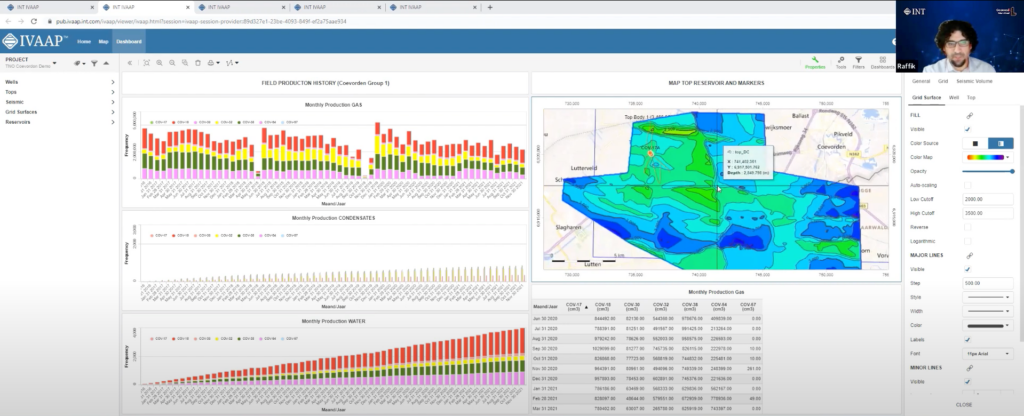
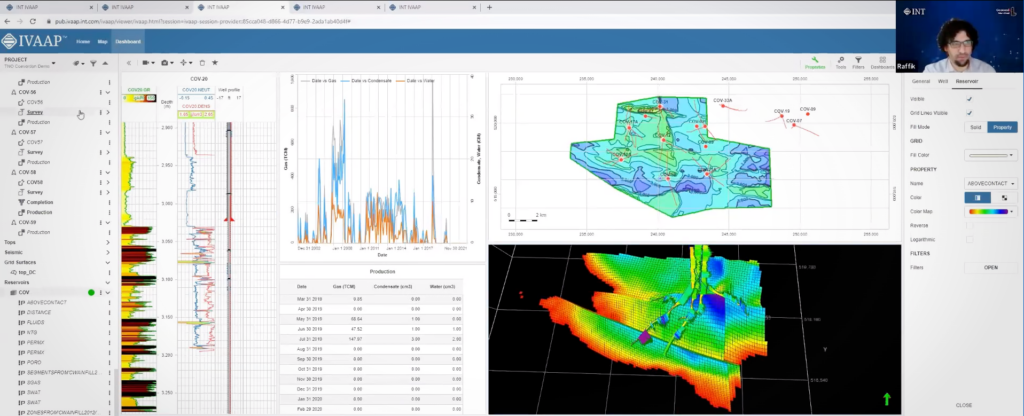
IVAAP is a web-based platform accessible through a modern browser that supports HTML5 and WebSockets, eliminating the need for specific hardware or a powerful machine to perform complex analyses. Upon launching IVAAP, users are greeted with dashboards that can be opened individually to access various tools and functionalities. The dashboards are organized with data on the left, parameters and settings on the right, and widgets such as charts, maps, and 3D windows in the middle.

The first dashboard that proves beneficial for geologists is the production dashboard. It allows users to visualize the performance of wells in the field over time. Users can adjust settings such as the time period and view production data for individual wells or groups of wells. For example, users can track the cumulative production of a group of wells on a monthly or yearly basis and even compare gas production with condensate and water production. The dashboard provides interactive tools to manipulate and analyze the data, such as adjusting time periods to understand the production trends in the field comprehensively.


Pic X_GeomodL

Watch the complete use case here.


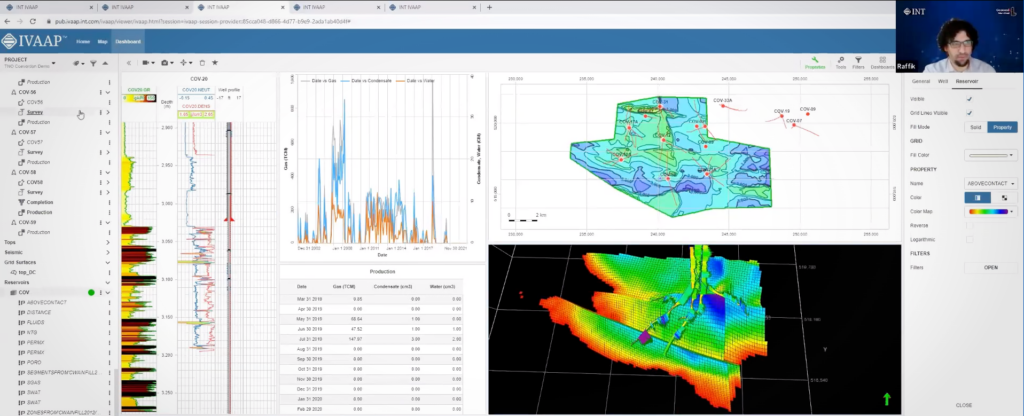
The second dashboard in IVAAP provides more detailed well-level information. Users can access individual well data, including production curves, well logs, and 3D models of the reservoir. The 3D window allows for seamless zooming in and out, and users can interact with the well logs and maps in a synchronized manner. For example, users can view the location of perforations and casing shoes in the well schematic and simultaneously see the corresponding changes in the well logs. This integrated approach allows geologists to analyze production data in the context of the reservoir model, enabling a more comprehensive understanding of the field’s performance.

One of the notable features of IVAAP is its ability to provide a holistic view of the field’s data under the same roof. Geologists and reservoir engineers can access 3D models, top reservoir maps, well schematics, well logs, and production data in one platform. This integrated approach streamlines the analysis process and allows for a more efficient workflow, saving time and resources.


Pic 3_GeomodL

Watch the complete use case here.

As the industry continues to evolve and face new challenges, platforms like IVAAP provide a cutting-edge solution for geoscientists to manage complex data and make informed decisions effectively. By harnessing the power of technology, geoscientists can unlock the full potential of their reservoirs, leading to improved exploration, appraisal, and development strategies. With IVAAP, geoscientists can confidently navigate the reservoir life cycle from exploration to mature fields and drive greater success in oil and gas operations, all from a single point of access.

Visit us online at int.com/ivaap for a preview of IVAAP or for a demo of INT’s other data visualization products. 

For more information, please visit int.flywheelstaging.com or contact us at intinfo@int.com.

____________

ABOUT INT

INT software empowers energy companies to visualize their complex data (geoscience, well, surface reservoir, equipment in 2D/3D). INT offers a visualization platform (IVAAP) and libraries (GeoToolkit) that developers can use with their data ecosystem to deliver subsurface solutions (Exploration, Drilling, Production). INT’s powerful HTML5/JavaScript technology can be used for data aggregation, API services, and high-performance visualization of G&G and energy data in a browser. INT simplifies complex subsurface data visualization.

INT, the INT logo, and IVAAP are trademarks of Interactive Network Technologies, Inc., in the United States and/or other countries.


Filed Under: IVAAP Tagged With: data, data visualization, drilling, Geology, Geoscientists, ivaap, Production, Production geology

Jul 06 2021

Rethinking ML Integration to Deliver a User Experience with a True End-to-End Geoscience Workflow

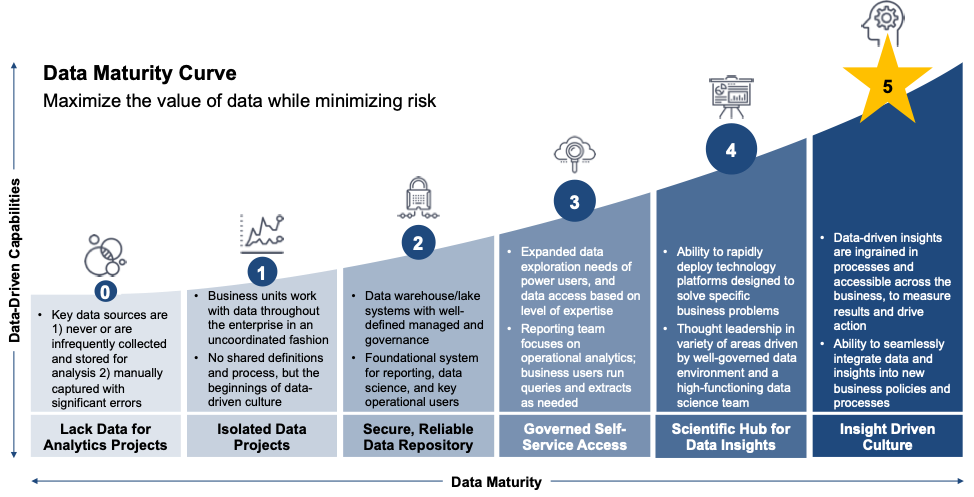
For E&P companies, the next challenge in their digital transformation — once their data has been properly stored, indexed, enriched, and cataloged in the cloud — is to make it available in a collaborative way where users can easily interact with the data through exploration, computation, and analysis. To create this digital workspace, companies must fully integrate machine learning, along with advanced data visualization, in a single platform where users can search, select data from multiple data sources, execute models, and visualize the results.

Accelerating the Transition from R&D to Operations
While many companies have begun the shift toward using machine learning, many have not seamlessly integrated ML. Implementing ML is the goal, but many get stuck along the way, weighed down by cumbersome processes or siloed systems. So the first challenge is transitioning the ML process from R&D to operations, where the model is fully deployed and used by data scientists.

ML-chart
Source: World Wide Technology


In a typical process, once the data is prepared and cleaned, it is split and labeled for training in order to understand whether the model is working properly or not. Then the model is moved into operations, data is fed into it, and finally, the user can see the output. The process from development to production, R&D to operations is very, very slow, even with continuous integration and deployment pipelines. This is where a centralized solution can help to eliminate the need to move data from one system to another or have to build another application to consume, compute, and visualize the data.

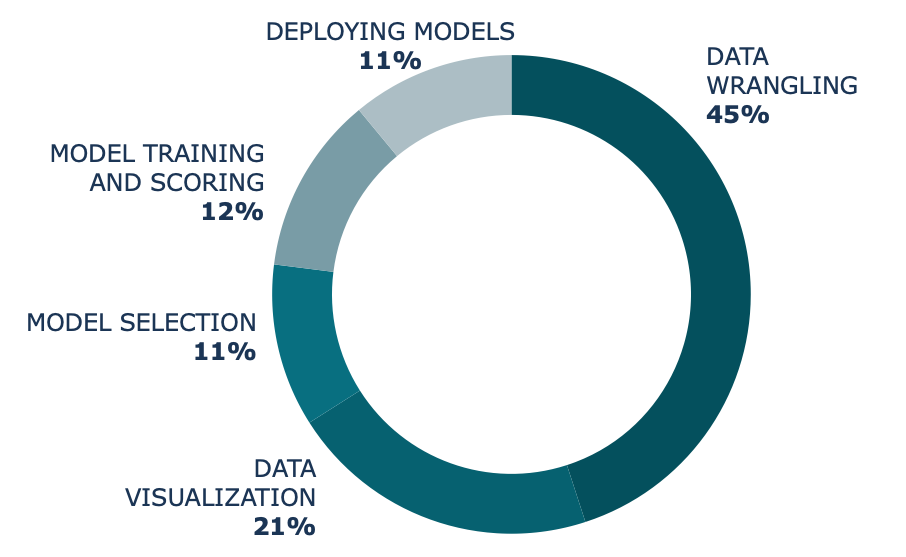
Screen Shot 2021-07-06 at 2.55.27 PM
SOURCE: State of Data Science 2020. Anaconda. www.anaconda.com/state-of-data-science-2020.

The Drivers for Centralizing Data Exploration, ML Execution, and Domain Visualization
Integrating machine learning into geoscience workflows has traditionally posed many challenges for data scientists, from siloed, incomplete data to disjointed, disconnected systems. Even now, once geoscientists spend up to 45% of their time ensuring that the data is uniform, organized, and labeled correctly, they must then switch to another application to execute the model, another to view the results, and yet another to share the results with their team. By combining these processes in one place, companies can get the most from their data — the most accurate models, with the most accurate business insights.


The Emergence of New Visualization Technologies Leveraging ML to Power Data-Driven Decisions
For true ML integration, companies are challenged to rethink the user experience and find a way to utilize a single platform that can simplify this process, from collecting and cleaning data to training and evaluating the model to using the model to power data-driven business decisions. This is why many companies are looking at “re-platforming” existing apps or simply rebuilding new apps that can combine features spread across multiple applications. However, companies do not need to go down that path anymore with the emergence of a new generation of data visualization cloud-native platforms such as IVAAP.

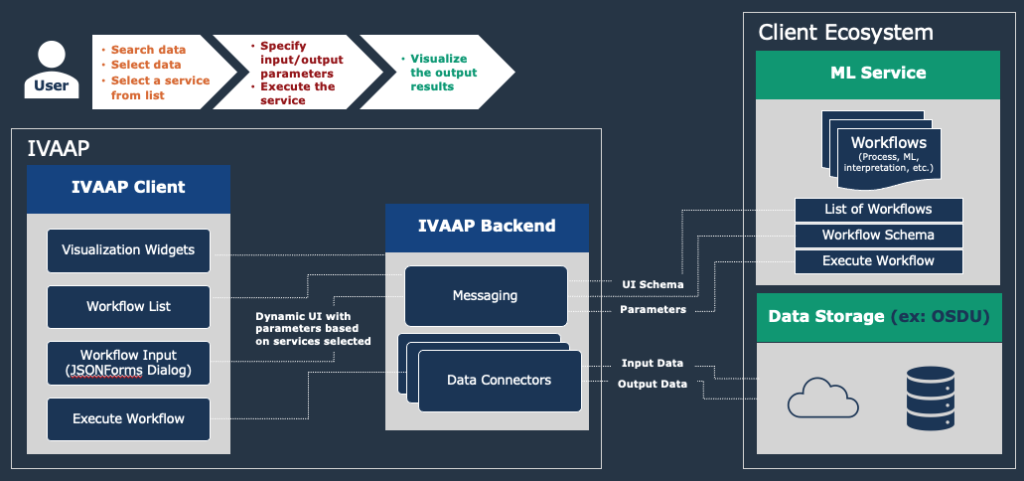
IVAAP is a new way to connect the dots. The cloud-native client is creating a single place for users such as geoscientists and data scientists to conduct all necessary steps in MLOps: data exploration, ML execution, and visualization. The platform offers a digital workspace connecting to the various back-end systems seamlessly for end-end users.

Screen Shot 2021-07-06 at 8.50.54 AM
INT’s IVAAP integrates with ML Service and Data Storage


In the example above, the user can access search functions, data sources, and various ML environments such as AWS SageMaker to create a true end-to-end machine learning integration. Streamlining and simplifying the geoscience workflow starts with the end-user experience: the user can be presented with specific data input/output dynamically based on the processing function or ML programs he is executing. IVAAP’s dynamic UI delivers a powerful way for data scientists to execute ML in geoscience.

If you are interested in learning more, you can also check out the recent AWS/INT webinar for a deeper dive into how the technology works, dynamic UI, and ML integration.

Learn more about IVAAP here or contact us at info@int.com.


Filed Under: IVAAP Tagged With: data visualization, ivaap, machine learning, streamline workflows

Jan 28 2021

How OSDU Can Help Data Management

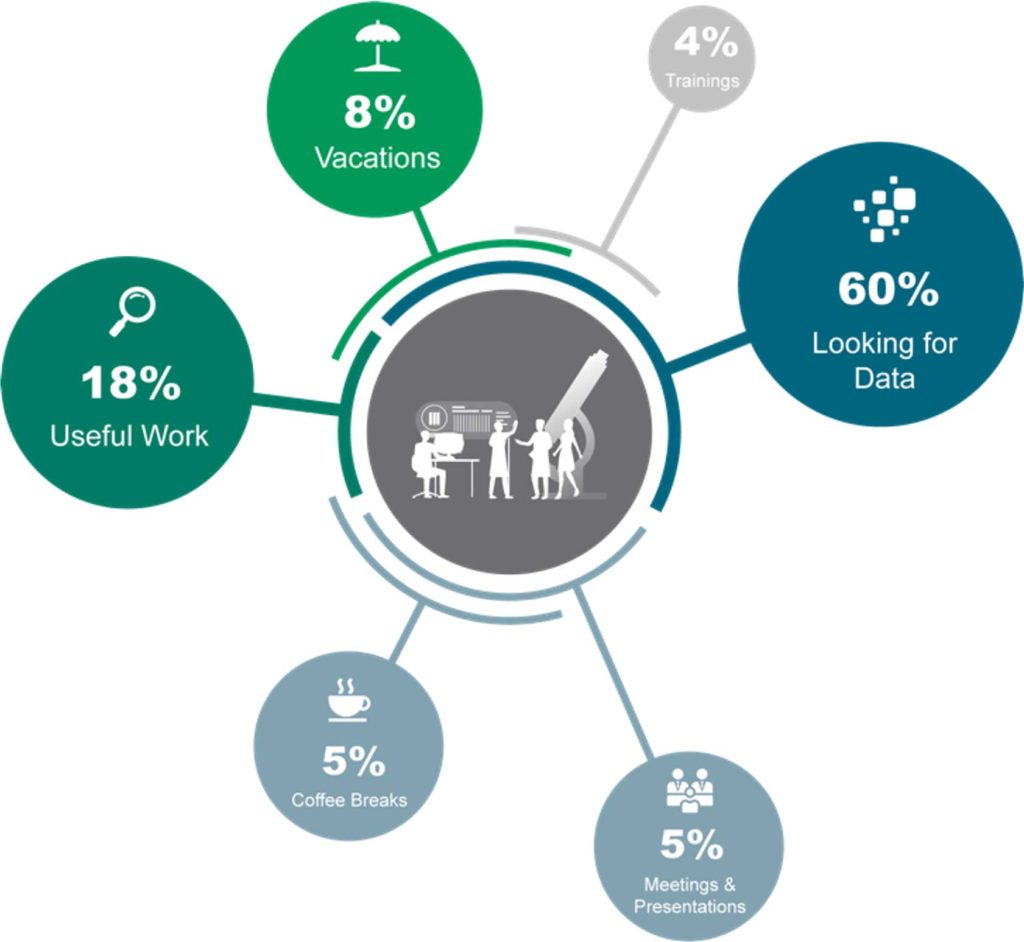
Discussing data management challenges with major oil companies, national oil companies (NOCs), and oil services companies over the last few months, we found that it is still quite difficult to find published metrics about their KPIs. During a recent conversation with an operator, for example, he shared that finding the right data for analysis could take anywhere from one to SEVEN weeks.

data-viz-geo-challenge
Source: Lee C Lawyer Chevron Chief Geophysicist Oil & Gas Journal Nov. 4, 1991, pp 51-52.

Whether afraid releasing this data might expose inefficiencies or simply that the data is proprietary, what is interesting is that this problem persists—multiple people doing the same checks, companies can’t find their data, and what they can find, they don’t trust. For most geologists and geoscientists, data validation—validating, correcting, and verifying data—takes between 30 and 90 percent of their time before they can even begin to use the data. This challenge has become a major blocker as they transition from human analysis to Artificial Intelligence (AI) and Machine Learning (ML) to automate tasks and decisions.

The problems lie in how application systems have been built over time: in silos. To quote Teradata’s Jane McConnell in her recent blog post on OSDU, “Keeping data in separate systems with separate indexes, separate master data management issues, and often separate physical hardware, only means extra work, master data management problems, and unnecessary hassle when we try to bring the data together so we can analyze it as a whole.”

So, how do we fix it? OSDU data standardization with IVAAP data visualization is one approach.

What Is OSDU?

The Open Subsurface Data Universe™ (OSDU) Forum is an Industry Forum formed to establish an open subsurface Reference Architecture. OSDU is created around a simple idea: can you find, use, and trust your data? 

The objective is to move from a traditional model based on multiple types of data into a single integrated data model. The digital transformation approaches data as an asset that can be used throughout various stages of the workflow and applications, decoupled of the native workflow and application. 

data-viz-silos

The OSDU mission is to establish an open subsurface Reference Architecture as follows:

  • A cloud-native data platform reference architecture, with usable implementations for Microsoft Azure, Amazon AWS, and Google GCP
  • Application Standards (APIs) to ensure that all applications (microservices), developed by various parties, can run on any OSDU data platform
  • Leverage Industry Data Standards for frictionless integration and data access

OSDU Value Proposition: Access and Acceleration

To increase data accessibility, data can no longer be kept siloed. Companies must now accelerate their digital transformation by taking advantage of the growing OSDU marketplace and the rapid adoption of new solutions using OSDU APIs.

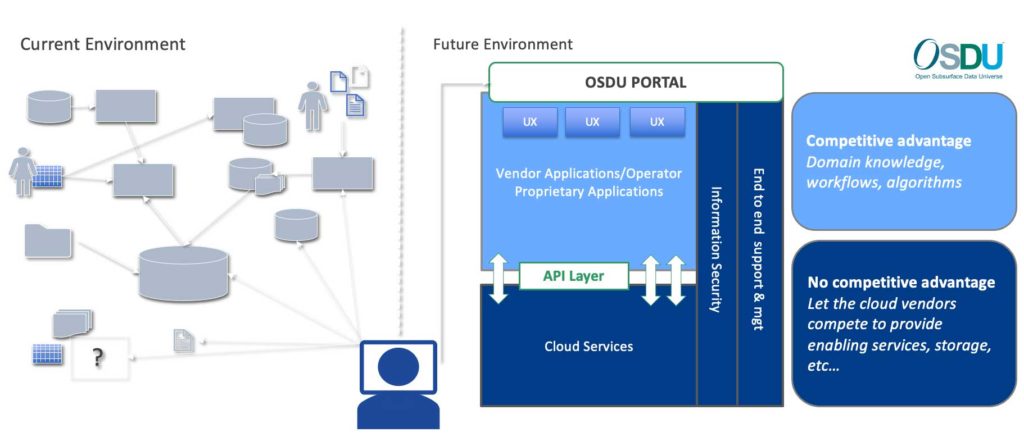
osdu-environment
OSDU standardizes and secures data currently spread across applications in different formats.
 
The OSDU data platform architecture helps separate data from its native application—from the workflow and from the storage infrastructure. It is indexed, discoverable, and consumable. This evolution is critical as we automate analysis with AI, ML, etc. Digitalization requires consistency and confidence in all data and standards for data and metadata to take out the guesswork.

Improve Findability, Collaboration, and Data Exchange

To improve not only data management workflows, but also to increase collaboration across teams, the smart approach is to combine a common data standard (OSDU) and leverage enterprise viewer technology (IVAAP).

Data Standardization: Findability and Discovery

A common data standard improves findability, using powerful search engines to reduce time to find the right data from weeks to days. When possible, it leverages data lakes to access all data from a single repository or a hybrid model to aggregate data in place. Removing the bottleneck of ”person dependent” models means immediate access and data discovery with security at the object level.

Data Visualization: Collaboration and Data Exchange

The ability to view multiple sources of data in a single dashboard is a critical piece of the new data management workflow. It makes data exchange easier, enables process optimization and better QC, and translates to better visibility for KPIs. Enabling data selection directly from the search eliminates the need to move data, and aggregating data in a single, shared dashboard means faster collaboration and better decision-making.

Empower Better Data Management

Data management can benefit from a single point of access of all subsurface data, simplifying data exchange, sharing, and consumption. For data managers, OSDU can enable new technology solutions that aggregate data, simplify search, and improve discoverability. Paired with the right subsurface data visualization platform technology, OSDU can pave the way to automate tedious tasks, workflows, and analysis, ultimately providing quicker information to stakeholders for faster decisions.

For more information or for a free demo of IVAAP, visit int.com/products/ivaap/


Filed Under: IVAAP Tagged With: data management, data standards, data visualization, ivaap, OSDU

Jan 19 2021

The Importance of Integrating Visualization and Collaboration in a Digital Transformation Strategy

The oil and gas industry is experiencing significant change. Aging workforces, low oil prices, and pressure to reduce environmental footprint are all forcing E&P companies to rethink how they operate; which is why there is so much interest in embracing digital transformation. But digital transformation is more than the use of new digital technologies to optimize workflows and improve business processes. It is the strategic application of technology, data, and people in order to achieve more desirable business outcomes. 

Digital Transformation in Oil and Gas Is Fueled by New Technologies

  • IoT and drones for data collection
  • The cloud and associated data lakes for data management
  • Real-time data streaming for asset management
  • Machine Learning for analysis

Consider an approach to 3D seismic acquisition using drones and IoT, where real-time visualization of data captured in the field plays a key role in assuring accuracy and the highest quality data possible. 

Seismic acquisition in complex environments with hard-to-access topography, such as dense rainforest, is expensive and hazardous. And too often, the resulting seismic imaging is of less-than-desired quality as well. To address some of these issues, TotalEnergies R&D created the METIS project (Multiphysics Exploration Technology Integrated System), with the objective of improving data quality and speed of data acquisition through real-time quality control and processing. TotalEnergies, in partnership with Wireless Seismic and SAExploration, conducted a seismic acquisition experiment in a remote area of New Guinea, using drones and Wireless Seismic’s Downfall Air Receiver Technology (DARTs). Dropped from large swarms of drones over a targeted area, DART seismic receivers can be an efficient option for gathering data in difficult-to-access areas, but to be effective they must be well-positioned and operational. Therefore, it is necessary to quickly validate the positioning and data quality from the DARTs. 

To confirm that DARTs are positioned correctly, data is captured from each DART receiver during the drop, and proprietary calculations are used to monitor how successful the geophone drop has been. Immediate visualization of the drop analyses is essential to the operation. If any of the DARTs fail to land properly or seismic data is faulty or missing, the system command center can make adjustments in real-time to optimize the acquisition plan. This real-time monitoring and optimization minimize data problems that might otherwise require reshooting parts of the survey: which would be an expensive waste of resources, time, and money.

Effective Collaboration Between Oil Companies and Service Companies Is Required

Effective collaboration does not mean giving up proprietary intellectual property, but users on both sides must be prepared to be flexible and willing to integrate. We can start by making data accessible to all the stakeholders in a project. Too often, information is siloed as various disciplines tend to use their own local systems and work independently. They don’t share ideas and seek advice from each other as much as they should. By getting data out of the local systems and centralizing that data in the cloud, it can be made accessible to anyone who needs it. 

Data also needs to be easier to find. Oftentimes, explorationists spend up to 40% of their time not just searching for data but searching for the right data. We need improved data delivery so that explorationists have the right data at their fingertips when they need it, including better incorporation of real-time data in the decision-making process. We also need to make it possible to integrate disparate data. This will be especially important for effective machine learning, analytics, and advanced visualization.

Adoption of cloud technologies and cloud data lakes services makes it possible to create metadata and indexes which can be used to organize all the data in a project—thereby facilitating intelligent searches and quick access to the exact data needed for analysis and interpretation. Access is greatly simplified when all the data is in one place.  Centralized data, when organized by good metadata and indexing, also makes it easier to integrate disparate data for analytics or machine learning.

A good industry example is the Open Subsurface Data Universe™ (OSDU) Forum, supported by nearly 200 operators and service companies. OSDU was formed to establish an open subsurface data model and reference architecture with implementations for all the major cloud service providers. The OSDU promotes application standards (APIs) to ensure that all applications, developed by various parties, can run on any OSDU data platform. The goal of OSDU is to deliver the same value and services while running on different cloud service providers and in different data centers.

The new architecture and data model standards can then be completed with an application layer that will enable all your data to be accessible from a single place, make data searchable and discoverable, provide tools to integrate domain expert workflows and leverage AI/ML models, and deliver a collaborative work environment with advanced visualization to quickly share information between users and drive better decisions.

User Adoption Is Critical to a Successful Digital Transformation 

To fully benefit from digital transformation, companies must change their way of working. They have to embrace new concepts such as remote workforces and virtual teams – where collaboration between teams is a key to successful projects. Users need to be fully onboarded to understand the functionality and benefits of the new digital processes, and the reasons behind the change. Rethinking software is also a must. Applications must be web-aware and mobile-responsive. And as more millennials come into the workforce, they bring with them an expectation that enterprise applications/systems embed domain expertise and behave as intuitively as the applications they have become used to on their tablets and smartphones.

Strong User Adoption Requires Advanced Visualization and Collaboration 

In order to be effective, digital transformation must be holistic and integrate as much of the workflow as possible.  Productive collaboration among exploration and production teams is too often prevented by a lack of effectively integrated visualization of subsurface data.  This can be mitigated by solutions that enable all your data to be accessible from a single place, searchable, and deliver a collaborative work environment with advanced visualization to quickly share information between users and drive better decisions.  Furthermore, these new solutions can integrate expertise from multiple domains and bring consistency to their workflows by using common visualization components across all their applications—thereby creating a superior single app experience. 

You cannot empower collaboration and improve operational efficiency if you still operate in silos.  The ultimate goal would be a single system, with a mechanism to aggregate and integrate data, built from as many common shared components as possible.  These commonly shared components may come from different local systems or perhaps different vendors.


Filed Under: IVAAP Tagged With: data visualization, digital transformation, oil and gas, subsurface data visualization

  • Page 1
  • Page 2
  • Go to Next Page »

Footer

Solutions

  • Real-Time Visualization
  • Visualization Components
  • New Energy Visualization
  • OSDU Visualization
  • Machine Learning
  • Developer Tools
  • Cloud Partners
  • Customer Success Stories

Products

  • IVAAP
  • GeoToolkit
  • INTViewer
  • IVAAP Demos
  • GeoToolkit Demos

About

  • News
  • Events
  • Careers
  • Management Team

Resources

  • Blog
  • FAQ

Support

  • JIRA
  • Developer Community

Contact

INT logo
© 1989–2024 Interactive Network Technologies, Inc.
Privacy Policy
  • Careers
  • Contact Us
  • Search

COPYRIGHT © 2025 INTERACTIVE NETWORK TECHNOLOGIES, Inc