• Skip to main content
  • Skip to footer

INT

Empowering Visualization

COMMUNITY BLOG
CONTACT US SUPPORT
MENUMENU
  • Solutions
    • Overview
    • Real-Time Visualization
    • Visualization Components
    • New Energy Visualization
    • OSDU Visualization
    • Machine Learning
    • Developer Tools
    • Cloud Partners
  • Products
    • IVAAP™
          • SOLUTIONS

            Real-Time Visualization

            OSDU Visualization

            Visualization Components

            New Energy Visualization

            Upstream Data Visualization

          • SUCCESS STORIES

            WEATHERFORD
            Well delivery optimization software

            BARDASZ
            Data management, data quality monitoring

            ANPG / SATEC-MIAPIA
            Virtual data room

            MAILLANCE
            High-performance visualization of ML algorithms

            SEE ALL >

          • SUPPORT

            DEVELOPER COMMUNITY
            Join or log in to the INT Developer Community.

            GET SUPPORT
            Log a ticket for an issue or bug.

            CONTACT US

          • DEMOS

            IVAAP DEMOS
            Cloud-Based Demos

            FIRST TIME HERE?
            Register to access our
            IVAAP demos

    • GeoToolkit™
          • SUCCESS STORIES

            CAYROS
            Field development planning

            TOTALENERGIES
            High-performance large dataset reservoir rendering

            IFP ENERGIES NOUVELLES
            Seismic and structural interpretation validation

            SEE ALL >

          • SUPPORT

            DEVELOPER COMMUNITY
            Join or log in to the INT Developer Community.

            GET SUPPORT
            Log a ticket for an issue or bug.

            CONTACT US

          • DEMOS

            GEOTOOLKIT DEMOS
            Geoscience Demos

    • INTViewer™
          • SUCCESS STORIES

            STRYDE
            Fast seismic QA/QC in the field

            SILVERTHORNE SEISMIC
            Efficient 2D/3D seismic data delivery

            WIRELESS SEISMIC
            Drones, IoT, and Advanced Onsite Seismic Data Validation

            SEE ALL >

          • SUPPORT

            GET SUPPORT
            Log a ticket for an issue or bug.

            CONTACT US

          • PLUG-INS

            EXTEND INTVIEWER
            More than 65 plugins available

  • Demos
    • GeoToolkit Demos
    • IVAAP Demos
  • Success Stories
  • Resources
    • Blog
    • Developer Community
    • FAQ
    • INT Resources Library
  • About
    • Overview
    • News
    • Events
    • Careers
    • Meet Our Team
    • About INT

geotiff

Jan 26 2022

Raster Log and TIFF Rendering in the Cloud with GeoToolkit.JS

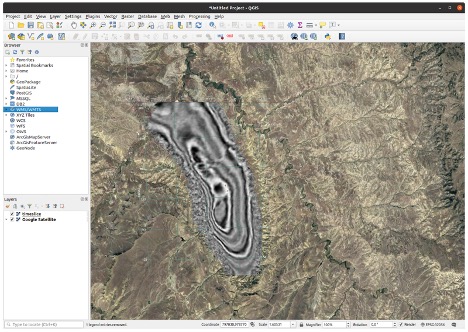
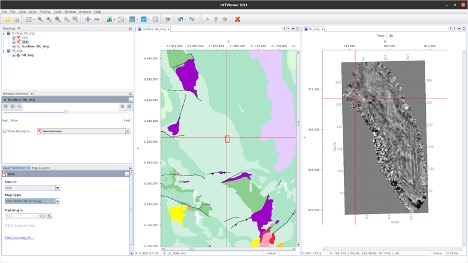
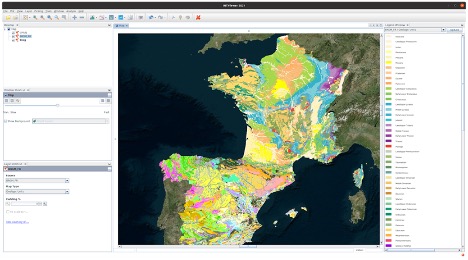
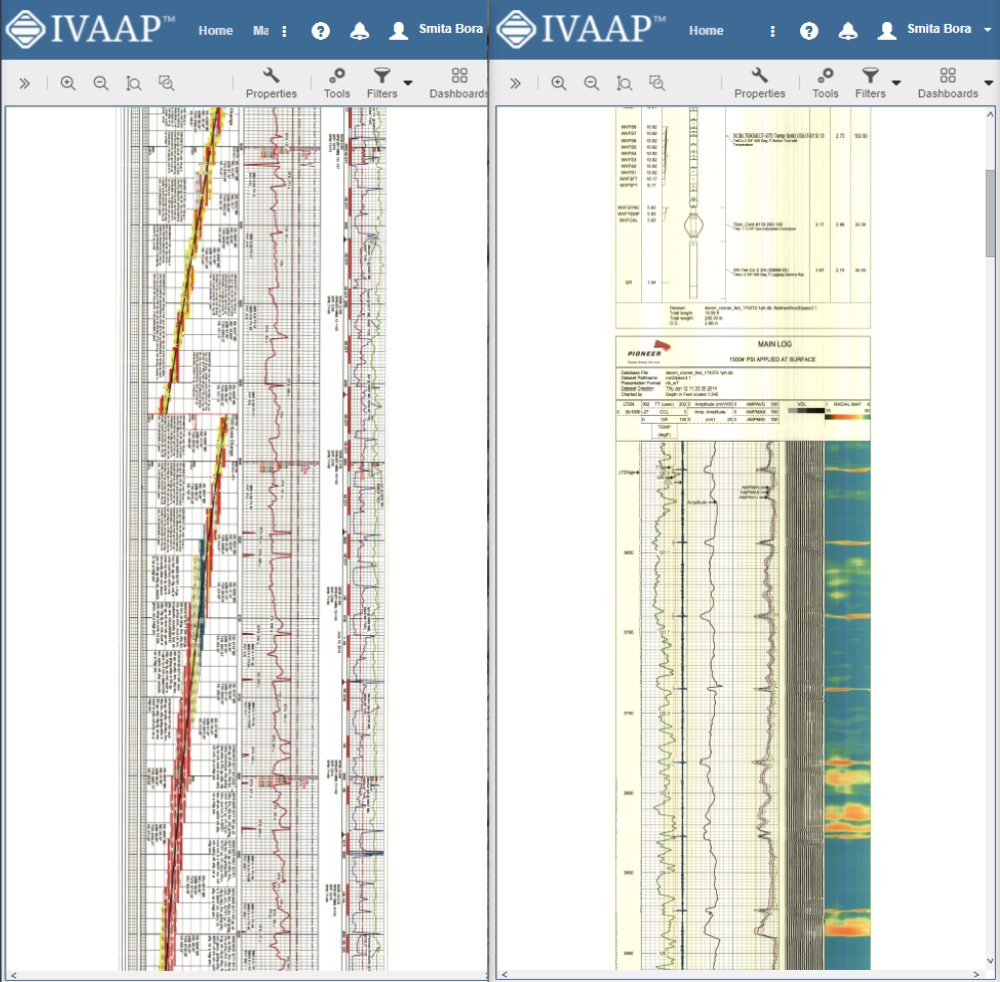
A common challenge that our users face is a need to render and display huge images like raster logs and GeoTIFF files. Interactions occur in the client’s server architecture, and while these images can be stored in the cloud or on a server, they are usually very large files, making it difficult to move from the server to the client. It is also time-consuming to read data from the cloud and unpack operations for TIFFs.

When trying to open these files, the user may have to wait up to several minutes to start to receive data from the server. This can lead to a poor user experience because the client doesn’t know if a server is working or if it’s already halted the solution that we applied. So we wanted to improve this for our users.


Reducing Calculation Complexity

In order to optimize several areas for the client as well as on the server, we decided to focus on the server data loading from cloud storage and enhance the unpacking of TIFFs. We found a way to minimize the number of requests from client to server and pass more calculations from server to client, reducing the calculation complexity on the server.

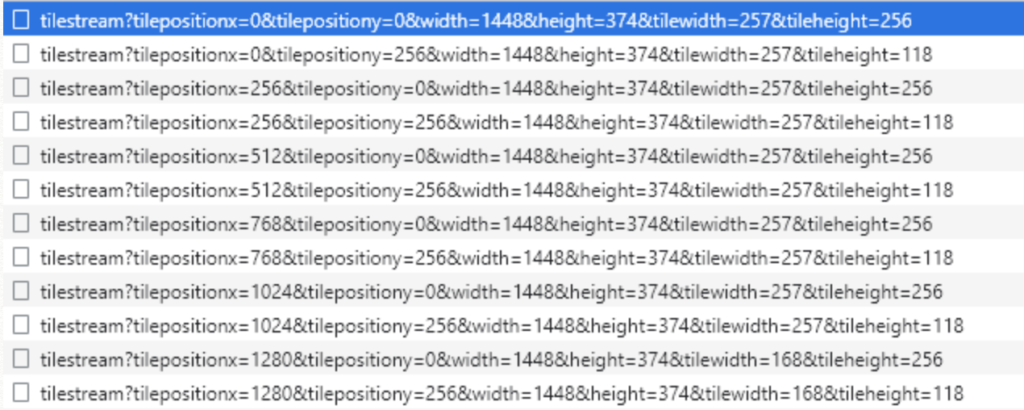
So, how did we do it? On the client side, we have a class called tiled shape which requests tiles from the server.

raster 1

For each tile, the client requests its X and Y position, height, and scaling. In the past, when a user would interact with an image and send a request to the server, requesting new tiles, it would be too much for the server to handle, causing even more delays.

To minimize the impact this request has on the server, we decided to check if the  user stops interaction by timer. After any interaction on the client’s side with the image, we start a timer. Before the timer is up, if no requests are sent from the client to the server, this timer finishes quickly and the image loads. This allows us to minimize the number of requests from client to server.

Calculation and Caching

Another feature we optimized is the ability to pass information from the server to plan calculations for the correct tile position and correct tile transformation. By passing the data from server to client, the client calculates the correct position for tile on each side. We also use a cache of tiles on the client side to ensure that we do not request the same tiles. Image cache on a server side is also possible, but after the first request, it is necessary to download the requested image from the cloud, unpack the image, and then start to copy and scale the requested tile to convert this image.


Unpacking the Image

On the server side, we implemented TIFF unpacking on a highly performing native implementation. This is a multithreaded and thread safe solution., which allows us to deal with several requests from clients at the same time. As a result, a large TIFF image file can be stored in the cloud without a problem and an unpacking time of less than four seconds compared to the previous solution’s 60 seconds. We also optimized the cloud access speed on the server side by renting a high-performance AWS instance with high-speed access to AWS cloud storage. This allows us to download the whole TIFF image from the cloud in less than three seconds, making the download speeds about 800 megabytes per second.


raster2

Faster Rasters

As a result, we spend around three seconds to download the image from cloud storage and about four seconds to unpack the image. So it only takes roughly seven seconds to download, unpack the image, deal with client requests, scale the requested tiles, and send them back to the client as opposed to having to wait several minutes to possibly hours for the same process.  Overall, this process greatly improves the user experience.

The new raster logs and cloud TIFF rendering are just one of the many new features and improvements from the latest GeoToolkit.JS 2021.1 release.

To learn more about GeoToolkit.JS 2021, please visit int.com/products/geotoolkit/or contact us at support@int.com.


Filed Under: GeoToolkit, Uncategorized Tagged With: cloud, geotiff, raster, TIFF

Mar 09 2021

How to Use INTViewer 2021’s New Mapping Capabilities

INTViewer is a platform that allows geoscientists to view seismic data, check for errors, confirm geospatial integrity, perform light processing, and analyze their dataset. INTViewer is specifically designed to enable users to quickly access large datasets—prestack, stack, and 2D— from a laptop in the field to a desktop or remotely via the cloud.

The upcoming release of INTViewer 2021 has new map features including a RemoteMap plugin and support for the import and export of GeoTIFF files.

Users can populate map views with more GIS data(1). The possibility to aggregate several GIS data sources allows users to get a clear understanding of their field.

INTViewer Timeslice
Time slice exported from INTViewer and rendered on top of a satellite view in QGIS.


In the previous version of the RemoteMap plugin, users could use a Web Map Tile Service like Google or Bing to visualize in the background. In the 2021 update, we have added the possibility to set up a custom WMS server. Users can now register their preferred WMS servers in the settings panel and access them in any map view, making it easy to correlate geographic information with their data.

INTViewer Teapot Field
Teapot field, showing study bounds, lithology and faults from USGIN Geology


Using INTViewer, users can also produce georeferenced images by exporting maps to a GeoTIFF image to view in their favorite GIS software.

INTViewer map

With these new and improved features, users will be able to get a better understanding of their field, easily and efficiently correlate geographic data, and import and export GeoTIFF files.


For more information on INTViewer, please visit int.flywheelstaging.com/products/intviewer/


1 These features are available via the RemoteMap and GisRaster plugins, available on the update center.


Filed Under: INTViewer Tagged With: geotiff, gis, INTViewer, mapping, plugins, remotemap

Footer

Solutions

  • Real-Time Visualization
  • Visualization Components
  • New Energy Visualization
  • OSDU Visualization
  • Machine Learning
  • Developer Tools
  • Cloud Partners
  • Customer Success Stories

Products

  • IVAAP
  • GeoToolkit
  • INTViewer
  • IVAAP Demos
  • GeoToolkit Demos

About

  • News
  • Events
  • Careers
  • Management Team

Resources

  • Blog
  • FAQ

Support

  • JIRA
  • Developer Community

Contact

INT logo
© 1989–2024 Interactive Network Technologies, Inc.
Privacy Policy
  • Careers
  • Contact Us
  • Search

COPYRIGHT © 2025 INTERACTIVE NETWORK TECHNOLOGIES, Inc