• Skip to main content
  • Skip to footer

INT

Empowering Visualization

COMMUNITY BLOG
CONTACT US SUPPORT
MENUMENU
  • Solutions
    • Overview
    • Real-Time Visualization
    • Visualization Components
    • New Energy Visualization
    • OSDU Visualization
    • Machine Learning
    • Developer Tools
    • Cloud Partners
  • Products
    • IVAAP™
          • SOLUTIONS

            Real-Time Visualization

            OSDU Visualization

            Visualization Components

            New Energy Visualization

            Upstream Data Visualization

          • SUCCESS STORIES

            WEATHERFORD
            Well delivery optimization software

            BARDASZ
            Data management, data quality monitoring

            ANPG / SATEC-MIAPIA
            Virtual data room

            MAILLANCE
            High-performance visualization of ML algorithms

            SEE ALL >

          • SUPPORT

            DEVELOPER COMMUNITY
            Join or log in to the INT Developer Community.

            GET SUPPORT
            Log a ticket for an issue or bug.

            CONTACT US

          • DEMOS

            IVAAP DEMOS
            Cloud-Based Demos

            FIRST TIME HERE?
            Register to access our
            IVAAP demos

    • GeoToolkit™
          • SUCCESS STORIES

            CAYROS
            Field development planning

            TOTALENERGIES
            High-performance large dataset reservoir rendering

            IFP ENERGIES NOUVELLES
            Seismic and structural interpretation validation

            SEE ALL >

          • SUPPORT

            DEVELOPER COMMUNITY
            Join or log in to the INT Developer Community.

            GET SUPPORT
            Log a ticket for an issue or bug.

            CONTACT US

          • DEMOS

            GEOTOOLKIT DEMOS
            Geoscience Demos

    • INTViewer™
          • SUCCESS STORIES

            STRYDE
            Fast seismic QA/QC in the field

            SILVERTHORNE SEISMIC
            Efficient 2D/3D seismic data delivery

            WIRELESS SEISMIC
            Drones, IoT, and Advanced Onsite Seismic Data Validation

            SEE ALL >

          • SUPPORT

            GET SUPPORT
            Log a ticket for an issue or bug.

            CONTACT US

          • PLUG-INS

            EXTEND INTVIEWER
            More than 65 plugins available

  • Demos
    • GeoToolkit Demos
    • IVAAP Demos
  • Success Stories
  • Resources
    • Blog
    • Developer Community
    • FAQ
    • INT Resources Library
  • About
    • Overview
    • News
    • Events
    • Careers
    • Meet Our Team
    • About INT

geotoolkit

Jul 16 2020

Jumpstart the Development of Your Next Cloud Application with GeoToolkit.JS and INTGeoServer

The Oil and Gas industry is turning to the cloud for its digital transformation. In the race to revolutionize E&P, companies are faced with a chicken-and-egg problem:

  • How to build cloud-based applications when the data is still within the confines of the company network?
  • Why move to the cloud when there are no applications that are able to use this data?

INT has been a long-time pioneer by providing JavaScript components that empower developers to build geoscience applications that run in a browser. The GeoToolkit.JS libraries cut years of development time for any company creating a new application or replacing a legacy system. However, the added value of this kind of application is not just in accessing and visualizing geoscience data, it’s also in the integration of the company’s knowledge within this application.

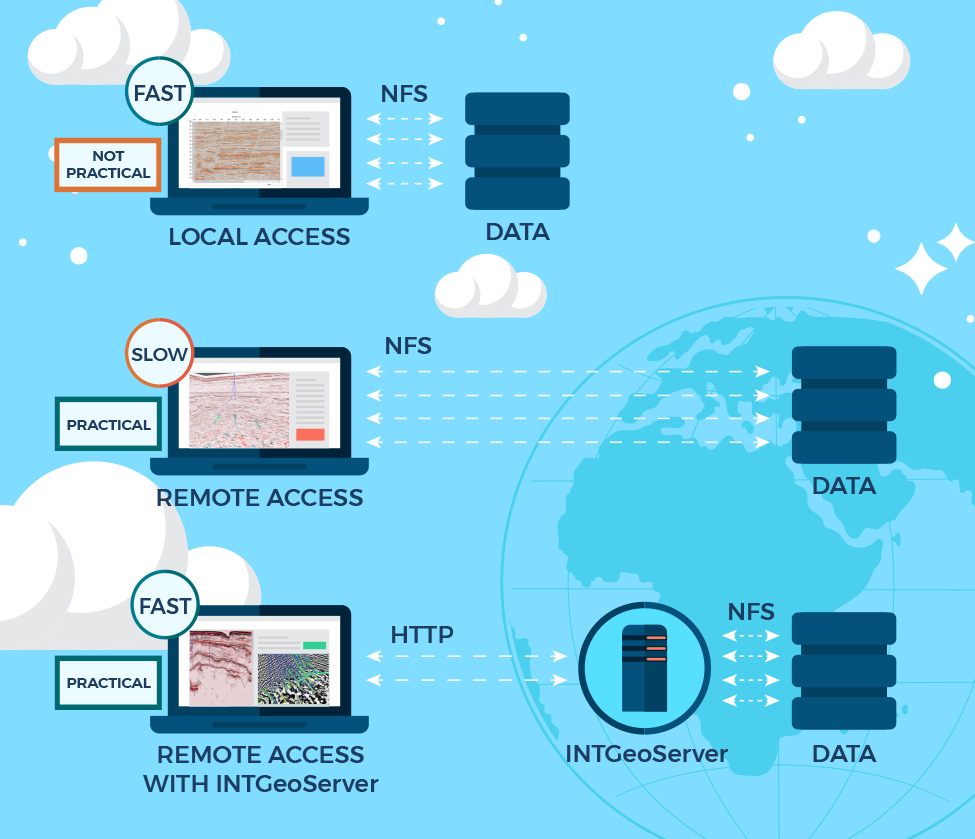
While GeoToolkit.JS provides the tools to visualize geoscience data, INTGeoServer provides the tools to access remote data. This server has been designed to serve seismic and well data efficiently to web clients. It uses the HTTP protocol and works natively with your existing files (such as SEG-Y, SEP, and LAS). In just a few clicks, you can have a running instance of INTGeoServer, upload files to the cloud, and visualize them immediately with GeoToolkit.JS.

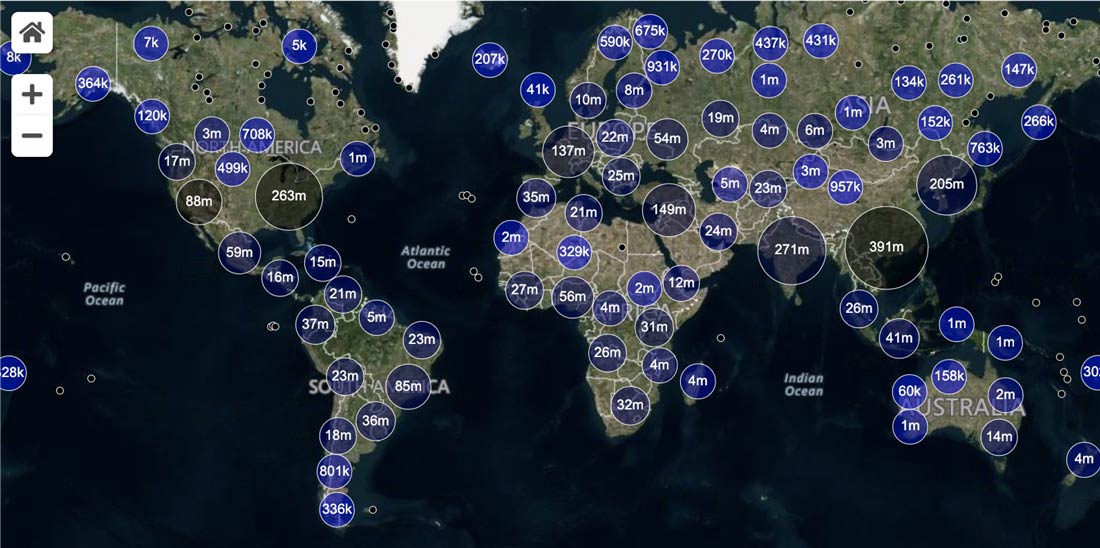
Most customers using INTGeoServer elect to install several instances. To work efficiently with seismic data, INTGeoServer needs to be close to that data. Since E&P companies have their data scattered all over the globe, so are the installations of INTGeoServer, allowing access to datasets from multiple sources in one application. In a classic configuration, data ubiquity is typically achieved by deploying worldwide file systems. INTGeoServer optimizes remote data access by applying several techniques that networks cannot use: only sending the data that the GeoToolkit.JS client needs through the network, limiting the round trips, and compressing the data leveraging similarities between adjacent traces.
 
INTGeoServerNFSGraphic2
 
GeoToolkit.JS has a built-in API to access INTGeoServer instances. It only takes a few lines of code to program a JavaScript application that will read remote data and visualize it. As a result, programmers are free to focus on the added value of their application.

INTGeoServer also offers a nice transition from classic file systems to cloud-based storage. From the perspective of the web client, the code is storage-agnostic. While a company works on migrating its data to the cloud, its developers can use instances of INTGeoServer that are bound to the company network. Once the cloud is ready, no changes to the application are required. You do not need to decide in advance which cloud provider will host your data. INTGeoServer works with Amazon S3, Microsoft Azure Blob Storage, and Google Cloud Storage. If your application serves data from multiple vendors, you can let each vendor choose their own cloud.

GeoToolkit.JS is meant to empower developers. It provides ready-to-use components that can be customized by developers outside of INT. Similarly, INTGeoServer is a platform. It has an API allowing you to add your own data formats, your own security, and your own science. As the audience of your application grows, you might elect to implement your own data server. INTGeoServer facilitates this future transition by documenting the HTTP protocol it implements. You are free to implement your own version of this protocol, keeping your JavaScript web application running without requiring any changes. In this particular scenario, INTGeoServer gives you a definitive time-to-market advantage.

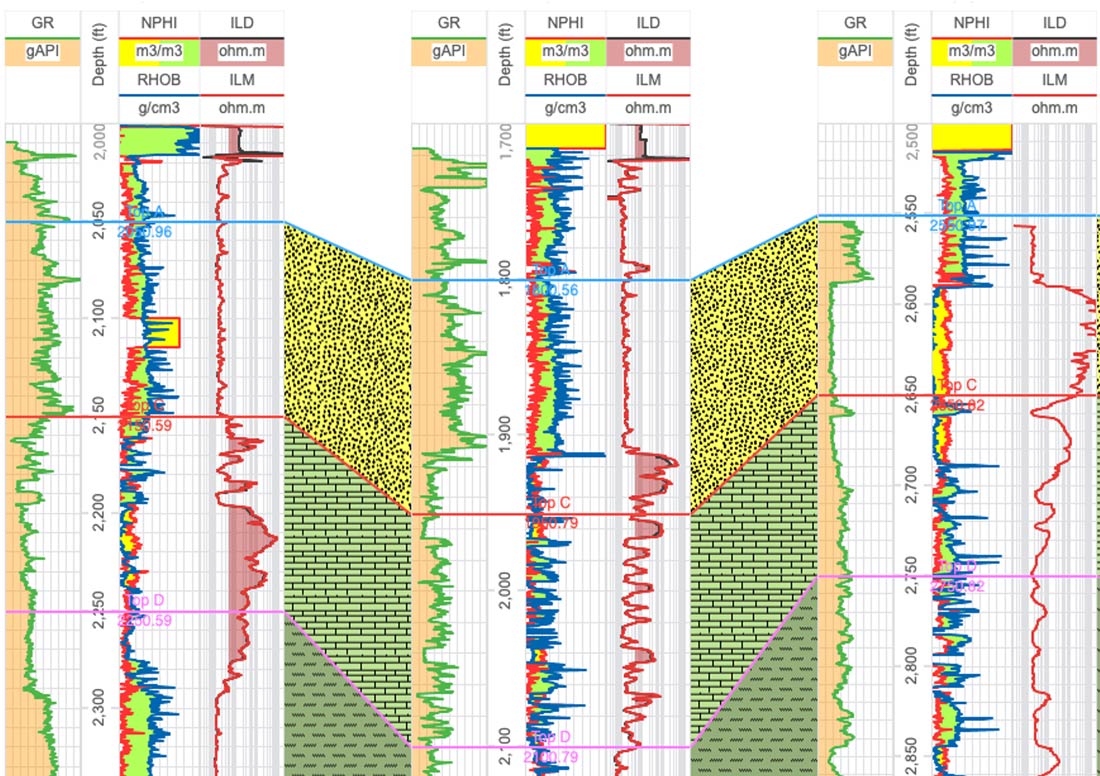
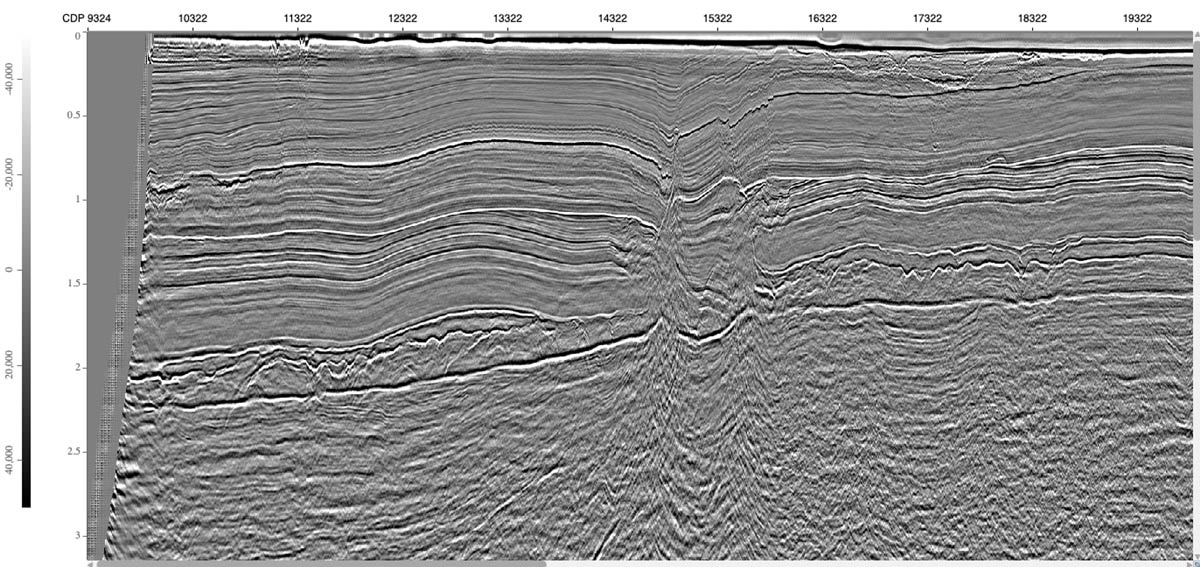
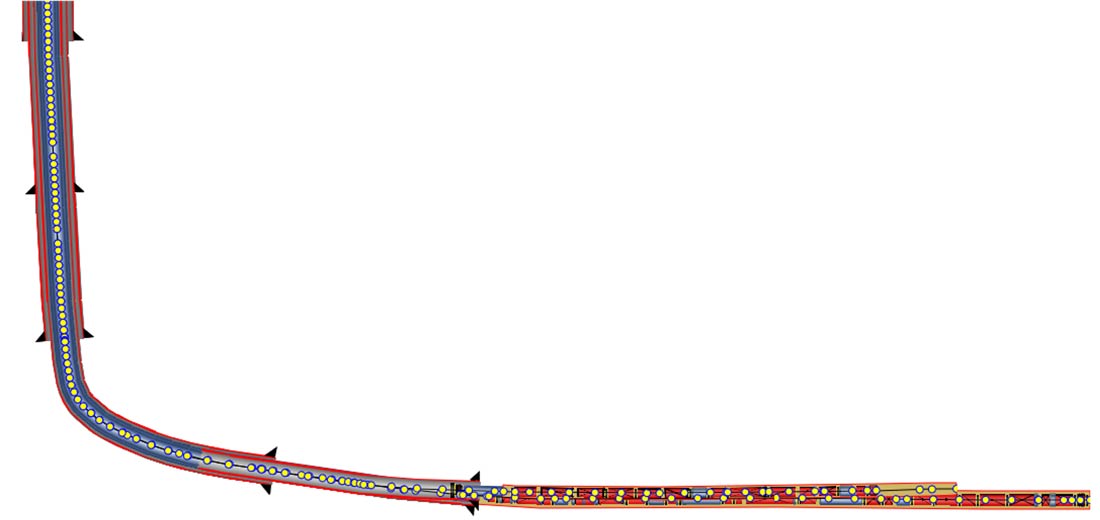
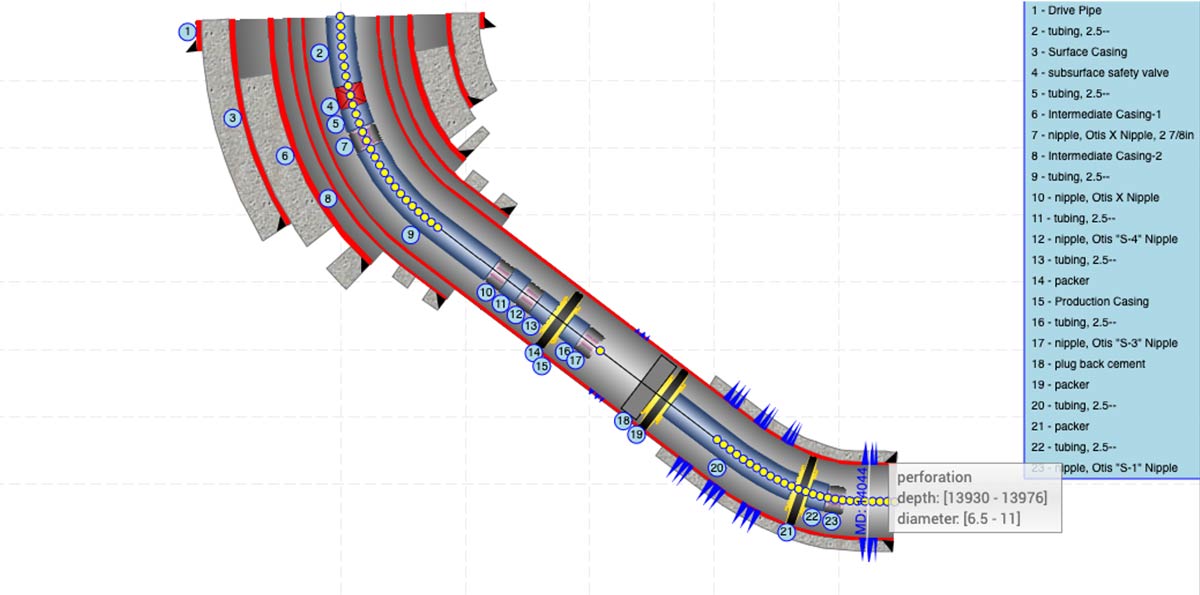
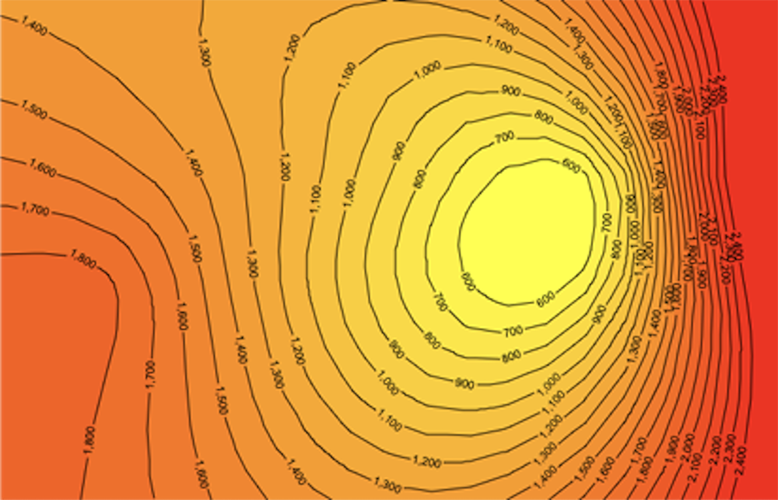
GeoToolkit.JS allows requesting seismic data, log curves, trajectories and horizons form INTGeoServer. The following screenshot displays a cross-section display built with data located on INTGeoServer.

cross-section

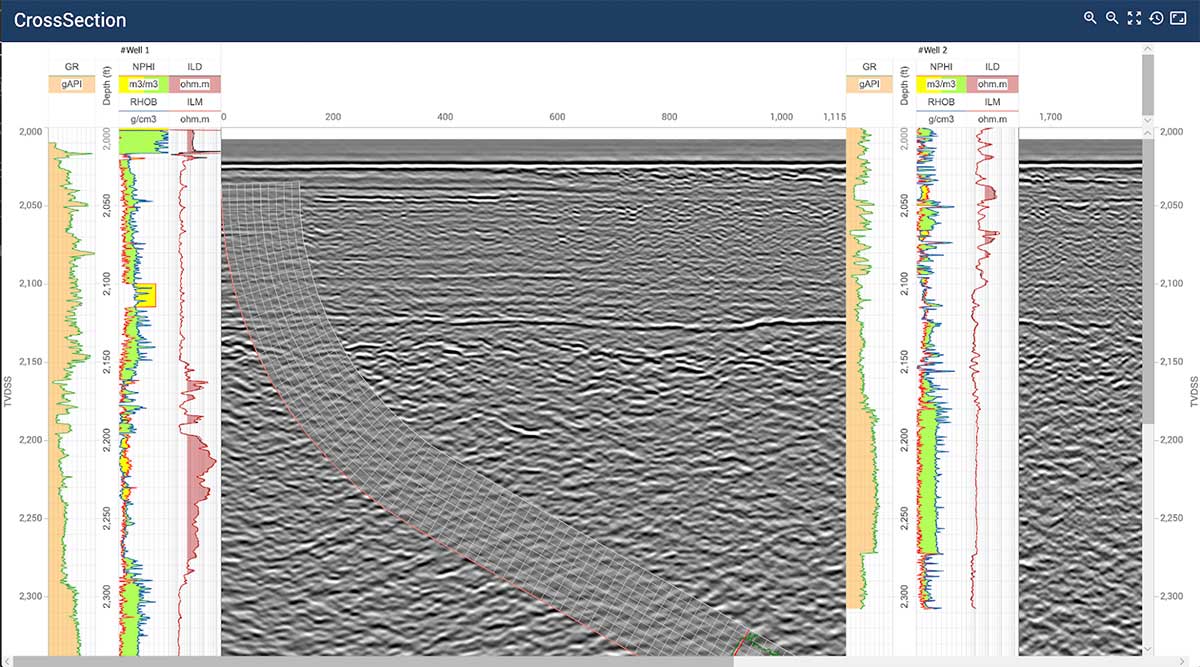
LogCurve can be requested using a simple REST API from INTGeoServer and visualized inside WellLogWidget or MultiWellWidget.

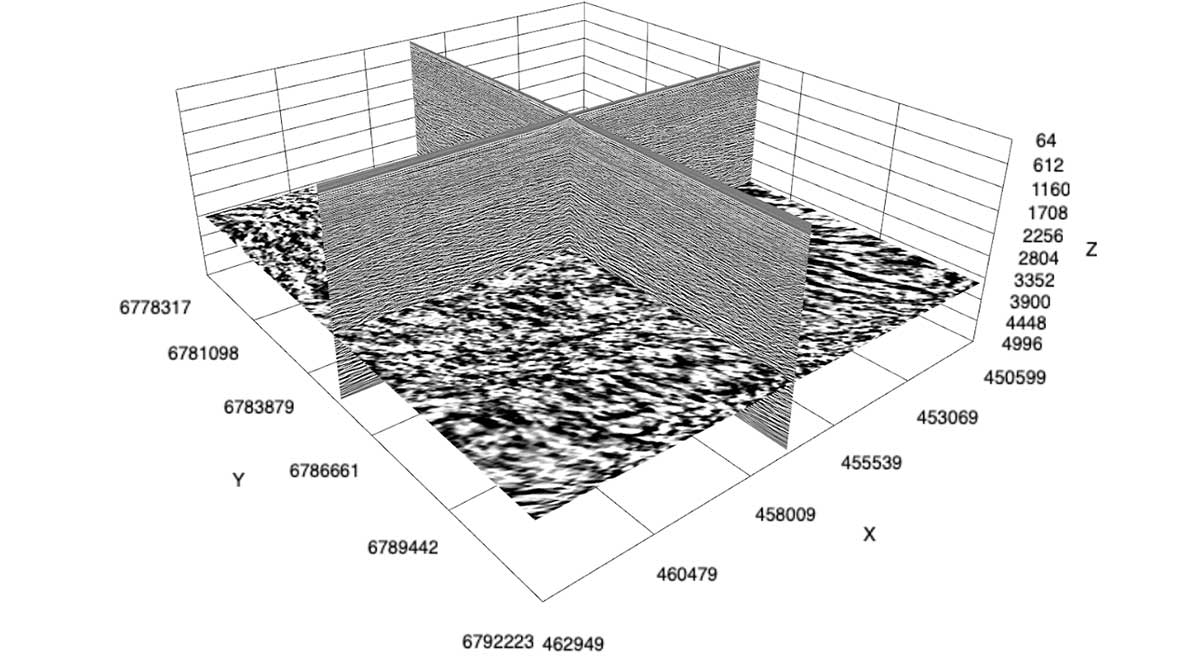
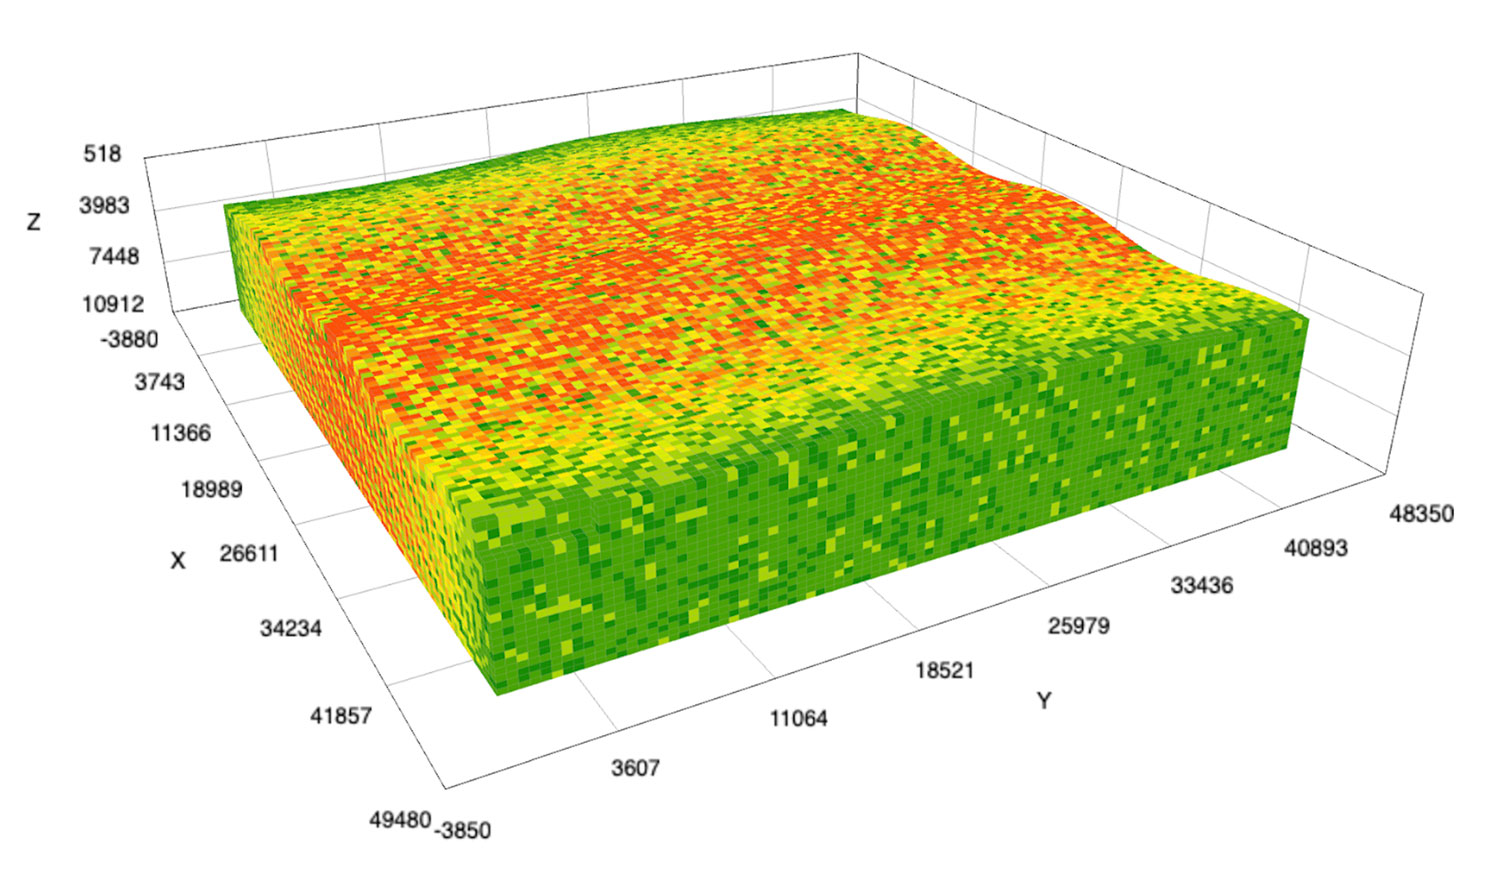
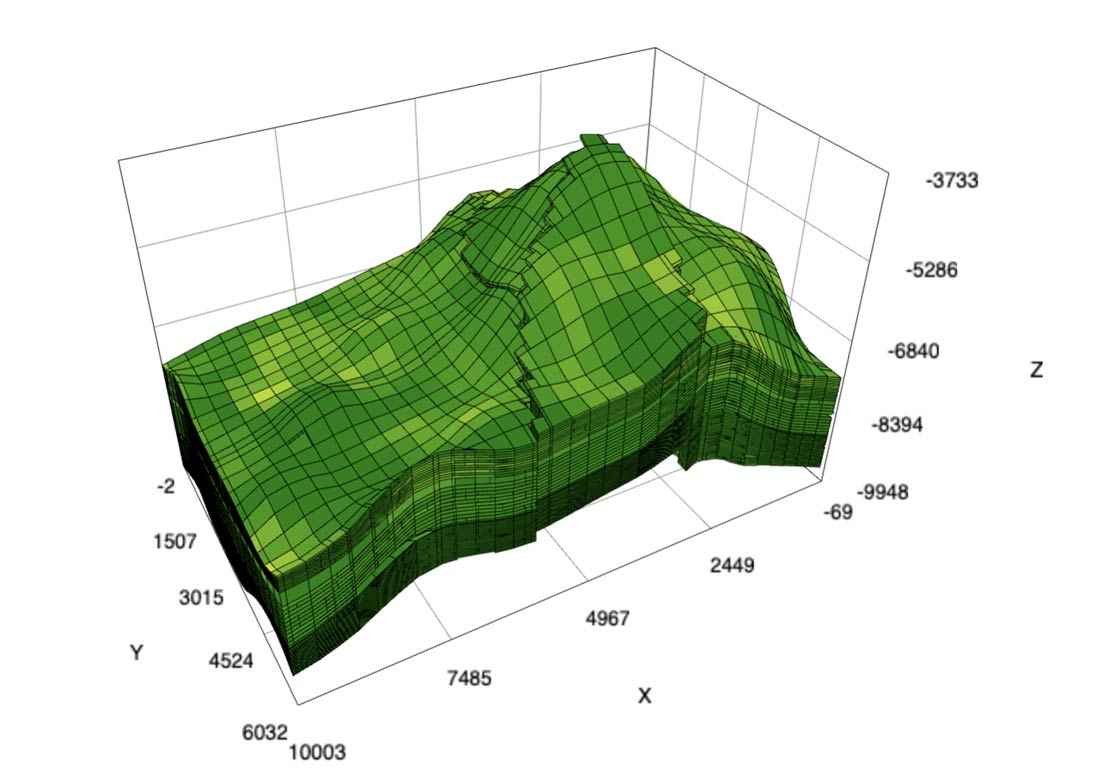
Seismic data in different formats like SEG-Y, SEG-D, SU, and others can be indexed by a utility provided with INTGeoServer, and GeoToolkit.JS can leverage it using sophisticated queries. It is easy to request seismic sections using RemoteSeismicDataSource and specify an arbitrary path or INLINE and XLINE to get data located in cloud or private storage. Moreover, the seismic volume can be visualized in 3D with the Carnac3D module of GeoToolkit.JS.

crossline

As the industry continues to shift towards a digital transformation, more and more E&P companies will migrate their data to the cloud. And with the support of GeoToolkit.JS and INTGeoServer, it becomes simple and efficient to integrate, access, and visualize a company’s data within an application in the cloud.

For more information about GeoToolkit and INTGeoServer, visit the GeoToolkit product page or contact us for a free trial.


Filed Under: GeoToolkit, INTGeoServer Tagged With: cloud, data storage, geotoolkit, INTGeoServer

Jun 11 2020

Optimizing 3D Subsurface Web Applications with GeoToolkit

The WebGL technology that allows 3D rendering on browsers was released in 2009, and yet, 11 years later, 3D is hardly said to be common for web applications in E&P. Despite the advantages of 3D rendering and the trend of migrating applications to web browsers, there are various obstacles that developers have to face and overcome. The steep learning curve, the insufficient cross-platform support, and the difficulty of maintaining make WebGL a beast to work with. In a way, we want to keep the obstacles away from web developers, so INT provides Carnac3D, a subset of GeoToolkit, as an industry-leading graphical product.

Carnac3D is a comprehensive set of graphical tools for data visualization, and it empowers 3D rendering for IVAAP and many other industrial applications. The toolset utilizes WebGL to achieve GPU rendering in web browsers. Meanwhile, it mitigates the drawbacks of the technology and enriches the functionalities specialized for oil and gas.

Getting Started with 3D Rendering Should Not Be Frustrating

The concept of 3D rendering has a lot in common with photography: We need a camera, a scene, and a light source to get started. They are so essential that we can’t take photos without them. In WebGL, it is the same process, except we cannot take that equipment for granted. We had to create a camera, a scene, and a light source ourselves each time we built an application, by playing with the C-like shading language and the low-level graphical APIs. It was a tedious procedure, so we have proposed a solution in Carnac3D. We want our users to have all tools ready when they start to build an application, without having to build tools first.

Having things encapsulated doesn’t mean the user will lose control of the details, because we also provide an intuitive interface. No matter which framework (Angular, React, or Vue) or language (JavaScript or TypeScript) the users choose, they can modify and control the settings for rendering with minimum efforts. 

An active community and strong support are things that developers look for when they evaluate and choose among different technologies. INT honors these and has established a developer site with detailed documentation and tutorials. Whenever our users have questions, they can always get help by simply opening a support ticket or logging on to the INT Developer Community. 

Rendering E&P Models Is as Simple as Providing Data

From the render engine’s perspective, it only rasterizes primitives like triangles and does not understand industrial models by default. How can our users render complicated industrial models without having to stack triangles? Our work in Carnac3D gets the job done, so the users can focus on what is more important for them.

3D graphics require a lot of math computations to be done. For example, the render engine behind the hood needs to perform numerous matrix operations for simple actions such as translating, scaling, and rotation. During our process of developing, we created many helper functions that tackle 3D math. Our math module also handles the situation when the users need to trim and fit their 3D data.

Typical E&P features in Carnac3D include, but are not limited to, well trajectories, log curves, array logs, seismics, surfaces, volumetric rendering, and reservoirs. In the user’s application, these features are available and ready to use by providing corresponding datasets. Possible sources for the dataset are local files on disk, data in cloud storage like AWS, and different services like INTGeoServer. We also take into account if users have their own data storage.

ReservoirGrid Is an Example of How We Optimize Things

ReservoirGrid is a feature in Carnac3D that allows users to visualize reservoir characterization. For years, web developers in oil and gas industries have worked on increasing the capacity of reservoir rendering while maintaining a desirable performance. Due to the limitation of web browsers, it’s hard for web applications to catch up with desktop counterparts in terms of performance and scalability. ReservoirGrid is our solution that tackles the dilemma.

INT reservoir grid

To break down into details, we shall see a reservoir consists of numerous hexahedral cells. Each cell stores information such as property value (color), IJK index, and custom data. By bundling the cells together, it can display some internal objects like horizons and skeletons. What makes our ReservoirGrid standout if it sounds concise already? The short answer is optimization. 

We rely on all possible hardware accelerations that WebGL is capable of doing. For example, we noticed that the outlines of each cell bring extra computing burden, so we eliminated these extra draw calls by dealing with them in shaders. We consider it slow to let the CPU do cell filtering, so we impose filters in shaders to reduce communication costs. We observe that each cell might have different shapes, but it is hexahedral anyway, so we manage the GPU to perform instancing drawing with a single draw call. The above and many other minor optimizations help ReservoirGrid render up to a million cells with an entry-level GPU.

For more information on 3D Rendering or INT’s GeoToolkit, please visit our GeoToolkit page.

Want to know more? Check out our webinar Optimizing 3D Subsurface Web Applications.


Filed Under: Carnac 3D, GeoToolkit Tagged With: 3D, geotoolkit, ivaap, Reservoir, WebGL

Apr 14 2020

GeoToolkit 2020: Top New Features

GeoToolkit is a suite of 2D and 3D data visualization libraries that display well log, seismic, contour, schematics, BHA, maps, and more in JavaScript. Released earlier this year, GeoToolkit.JS 2020 comes with various new features and significant improvements.

Highlights from the latest release include: improved ArcGIS support, faster load times, new tools, multilateral schematics, new gridding algorithms, and improved memory for volumetric rendering.

CARNAC

In Carnac, the base model of GeoToolkit, ES6 harmony modules support has been added. This allows client applications to be reduced in size and allows for a better integration with React and VUE frameworks. It also includes two sets of libraries for ES5 and ES6, two sets of demos and tutorials, two sets of API references, and new TypeScript headers for ES6.

GeoToolkit now also supports NPM. NPM provides local packages for ES5 and ES6 and simplifies the integration of GeoToolkit. Later this year, an INT-based NPM server will be provided (it is currently in the beta testing stage).

We’ve made migrating from ES5 to ES6 easy—just use the command line tool. We’ve also added support for different pyramid images (deep zoom image protocol, OSM, IIIF, and so on) to help with LOD for larger files. And we’ve implemented an Elastic zoom and scroll tool. Another new feature is the DataSheet widget where users can change the look and feel of the data, see table data, modify cells, merge cells, and highlight specific cells.

GeoToolkit.JS now also comes with support for automatic calculation of the desired axis size for charts like Bar Chart and support for CSS 2D transform and text transform for nodes based on AbstractNode. We added an HTTP layer to provide an abstraction API to make HTTP requests and integrate with existing API for Seismic, WellLog, and Contour.


MAP

For our map libraries, new features include an infinite horizontal scroll, GPX format support, a tool to measure distances and area, added support for HTTP request headers (to GIS servers), the ability to create layers from configuration using JSON, an optional UI zoom control, improved ArcGIS support with added query/identify/legend API support for ArcGIS servers, added aggregation of symbols, and a create option to display highlighted features in the manipulation layer.


CARNAC 3D

We improved the performance and memory usage for reservoirs, and we introduced the first version of client support for GigaGrid. We added label notations for wellbore as well as the ability to wrap the map on top of the elevation in 3D. Carnac 3D also comes with support for seismic slice in different directions. The Scatter Plot in Carnac 3D is optimized to use a larger number of points, support in picking and highlighting, and support for tooltips.


WELLLOG

For the WellLog package, all demos were rewritten for both ES5 and ES6. The MultiWell library was optimized and improved. After multiple requests from customers, support for a ghost tool in deviated tracks has been added. Several modifications were done for the MultiWell widget, including modifying the algorithm for tops alignment, adding method to navigate to track, and implementing GAP Fill and Gap Disconnect for log curve and array log (log2d), and ArrayLog support in deviation.

The new drag and drop tool for MultiWellWidget allows you to drag and drop wells with several methods to mitigate for different positions of your correlation display and different alignments. We’ve updated WellLogWidget and MultiWellWidget to have a similar API so clients can play tracks, remove tracks, and so on the same way with both widgets. We’ve also reduced memory usage and increased performance of log2d visuals when exporting PDFs.


SEISMIC

Seismic still has the same widget, but some elements were redesigned. New features in seismic include highlight of traces, floating elements in SeismicWidget toolbar, improved auxiliary chart, startValue as an option to MemoryReader. You can now also specify density decimation without wiggles and integrate webassembly seismic decompression for IVAAP connectors, which is two times faster compared to the JavaScript version. If your browser supports webassembly, you can automatically switch to webassembly mode for decompression.


SCHEMATIC

For the Schematic package, two new widgets have been introduced: Multilateral schematics and DeviatedSchematics widgets. There is now also support for units for WellSchematics for your data model and control for different labels and annotations based on components’ IDs that have been implemented.


CONTOUR

Gridding algorithms Kriging and ThinPlate have been added to Contour. GeoToolkit.JS can now display one isoline from contour and support multicolor isolines.


We are excited about the release of GeoToolkit.JS 2020 and would love to show you more about it. Contact us for a free trial at info@int.com.


Filed Under: GeoToolkit Tagged With: arcgis, deviated, es5, es6, geotoolkit, multilateral

Jan 30 2023

GeoToolkit Java 3.5, Securing the Future, One Rapid Release at a Time

At INT, we support several versions of our popular developer toolkit, GeoToolkit, including JavaScript, Java, C++, and .NET. Our Java platform is perhaps a bit old, but it is certainly not dead. In fact, it is widely used in current desktop applications and server side as many cloud-based application backends rely on it.

A few years ago, we adopted a rapid release cycle for GeoToolkit Java, and since this change, the first Long-Term Support version (Java 11) was released in late 2018.

It is therefore natural that GeoToolkit Java follows the movement with its new release. Indeed, the 3.5 version is the first step of a new release cycle which will allow our users to base their applications on stable and up-to-date tools.

OpenJDK 11 Support

openjdklogoThe release of Java 11 came with changes to the Oracle license terms. Fortunately, GeoToolkit Java is now compatible with OpenJDK 11, which ensures users the possibility to base their application on a freely available and up-to-date version of the Java platform.

OpenGL 3 Pipeline

OpenGL_170px_June16GeoToolkit Java can use the OpenGL pipeline to speed up rendering. However, GeoToolkit 3.4 used the now deprecated version 2.1 of the OpenGL API. This meant that we couldn’t ensure the viability of this solution on a long-term basis, as some OpenGL implementations already lacked the 2.1 support (OSX, VMWare software implementation, etc.). As part of the new release, we prioritized an update to our OpenGL modules to use OpenGL 3 (and above), again providing a strong base for current and future applications for our customers.

For more information about GeoToolkit, visit our product page or request the latest version.


Filed Under: GeoToolkit Tagged With: geotoolkit, openGL, openJDK

Apr 15 2019

TotalEnergies to Use INT’s Data Visualization and Analysis Platform and Libraries Software for the Next Five Years

TotalEnergies and INT have recently announced a long-term corporate agreement that will give TotalEnergies access to INT’s GeoToolkit, the most widely adopted JavaScript-based data visualization technology software in Oil and Gas.

TotalEnergies will also be able to take advantage of IVAAP, one of the leading Data Visualization software platforms for digital subsurface projects deployed in the web or private cloud.

“With the growth of Big Data and IoT, the E&P industry needed a solution that would empower companies to combine and utilize vast amounts of incredibly useful, yet disparate domain data easily, in one powerful software,” said Dr. Olivier Lhemann, founder and CEO, Interactive Network Technologies.

“Fortunately, our unique expertise and position in the industry allowed us to recognize and respond to this need quickly, so we developed IVAAP. Now, we’re proud to partner with TotalEnergies to empower domain experts with the right digital tools they need to gain valuable, timely insights from their data.”

With this agreement, TotalEnergies Exploration & Production will gain access to GeoToolkit and IVAAP’s fully extensible platform, cloud-based architecture, and comprehensive set of data connectors to current systems such as WITSML, PPDM, OSIsoft, PI, and many others.

For more information on INT’s products and services, visit our products page or email us to discuss how we can help you visualize your upstream data.

View the press release

Learn more about INT’s products


Filed Under: GeoToolkit, Uncategorized Tagged With: geotoolkit, ivaap, TotalEnergies

  • Page 1
  • Page 2
  • Go to Next Page »

Footer

Solutions

  • Real-Time Visualization
  • Visualization Components
  • New Energy Visualization
  • OSDU Visualization
  • Machine Learning
  • Developer Tools
  • Cloud Partners
  • Customer Success Stories

Products

  • IVAAP
  • GeoToolkit
  • INTViewer
  • IVAAP Demos
  • GeoToolkit Demos

About

  • News
  • Events
  • Careers
  • Management Team

Resources

  • Blog
  • FAQ

Support

  • JIRA
  • Developer Community

Contact

INT logo
© 1989–2024 Interactive Network Technologies, Inc.
Privacy Policy
  • Careers
  • Contact Us
  • Search

COPYRIGHT © 2025 INTERACTIVE NETWORK TECHNOLOGIES, Inc