• Skip to main content
  • Skip to footer

INT

Empowering Visualization

COMMUNITY BLOG
CONTACT US SUPPORT
MENUMENU
  • Solutions
    • Overview
    • Real-Time Visualization
    • Visualization Components
    • New Energy Visualization
    • OSDU Visualization
    • Machine Learning
    • Developer Tools
    • Cloud Partners
  • Products
    • IVAAP™
          • SOLUTIONS

            Real-Time Visualization

            OSDU Visualization

            Visualization Components

            New Energy Visualization

            Upstream Data Visualization

          • SUCCESS STORIES

            WEATHERFORD
            Well delivery optimization software

            BARDASZ
            Data management, data quality monitoring

            ANPG / SATEC-MIAPIA
            Virtual data room

            MAILLANCE
            High-performance visualization of ML algorithms

            SEE ALL >

          • SUPPORT

            DEVELOPER COMMUNITY
            Join or log in to the INT Developer Community.

            GET SUPPORT
            Log a ticket for an issue or bug.

            CONTACT US

          • DEMOS

            IVAAP DEMOS
            Cloud-Based Demos

            FIRST TIME HERE?
            Register to access our
            IVAAP demos

    • GeoToolkit™
          • SUCCESS STORIES

            CAYROS
            Field development planning

            TOTALENERGIES
            High-performance large dataset reservoir rendering

            IFP ENERGIES NOUVELLES
            Seismic and structural interpretation validation

            SEE ALL >

          • SUPPORT

            DEVELOPER COMMUNITY
            Join or log in to the INT Developer Community.

            GET SUPPORT
            Log a ticket for an issue or bug.

            CONTACT US

          • DEMOS

            GEOTOOLKIT DEMOS
            Geoscience Demos

    • INTViewer™
          • SUCCESS STORIES

            STRYDE
            Fast seismic QA/QC in the field

            SILVERTHORNE SEISMIC
            Efficient 2D/3D seismic data delivery

            WIRELESS SEISMIC
            Drones, IoT, and Advanced Onsite Seismic Data Validation

            SEE ALL >

          • SUPPORT

            GET SUPPORT
            Log a ticket for an issue or bug.

            CONTACT US

          • PLUG-INS

            EXTEND INTVIEWER
            More than 65 plugins available

  • Demos
    • GeoToolkit Demos
    • IVAAP Demos
  • Success Stories
  • Resources
    • Blog
    • Developer Community
    • FAQ
    • INT Resources Library
  • About
    • Overview
    • News
    • Events
    • Careers
    • Meet Our Team
    • About INT

html5

Jun 17 2021

How to Extend the IVAAP Data Model with the Backend SDK

The IVAAP Data Backend SDK’s main purpose is to facilitate the integration of INT customers’ data into IVAAP. A typical conversation between INT’s technical team and a prospective customer might go like this:

Can I visualize my data in IVAAP?

Yes, the backend SDK is designed to make this possible, without having to change the UI or even write web services.

What if my data is stored in a proprietary data store?

The SDK doesn’t make any assumptions on how your data is stored. Your data can be hidden away behind REST services, in a SQL database, in files, etc.

What are the steps to integrate my data?

The first step is to map your data model with the IVAAP data model. The second step is to identify, for each entity of that data model, how records are identified uniquely. The third step is to plug your data source. The fourth and final step is to implement, for each entity, the matching finders.

What if I want to extend the IVAAP data model?

My typical answer to this last question is “it depends”. The SDK has various hooks to make this possible. Picking the right “hook” depends on the complexity of what’s being added.

Using Properties

The IVAAP data model was created after researching the commonalities between the industry data models. However, when we built it, we kept in mind that each data store carries its own set of information, information that is useful for users to consume. This is why we made properties a part of the data model itself. From an IVAAP SDK point of view. Properties is a set of name-value pairs that you can associate with specific entities within the IVAAP Data Model.

For example, if a well dataset is backed by an .LAS file in Amazon S3 or Microsoft Azure Blob Storage, knowing the location of that file is a valuable piece of information as part of a QC workflow. But not all data stores are backed by files, a file location is not necessarily relevant to a user accessing data from PPDM. As a result, the set of properties shown when opening a dataset backed by Azure will typically be different from a set coming from PPDM, even for the same well.


properties dialog example
An example of properties dialog, showing multiple properties of a seismic dataset stored in Amazon S3.


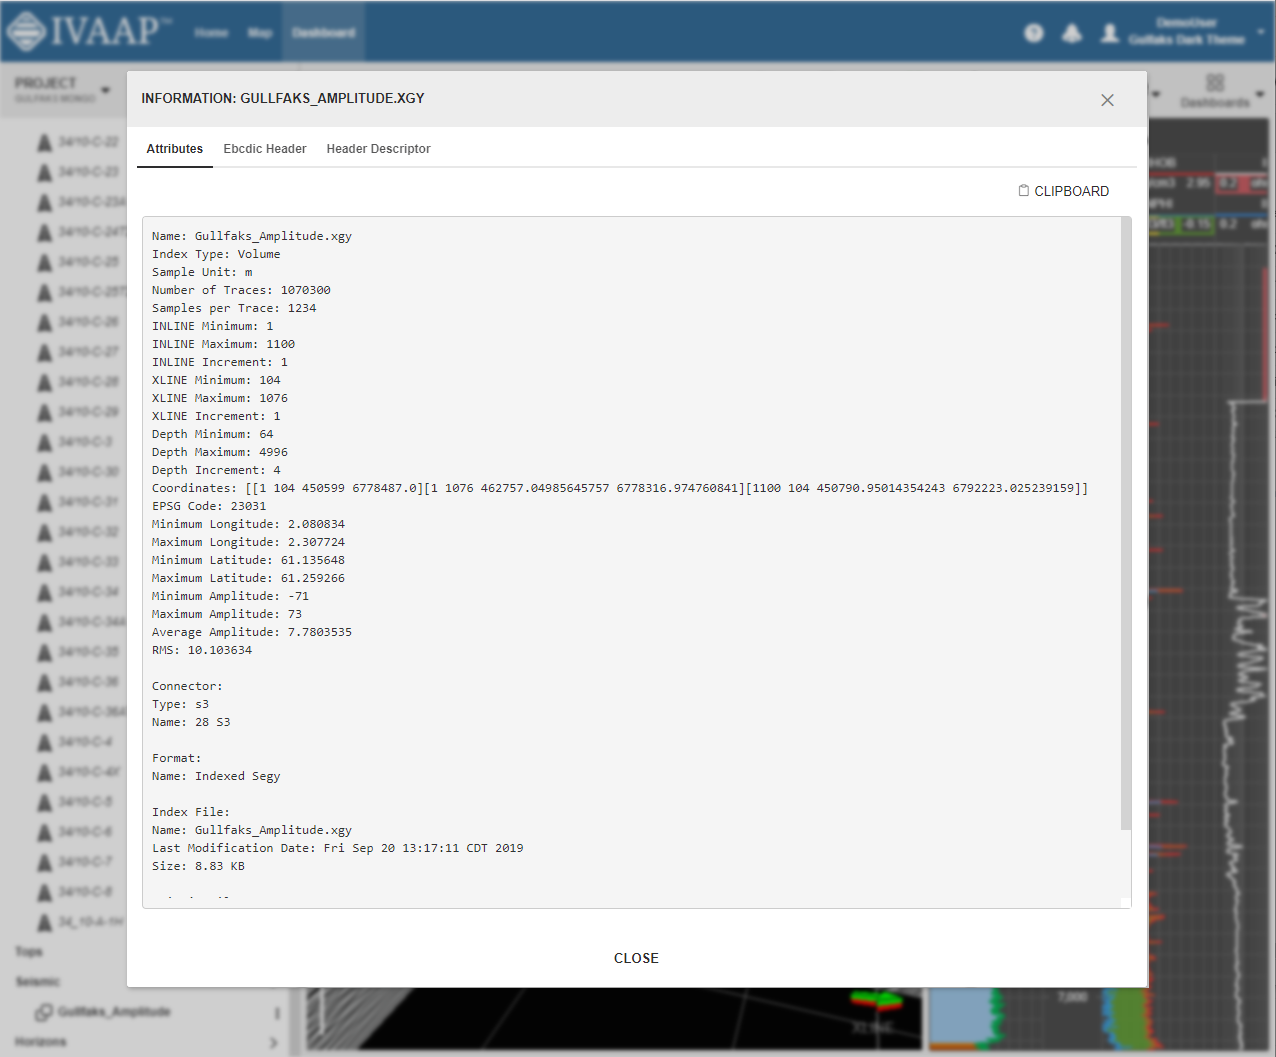
Calling the properties a set of name-value pairs does not do justice to its flexibility. While a simple name+value is the most common use, you can create a tree of properties and attach additional attributes to each name-value pair. The most common additional attribute is a unit, qualifying the value to make this property more of a measurement.  Another attribute allows name-value pairs to be invisible to users. The purpose of invisible properties is to facilitate the integration with other systems than the IVAAP client. For example, while a typical user might be interested in the size of a file, this size should be rounded and expressed in KB, MB or GB. An external software consuming the IVAAP Properties REST services would need the exact number of bytes.

One of the benefits of using properties to carry information is that it’s simple to implement your own property finder, and it requires no additional work. No custom REST services to write, and no widget to implement to visualize these properties. The IVAAP HTML5 client is designed to consume the IVAAP services of the data backend, and show these properties in the UI.

Adding Your Own Tables and Documents

One of the limitations of properties is they don’t provide much interaction. Users can only view properties. The simplest way to extend the IVAAP model in a way that users can interact with that data is to add tables. For example, the monthly production of a well is an easy table  to make accessible as a node under a well. Once the production of a well is accessible as a table, users have multiple options to graph this production: as a 2D Plot, as a pie chart, as an histogram, etc. And this chart can be saved as part of a dashboard or a template, making IVAAP a portal.

The IVAAP Data Backend SDK has been designed to make the addition of tables a simple task. Just like for properties, the HTML5 Viewer of IVAAP doesn’t need to be customized to discover and display these tables. It’s the services of the data backend that direct the viewer on how to build the data tree shown to users. And while the data backend might advertise many reports, only non-empty reports will be shown as nodes by the viewer. 


tabular reports
An example of tabular reports related to a well.


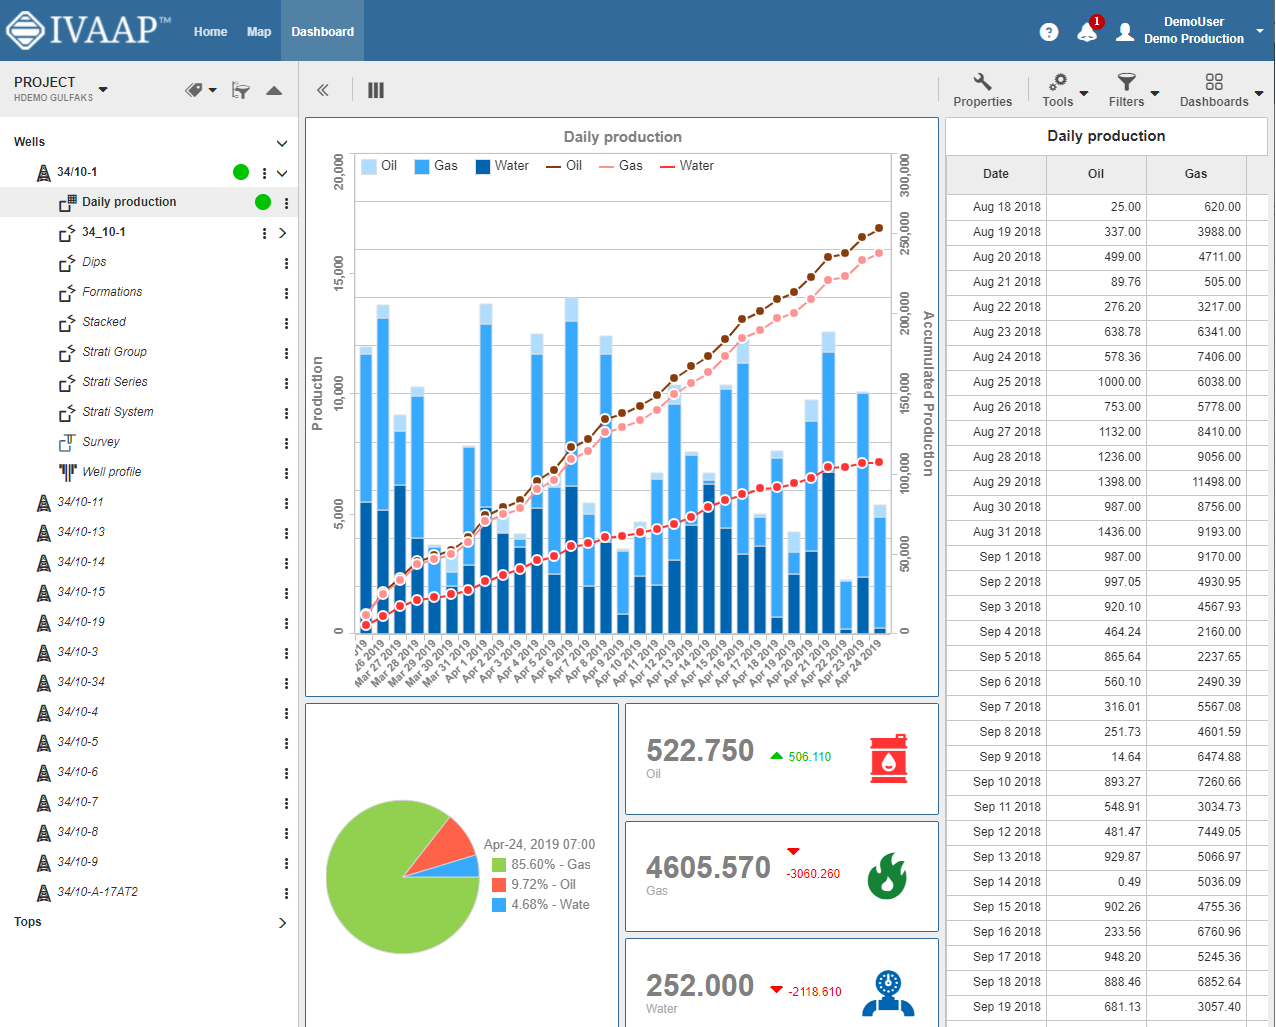
In the many customization projects that I’ve been involved in, the tabular features of IVAAP have been used the most. I have seen dozens of reports under wells. The IVAAP Data Backend makes no assumptions about where this production data is stored relative to where the well is stored. For example, you can mix the schematics from Peloton WellView with the production reports from Peloton ProdView. From a user point of view, the source of the data is invisible, IVAAP combines the data from several sources in a transparent way. Extending the IVAAP data model doesn’t just mean exposing more data from your data source, it also means enriching your data model with data from other sources.

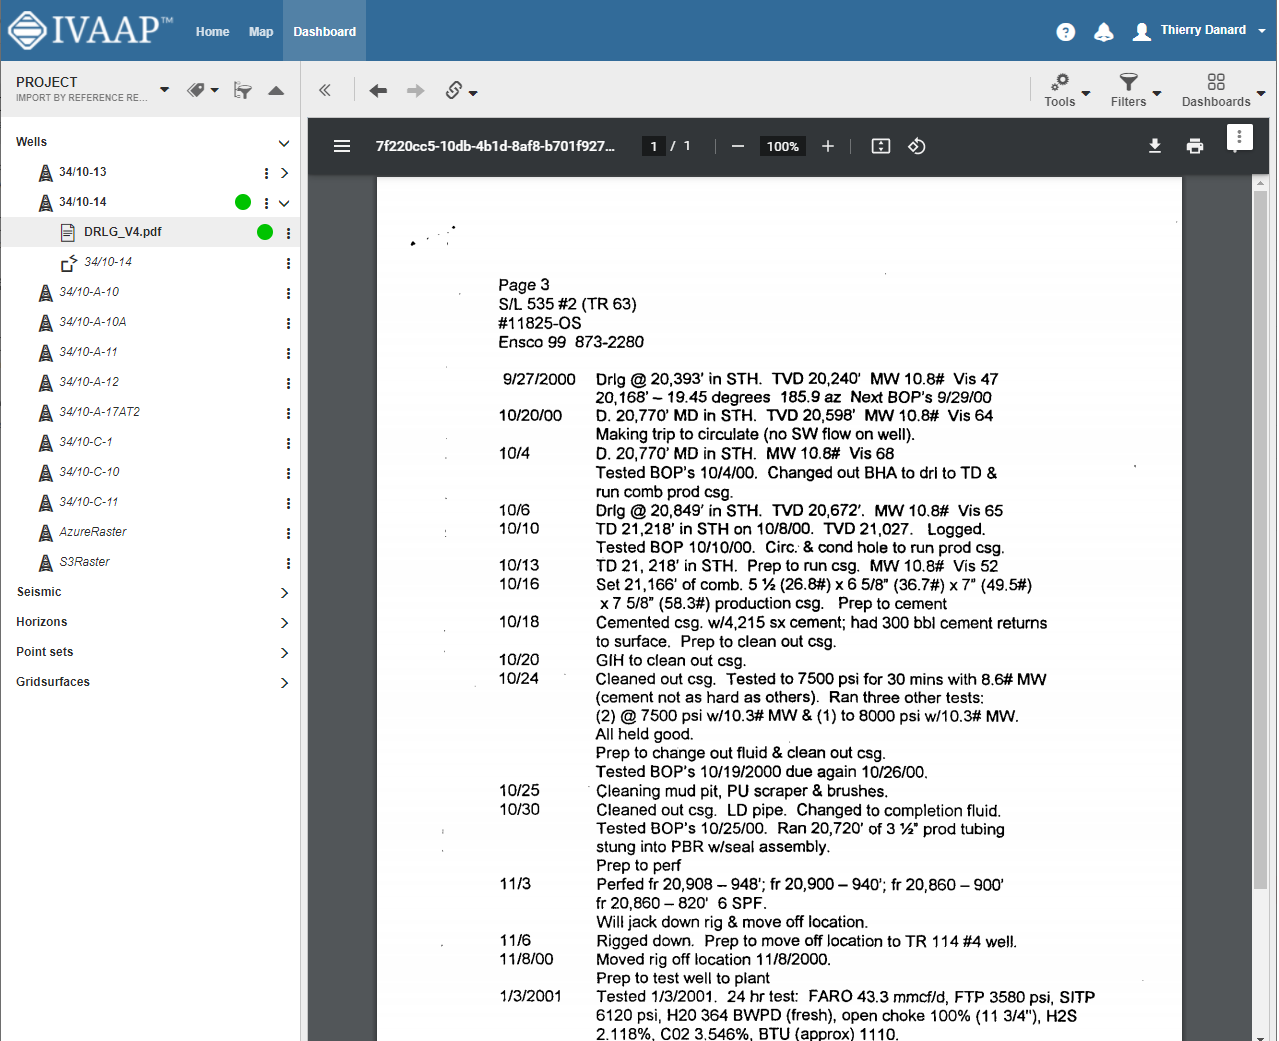
Data enrichment is sometimes achieved just by making accessible the documents associated with a well. For example, for Staatsolie’s portal, the IVAAP UI was giving direct access to the documentation of a well, stored in Schlumberger’s ESearch.


PDF document related to a well
An example of PDF document related to a well.


Adding Your Own Entities and Services

When data cannot be expressed as properties, tables or documents, the next step is to plug your own model. The API of the Backend SDK makes it possible to plug your own entities under any existing entity of the built-in data model. In this use case, not only code to access data needs to be developed, but also code to expose this data to the viewer. The IVAAP data model is mature, so this is a rare occurrence.

There are hundreds of services implemented with the IVAAP Data Backend SDK, developers who embark on a journey involving adding their own data types can be reassured by the fact that the path they follow is the same path the INT developers follow every day as we augment the IVAAP data model. INT makes use of its own SDK every day.


IVAAP Data Backend SDK Homepage
Home page of the website dedicated to the IVAAP Data Backend SDK.


Whether IVAAP customers need to pepper the IVAAP UI with proprietary properties or their own data types, these customers have options. The SDK is designed to make extensions straightforward, not just for INT’s own developers, but for INT customers as well. You do not need to contract INT’s services to roll your own extensions. You can, but you don’t have to. When IVAAP gets deployed, we don’t just give you the keys to IVAAP as an application, we also give you the keys to IVAAP as a platform, where you can independently control its capabilities.

For more information on IVAAP, please visit int.flywheelstaging.com/products/ivaap/


Filed Under: IVAAP Tagged With: backend, data, html5, ivaap, SDK

Oct 07 2020

Search, Access, and Visualize OSDU Data with IVAAP

INT and OSDU Collaboration

INT has been working with the Open Subsurface Data Universe™ (OSDU) consortium since the beginning of the OSDU forum in 2019. OSDU is a standard data platform for the oil and gas industry which will reduce silos and put data at the center of the subsurface community. INT made IVAAP available as part of the Demo release of the OSDU platform.
 

IVAAP: The Premier HTML5 Data Visualization Platform for OSDU

At INT, we worked closely with the OpenSDU team to assist with validating the platform and creating a robust framework.

  • Developers can deliver cloud-based digital solutions quicker than ever.
  • Using the powerful OSDU search and delivery API, IVAAP allows users to search, find, display, and analyze data on the fly, including log, trajectories, tops, seismic, horizon, and fault data.
  • Creating a common environment hosted in the cloud enables oil and gas companies to efficiently access massive amounts of data, reduce data silos, collaborate remotely, implement machine learning (ML), and lower the cost of operations.

search-data

Search and interact with different data types.

cloud-data

Access your data in the cloud from anywhere.

charts-viz

Visualize data aggregated from various data sources in one place.


With IVAAP on OSDU R2, you can:
  • Combine data on the fly from wells, seismic, and many other sources.
  • Use a microservices architecture, IVAAP supports industry data standards, including OSDU, PPDM, WITSML, and several commercial databases.
  • Enable user co-visualization.
  • Combine data types like real-time, historical, 2D/3D seismic, reservoir, and more in your web browser with IVAAP’s one-of-a-kind dashboard capabilities.


Request a demo for IVAAP today


What Is OSDU?

The OSDU Forum was created with the objective of enabling new cloud-native data-driven applications with seamless access to the full range of subsurface and wells data as well as supporting existing applications and data frameworks.

Separating data from applications is the core principle of the OSDU solution. The plan is to achieve this by developing a common data platform with standard public APIs and to involve global cloud hosting vendors to build working implementations that will:

  • Allow companies to focus on the truly differentiating part of business activities
  • Reduce the resource and cost burden of independently designing and validating a subsurface data platform
  • Influence and accelerate key reference components that will be the foundation of the upstream digital transformation.

The OSDU data platform will:

  • Enable secure, reliable, global, and performant access to all subsurface and wells data
  • Reduce current data silos to enable transformational workflows
  • Accelerate the deployment of emerging digital solutions for better decision-making
  • Create an open, standards-based ecosystem that drives innovation

View the official OSDU brochure.


An Industry Solution

The OSDU Forum will:

  • Publish a Reference Architecture: a cloud-native subsurface and wells data platform reference architecture with initial implementations by Microsoft® Azure, Amazon Web Services® and Google® GCP, with others expected.
  • Define Application Standards to ensure applications (microservices), developed by various parties, can run on the same OSDU data platform
  • Leverage Industry Data Standards for frictionless integration and data access

Business Impact

  • Reducing data silos: subsurface and wells data integrated and accessible in one data platform
  • Workflows in the cloud: user workflows seamlessly executed across the OSDU data platform, taking advantage of powerful cloud-native solutions
  • Access to all metadata: users will have access to powerful search capabilities
  • Competition and cooperation: software vendors, oil companies, academia, and open community projects can develop software on the OSDU data platform
api_design

Scope

Current Scope

  • Coverage: any organization with a need to store, manage or analyze subsurface and wells data
  • Portfolios: subsurface including exploration, development, and wells
  • Support for Data Driven Applications: All data in one Data Platform will enable AI (such as Machine Learning) based applications to access this data

Current Problem Statement

  • Data is linked to applications: we are not data-driven but applications-driven and, therefore, we will have silos
  • Data is stored in silos: therefore, there is no lineage between data sources or from wells back to exploration
  • Metadata is not stored with the data: metadata is information about the data
  • Limited/no search capabilities: since we have no metadata, we have no real search capabilities
  • Data set-up: not suitable for data-driven applications

 
OSDU Scope

  • All public cloud-based: provides unlimited scalability
  • All data for the data platform services loaded via the data ingestion services: extract metadata, data quality, etc.
  • Well-defined (RestFUL) APIs defining the access to the data platform services
    Applications: (micro) services-based
  • Information security: covering all elements with focus on data security
  • In-country solution: for those countries where we are unable to move data out of the country and where there are no cloud services
  • Support for legacy applications based on Microsoft® Windows or Linux® desktop

osdu_scope_image
 

What Is the OSDU Value?

The OSDU data platform will:

  • Revolutionize the industry’s ability to deliver new subsurface capabilities
  • Create an open, standards-based ecosystem that drives innovation
  • Accelerate the deployment of emerging digital solutions for better decision-making
  • Reduce implementation and lifecycle costs
  • Eliminate current data silos to enable transformational workflows
  • Provide access to all metadata: users can access their data and applications wherever they are
  • Create new opportunities for monetizing intellectual property:
    • Moving to subscription models for applications or services sold by independent software and services providers
    • Opportunity for multiple competitors to sell specialized algorithms or workflows that are easily integrated because of compliance to OSDU standards

Membership

If you’re interested in becoming a member of OSDU today, click here, or for a full list of members, click here.

Ready to Get Started?

Request a demo of the platform chosen to visualize OSDU data.

Request a demo for IVAAP today


Filed Under: IVAAP Tagged With: html5, ivaap, OSDU

Footer

Solutions

  • Real-Time Visualization
  • Visualization Components
  • New Energy Visualization
  • OSDU Visualization
  • Machine Learning
  • Developer Tools
  • Cloud Partners
  • Customer Success Stories

Products

  • IVAAP
  • GeoToolkit
  • INTViewer
  • IVAAP Demos
  • GeoToolkit Demos

About

  • News
  • Events
  • Careers
  • Management Team

Resources

  • Blog
  • FAQ

Support

  • JIRA
  • Developer Community

Contact

INT logo
© 1989–2024 Interactive Network Technologies, Inc.
Privacy Policy
  • Careers
  • Contact Us
  • Search

COPYRIGHT © 2025 INTERACTIVE NETWORK TECHNOLOGIES, Inc