• Skip to main content
  • Skip to footer

INT

Empowering Visualization

COMMUNITY BLOG
CONTACT US SUPPORT
MENUMENU
  • Solutions
    • Overview
    • Real-Time Visualization
    • Visualization Components
    • New Energy Visualization
    • OSDU Visualization
    • Machine Learning
    • Developer Tools
    • Cloud Partners
  • Products
    • IVAAP™
          • SOLUTIONS

            Real-Time Visualization

            OSDU Visualization

            Visualization Components

            New Energy Visualization

            Upstream Data Visualization

          • SUCCESS STORIES

            WEATHERFORD
            Well delivery optimization software

            BARDASZ
            Data management, data quality monitoring

            ANPG / SATEC-MIAPIA
            Virtual data room

            MAILLANCE
            High-performance visualization of ML algorithms

            SEE ALL >

          • SUPPORT

            DEVELOPER COMMUNITY
            Join or log in to the INT Developer Community.

            GET SUPPORT
            Log a ticket for an issue or bug.

            CONTACT US

          • DEMOS

            IVAAP DEMOS
            Cloud-Based Demos

            FIRST TIME HERE?
            Register to access our
            IVAAP demos

    • GeoToolkit™
          • SUCCESS STORIES

            CAYROS
            Field development planning

            TOTALENERGIES
            High-performance large dataset reservoir rendering

            IFP ENERGIES NOUVELLES
            Seismic and structural interpretation validation

            SEE ALL >

          • SUPPORT

            DEVELOPER COMMUNITY
            Join or log in to the INT Developer Community.

            GET SUPPORT
            Log a ticket for an issue or bug.

            CONTACT US

          • DEMOS

            GEOTOOLKIT DEMOS
            Geoscience Demos

    • INTViewer™
          • SUCCESS STORIES

            STRYDE
            Fast seismic QA/QC in the field

            SILVERTHORNE SEISMIC
            Efficient 2D/3D seismic data delivery

            WIRELESS SEISMIC
            Drones, IoT, and Advanced Onsite Seismic Data Validation

            SEE ALL >

          • SUPPORT

            GET SUPPORT
            Log a ticket for an issue or bug.

            CONTACT US

          • PLUG-INS

            EXTEND INTVIEWER
            More than 65 plugins available

  • Demos
    • GeoToolkit Demos
    • IVAAP Demos
  • Success Stories
  • Resources
    • Blog
    • Developer Community
    • FAQ
    • INT Resources Library
  • About
    • Overview
    • News
    • Events
    • Careers
    • Meet Our Team
    • About INT

INTViewer

Jan 04 2019

What We Learned about the Future of NetBeans from the Last 2 Years

It’s been two years since Oracle announced the donation of the NetBeans source code to the Apache software foundation. This move was much more than a licensing change — it was a bit of a new beginning for NetBeans.

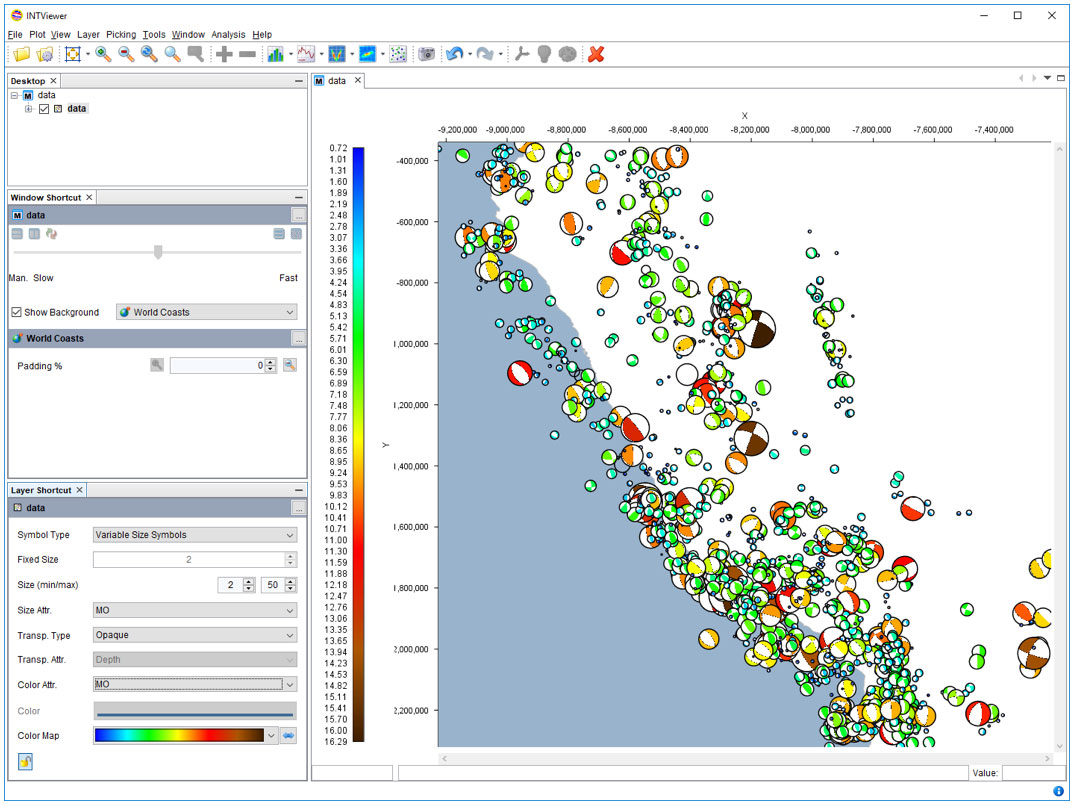
The NetBeans IDE is well liked at INT. In fact, INTViewer is built on top of the NetBeans platform, and the IVAAP backend was entirely written with the NetBeans IDE. With the release of NetBeans 10, now is a good time to look back and recognize the changes that this transition to Apache brought.

Better Licensing
Under Oracle’s stewardship, the NetBeans source code was available under two licenses: a Common Development and Distribution License (CDDL) and a GNU General Public License (GPL). The CDDL is not well known, and the GPL sometimes carries stigma. The license move is a clear win for the platform as Apache is appreciated in the Java community for its business-friendly license and ubiquitous libraries.

Open Governance
The Apache NetBeans project is still “incubating.” The incubation process allows the foundation to assess whether the donated code complies with legal standards and how the community adheres to Apache’s guiding principles. These principles are centered around openness and collaboration. You can see it at work on NetBeans’ own website: all communications are recorded and shared. This is actually a requirement from the Apache foundation to use mailing lists. No conversations behind closed doors. No secret agenda. When decisions are made, you can see how the consensus was built. The NetBeans project didn’t just get a “new home,” it inherited a renewed philosophy, a new process, moving from “open source” to “open governance.”

Ongoing Support
Oracle has been a significant contributor to NetBeans in the past. Despite the spin off, Oracle’s contributions continue to this day — the NetBeans project received in June a second code donation from Oracle, a donation that will enable JakartaEE projects. Two years ago, observers were worried that Oracle might be “abandoning” NetBeans to Apache. However, the last two years have proved that Oracle still intends to spend resources on NetBeans.

The move to Apache was also a good opportunity to modernize the community tools: Bugzilla was retired, making room for JIRA, and self-hosted Mercurial was replaced by Git, hosted on GitHub. These changes make contributions from developers easier to make, giving the community much more freedom to control its future.

The timing of this transition wasn’t the best. Effort that would have normally been spent by the NetBeans community to support Java 9, 10, and 11 was spent instead meeting Apache’s legal requirements. The release of NetBeans 10 officially closes this chapter. The NetBeans developers need to be recognized for their efforts during these two years. As all Java developers can attest, the transition to Java 11 of any code base is a challenge. This was certainly even more true for a large code base such as NetBeans’.

What’s Next for NetBeans?
This chapter has yet to be written. Discussions point to frequent updates, maybe every 6 months. Meanwhile, INT is working actively to integrate the NetBeans 10 platform to INTViewer. Personally, I feel that the NetBeans project is likely to attract a new crowd of developers. Developers who have an itch to scratch. Since the users of the NetBeans IDE are developers themselves, there is a definite sense that filing bug reports or proposing new features won’t be enough to get things done. Pull requests make it easier than ever to submit changes and I plan to scratch long-time itches myself — maybe INTViewer would benefit from some tweaks to the NetBeans window system. It’s time for all of us to use these newfound abilities.

Visit our products page for more information about INTViewer or IVAAP or contact us for a demo.


Filed Under: INTViewer, IVAAP Tagged With: INTViewer, ivaap, NetBeans

Dec 20 2018

How Window Synchronization Facilitates Visualization of a Large Number of Datasets

When we demo INTViewer, we typically use a laptop. We go to a customer site, project INTViewer on a big screen and open a few datasets to showcase the product. However, these short demos don’t really do justice to the capabilities of this software. While some customers will use the portability of INTViewer to present their data, others will use INTViewer on a workstation, with multiple monitors. And instead of opening a handful of windows, they will open a few dozen.

The typical use case for opening a large number of windows is when you want to monitor the multiple steps of a processing workflow. In such a use case where datasets are compared, it’s important that all visualizations share the same settings. INTViewer makes it really easy to open dozens of datasets at once. You can select a directory and open in one click all the datasets within that directory. But this is not where INTViewer’s productivity stops. Automatic synchronization facilitates the management of all these windows.

Synchronizing Windows

There are three types of synchronization: window, data selection, and layer. When you synchronize windows, you make sure that all windows use the same scale — when you zoom, all windows zoom at the same time; when you move the cursor in one window, the cursor shows the equivalent traces in all windows; and when you need to change annotations and add a header to the horizontal axis, this header is added automatically to all windows. Window synchronization is enabled by default so that geoscientists can focus on comparing their data, not on configuring their software.

Synchronizing Data Selections

When you control the multiple processing steps of one dataset, you need to make sure that you are comparing the same data slices. INTViewer offers multiple options to decide how to synchronize data selections as you navigate through your data. For example, when you open several volumes at once, they will all show the same INLINE slice by default. Each time you press the + button in the toolbar, the INLINE slice shown will change automatically, for all volumes.

You can also opt to show open different slices of the same volume. The offset between slices will also be kept as you navigate through your volume. And it’s not just XSection windows that synchronize their selection. 3D and Map windows also update when you change the slice of data you are visualizing.

Synchronizing Layers

The option to synchronize layers is not enabled by default, and it tends to be used only by power users. For example, when you visualize two datasets or two slices of the same dataset, you might want to synchronize their display attributes so that the same color bar is used by all visualizations, in one click. But it’s not just color bars that can be synchronized. The control over which attributes automatically synchronize is fine-grained, allowing a wide range of automatism.

Synchronization is a feature that has been built in to INTViewer since the beginning. Layer synchronization is the lesser used option of all 3 synchronization types. I found that many users tend to apply the same “profiles” to multiple layers instead of synchronizing them.

Grouping Windows

One other reason why INTViewer users might open a large number of datasets at the same time is the same reason why you have dozens of browser windows open right now: You are multitasking. Even within the same customer survey, you might work on multiple areas or multiple workflows. You could open multiple instances of INTViewer for each task, but there is a better way. INTViewer 2018 introduces the concept of grouped windows. By grouping windows, you isolate a logical group of windows from the others, making sure they only synchronize with windows from the same group.

Creating window groups is actually quite simple, and if you are a regular user of INTViewer, you already know how to do this. Just combine the plot of two windows into one, and you have a group. Isolating these two windows from the other windows on your desktop is then just one checkbox away.

Combining windows does affect the layout of your visualization. If combining windows is not a practical option, you can also create groups from the Desktop window. Pick several windows, right-click, and group them into a so called “window folder”.

Grouping Layers

The same concept is available when you need to limit the synchronization of layers to a logical set. Just like windows, layers can be grouped in folders. I have often seen layer folders used as part of custom plugins or scripts creating layers automatically. INTViewer is a platform, and its synchronization features are accessible from Python scripts and Java plugins. Developers use layer folders programmatically to setup on behalf of the user how multiple visualizations will behave once created.

Synchronization is a powerful mechanism within INTViewer. It “just works” by default, but it can be customized when your workflow demands it.

Visit our products page for more information about INTViewer or contact us for a demo.


Filed Under: INTViewer Tagged With: INTViewer

Sep 11 2018

Using INTViewer to Visualize Earthquakes and Other Seismic Activity

I often have a hard time explaining to friends and family what exactly INTViewer does. The moment I use the word “seismic,” the listener’s mind automatically shifts to the topics of seismic activity and earthquakes, and I need to explain oil & gas exploration technologies before I even get to the software. By then, I have lost my audience.

Today, I’ll try a different technique: I’ll describe the capabilities of INTViewer that actually cater to earthquake mapping. I will show how you can use the built-in capabilities of INTViewer to map recent earthquake activities.

To prepare for this blog article, I needed data. The United States Geological Survey (USGS) provides recent earthquake data on their website.

This data is provided in QuakeML format. INTViewer has a free plugin called Microseismic that opens QuakeML files directly. In this example, I downloaded the “All Earthquakes” QuakeML file for the past 30 days (all_month.quakeml), it opened right away, and after a few clicks, I got the visualization below:


World earthquake data last 30 days
World earthquakes from the last 30 days
Map is provided by Bing Maps
Data is provided by United States Geological Survey (USGS)


The color of each dot identifies the magnitude of each recorded event. I choose Bing Maps to show these events in context, requiring the installation of the free RemoteMap plugin.

There are a few websites proposing similar visualizations, but INTViewer can go further than these websites. For this example, I went to another data source, the International Seismological Centre (ISC) in the UK. This association compiles records of the earth seismicity, and provides a convenient way to search those records.

I decided to map earthquakes in Peru (longitudes from -83° to -65°, latitudes from -3° to -20°), starting from the 1970s to today. In the visualization below, the color and size of each dot identifies the depth of each recorded event.

Beachballs-coast
Peru earthquakes since 1970, showing depth variations
Map is provided by Bing Maps
Data retrieved from the ISC web site:
International Seismological Centre, On-line Bulletin


Seismologists typically use another type of visualization to identify the fault-plane solution, also known as focal mechanism. This mechanism describes the orientation of the fault plane that slipped as well as the slip vector. The colloquial name for this visualization is beachballs. Here are sample beachball representations provided by the Penn-State Geosciences Department:

focal-mechanisms
Focal mechanism examples


A single beachball describes three attributes of a seismic event: the strike, the dip, and the rake. These three attributes are present in the ISC exports and can be visualized in the form of beachballs in INTViewer. After changing the display options of my Peru session, I got the result below:

Beachballs-coast-2
Peru earthquakes since 1970, showing focal mechanisms
Data retrieved from the ISC web site:
International Seismological Centre, On-line Bulletin


Visualizing nature’s earthquakes is, of course, not a typical use of INTViewer, since most will use it as part of their seismic exploration QA workflow using data from manmade seismic events, but it is an interesting way to demonstrate how it works.

For more information about INTViewer, visit the INTViewer product page, or contact us for a free trial.


Filed Under: INTViewer Tagged With: beachball, earthquake data, INTViewer, seismic data

Aug 10 2018

5 Ways INTViewer Makes Offline Visualization Possible

I often say that INTViewer is a bit of a Swiss Army knife. It serves multiple purposes, and each company finds a different use. This makes it hard to decide which feature to highlight. In the past few years, as the industry moved to the cloud, we created a companion for INTViewer: INTGeoServer, which makes it easy to visualize data beyond the bounds of your network. This year, with the new release of INTViewer approaching, I will highlight the opposite feature of INTViewer: its ability to work offline, disconnected from the world.

Simple Installation and Small Footprint

There are several degrees of offline work. Wireless Seismic has worked with TotalEnergies to install seismic sensors in inaccessible areas, and they used INTViewer to monitor this process using drones. Data management companies routinely use INTViewer to show their data library to potential customers. These two use cases both take advantage of the fact that INTViewer can be installed on a laptop. It is easy to install and doesn’t require a backend server to visualize data. It is also frugal when it comes to memory footprint and disk usage. Both qualities are appreciated when you don’t have the luxury of a full workstation.

Smart Decimation Without Loss of Resolution

Seismic datasets tend to be very large. How do you fit terabytes of data on a laptop? INTViewer has a Lattice Decimation plugin that allows you to carry full-resolution copies of your data, but with decimation applied, reducing its size, making it possible for data library vendors to showcase their data without carrying a full copy. And with the session mechanism, it takes just one click to bring up a particular survey that a customer is interested in.

Versatile Window System

The user interface is also designed with laptop users in mind. When you use INTViewer to visualize the output of processing steps, you typically use INTViewer’s TABS mode, splitting your data between several screens. Most laptops only offer one screen and the alternate FRAMES mode allows an optimal use of screen real estate while opening multiple datasets.

Customizable Without IT Help

Being offline also means that you won’t get updates for a while. This is a common occurrence on survey boats, where the environment is tightly controlled and internet access is limited. To compensate for the lack of software updates, INTViewer users end up relying on Python to automate their work rather than waiting for the back office to send the latest version of a much-needed plugin. INTViewer lets laptop users be truly independent.

Borrow Licenses from Your Company’s License Server

None of this would matter if INTViewer’s license was restrictive. When you acquire an INTViewer license, you have several options. Large installations prefer a pool of licenses accessible from a license server, but this option doesn’t work when you go offline. This is why INT has always offered licenses that are tied to particular machines, or even USB dongles, without the need to connect to a server. However, until now, companies had to choose the type of license right away. The new release of INTViewer offers more versatility by enabling borrowing of licenses. You can still host your licenses on a server, borrow one of them on your laptop, then disconnect from the network completely. INTViewer will still open and function fully, despite being disconnected from a license server, for the specified duration. With this new feature, we hope to find more users carrying INTViewer with them, on the go, wherever Oil & Gas takes them.

For more information about INTViewer, visit the INTViewer product page, or contact us for a free trial.


Filed Under: INTViewer Tagged With: INTViewer, offline visualization

Jul 12 2018

Installing the Seismic Unix Library on Windows [Walkthrough]

*This post has been recently updated to reflect 2022 updates.

In our previous blog, Simplifying the Learning Curve of the Seismic Unix Library, we described how INTViewer can leverage the SU library. This library is typically meant for Linux, but it can also be used on Windows. This walkthrough describes how to install the SU Library on Windows 10 to use the Seismic Workbench plugin.

The installation of the Seismic Unix Library includes 3 steps:

  • Download the SU Library code and Cygwin
  • Install and configure Cygwin
  • Compile the SU Library code

For this walkthrough, we use SU Library 44R23 and Cygwin 2.881.

Downloading the SU Library Code

The SU Library code can be downloaded here: https://wiki.seismic-unix.org/doku.php

Extract the contents of the downloaded .tgz file to C:\apps\cwp_su_all_44R23

Downloading Cygwin

Cygwin can be downloaded here: https://cygwin.com/install.html

Choose the 32 bit version of Cygwin (not 64).

Installing and Configuring Cygwin

To install Cygwin, execute its installer (setup-x86.exe). This will install the Cygwin program, which when run, creates a POSIX shell window similar-looking to the Windows command window but which behaves in a more Unix-like way.

You will need to install several additional Cygwin components before your workflows can run. To get these, run the installer program (called Setup and represented by an icon with a black “C” shape enclosing a green arrow). Click Next →.

Click Next →.

su3

Choose an installation directory and click Next →. This tutorial assumes that the default location is not used.  Instead of “C:\cygwin64” use “C:\cygwin”. Installing Cygwin in the root of a drive in a folder named “cygwin” is good practice since it will be detected automatically by INTViewer in this configuration.

seismic unix library installation - INTViewer

Choose a directory where Setup will store installation files. This directory can be reused for future installs so that the download doesn’t have to be repeated. Click Next →.

On this screen, you can choose your connection options. Click Next →.

Select a download site, preferably the one closest to you. Click Next →.

seismic unix library installation - INTViewer

Now we need to select all of the packages required for compiling Seismic Unix. The Search field is a handy way to quickly find the packages. Just enter text to search, but do NOT press Enter, as this will cause the installer to move to the next page.

First, select gcc-core. To select a package, use the drop-down menu to select the version shown…

Next, select gcc-g++.

Next, select make.

7

Next, select libgcc1.

Next, select libgd-devel.

Next, select both libQtOpenGL4 packages.

10

Next, select libtiff-devel.

Next, select libXaw-devel.

Next, select rpcbind.

Next, select libnetpbm-devel.

Next, select tiff-opengl.

Finally, select libX11-devel. Click Next →.

The following screen will display any dependencies required for the selected packages. Click Next →. Cygwin will proceed to download and install all of the selected packages and required dependencies.

seismic unix library installation - INTViewer

Create an icon on the desktop or start menu if desired. Click Next →.

Copy .bash_profile and .bashrc from C:\cygwin\etc\defaults\etc\skel and place them in your standard Windows user directory. (C:\Users\Josh for me)


Add the following lines to the end of each file:

# Setup for SU
export CWPROOT=/cygdrive/c/apps/cwp_SU_all_44R23
# Setup PATH to include SU
export PATH=$CWPROOT/bin:$PATH


Compiling the SU Library Code

Now that Cygwin is set up, we need to compile the Seismic Unix code. First, copy the file Makefile.config_Cygwin_32 located at C:\apps\cwp_su_all_44R23\src\configs to C:\apps\cwp_su_all_44R23\src\.

Replace Makefile.config located at C:\apps\cwp_su_all_44R23\src with the copied file.

Run Cygwin, and navigate to /cygdrive/c/apps/cwp_su_all_44R23/src. Once here, enter the make install command. This will compile the standard Seismic Unix code.

After the previous make file is finished, enter the make xtinstall command. This will compile the X-toolkit code.

Cygwin and the SU Library are now ready to use!

Testing the Installation

As a quick test, open the Cygwin command line, and enter the following command line, and enter the following command, modifying the paths to match your directory structure. A copy of the SEG-Y file should have been created if the installation was successful.

segyread tape=/cygdrive/d/data/Segy/Tony/stack-tony.sgy | segywrite tape=/cygdrive/d/data/Segy/Tony/stack-tony-out.sgy

For more information about INTViewer, visit the INTViewer product page, or contact us for a free trial.


Filed Under: INTViewer Tagged With: INTViewer, plugins, seismic unix, SU library

  • « Go to Previous Page
  • Page 1
  • Page 2
  • Page 3
  • Page 4
  • Interim pages omitted …
  • Page 6
  • Go to Next Page »

Footer

Solutions

  • Real-Time Visualization
  • Visualization Components
  • New Energy Visualization
  • OSDU Visualization
  • Machine Learning
  • Developer Tools
  • Cloud Partners
  • Customer Success Stories

Products

  • IVAAP
  • GeoToolkit
  • INTViewer
  • IVAAP Demos
  • GeoToolkit Demos

About

  • News
  • Events
  • Careers
  • Management Team

Resources

  • Blog
  • FAQ

Support

  • JIRA
  • Developer Community

Contact

INT logo
© 1989–2024 Interactive Network Technologies, Inc.
Privacy Policy
  • Careers
  • Contact Us
  • Search

COPYRIGHT © 2025 INTERACTIVE NETWORK TECHNOLOGIES, Inc