• Skip to main content
  • Skip to footer

INT

Empowering Visualization

COMMUNITY BLOG
CONTACT US SUPPORT
MENUMENU
  • Solutions
    • Overview
    • Real-Time Visualization
    • Visualization Components
    • New Energy Visualization
    • OSDU Visualization
    • Machine Learning
    • Developer Tools
    • Cloud Partners
  • Products
    • IVAAP™
          • SOLUTIONS

            Real-Time Visualization

            OSDU Visualization

            Visualization Components

            New Energy Visualization

            Upstream Data Visualization

          • SUCCESS STORIES

            WEATHERFORD
            Well delivery optimization software

            BARDASZ
            Data management, data quality monitoring

            ANPG / SATEC-MIAPIA
            Virtual data room

            MAILLANCE
            High-performance visualization of ML algorithms

            SEE ALL >

          • SUPPORT

            DEVELOPER COMMUNITY
            Join or log in to the INT Developer Community.

            GET SUPPORT
            Log a ticket for an issue or bug.

            CONTACT US

          • DEMOS

            IVAAP DEMOS
            Cloud-Based Demos

            FIRST TIME HERE?
            Register to access our
            IVAAP demos

    • GeoToolkit™
          • SUCCESS STORIES

            CAYROS
            Field development planning

            TOTALENERGIES
            High-performance large dataset reservoir rendering

            IFP ENERGIES NOUVELLES
            Seismic and structural interpretation validation

            SEE ALL >

          • SUPPORT

            DEVELOPER COMMUNITY
            Join or log in to the INT Developer Community.

            GET SUPPORT
            Log a ticket for an issue or bug.

            CONTACT US

          • DEMOS

            GEOTOOLKIT DEMOS
            Geoscience Demos

    • INTViewer™
          • SUCCESS STORIES

            STRYDE
            Fast seismic QA/QC in the field

            SILVERTHORNE SEISMIC
            Efficient 2D/3D seismic data delivery

            WIRELESS SEISMIC
            Drones, IoT, and Advanced Onsite Seismic Data Validation

            SEE ALL >

          • SUPPORT

            GET SUPPORT
            Log a ticket for an issue or bug.

            CONTACT US

          • PLUG-INS

            EXTEND INTVIEWER
            More than 65 plugins available

  • Demos
    • GeoToolkit Demos
    • IVAAP Demos
  • Success Stories
  • Resources
    • Blog
    • Developer Community
    • FAQ
    • INT Resources Library
  • About
    • Overview
    • News
    • Events
    • Careers
    • Meet Our Team
    • About INT

INTViewer

Jun 21 2018

How the NetBeans Module System Helps Us Maintain Compatibility Between Releases

Most of the talk about Java 9 has been about the new module system. Two decades after its creation, the Java runtime has finally become modular. A modular approach not only makes dependency management easier, but it also makes applications more efficient as unused modules don’t need to be loaded.

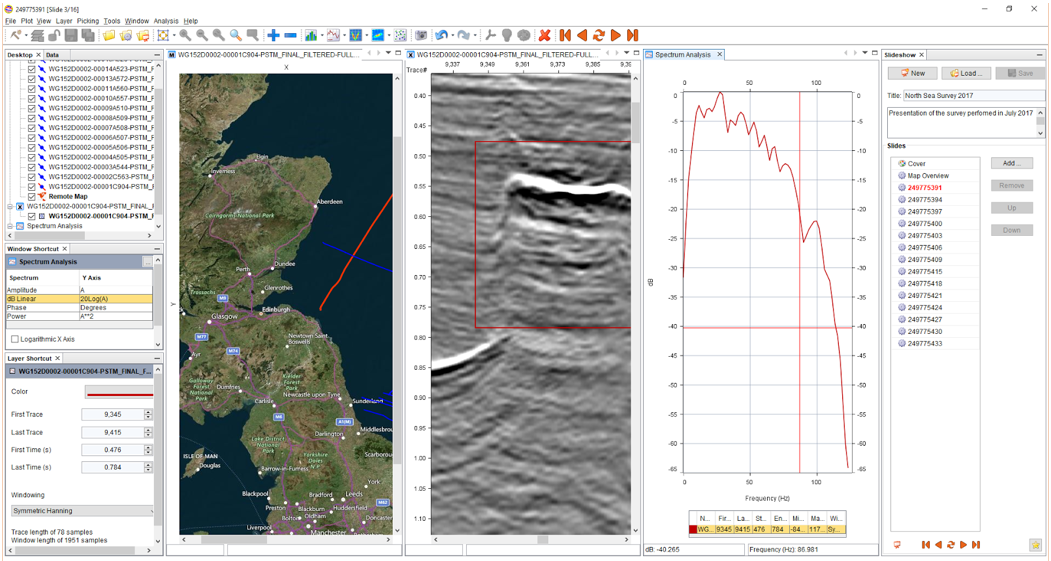
The NetBeans Platform predates Java 9 and has been using its own module system for years. With INTViewer being a desktop application built on top of the NetBeans Platform, I have come to like this system and I’d like to talk about 3 aspects in which it is far superior to the Java 9 module system for my use cases.

Split Packages

One of the core aspects of both the NetBeans Platform and the Java 9 module system is that modules are identified uniquely by a root package name. Where they differ is that the Java 9 module system doesn’t allow two modules to have classes under the same root package name. The logic behind this is that the Java runtime can’t quickly resolve where to find each class if the rules to find the matching module are complex or even ambiguous. Java 9 doesn’t allow so-called “split packages.”

The NetBeans Platform doesn’t have this restriction, and over the 10 years that I have worked on INTViewer, this has helped us tremendously building INTViewer as a modular platform. Many times, we found ourselves realizing that one module was “too big” and needed to be split. If we had to follow the “no split packages” rule, we would have had to change the package of some classes, breaking class-level backward compatibility.

This “stable class-level API” is a very important concern for us. With customers and vendors building their own applications on top of INTViewer, we can’t afford to change the public API at each release. Our customers wouldn’t allow it: they can’t refactor their code so often. When we do need to split a module, customers are generally okay with changing the coarse-grained dependencies of their app; adding a new module to their dependencies is easy and doesn’t require any code change.

Module Versioning

It’s a simple feature, but very powerful. When INTViewer starts, the NetBeans Platform verifies every plugin before it gets loaded. If one of them relies on another module that is not present, this plugin doesn’t load. Similarly, if a plugin requires a module to be up-to-date and the NetBeans Platform finds that this requirement is not met, this plugin won’t load. Practically, this prevents mixing plugin versions. A plugin built for INTViewer 5.2 won’t load in INTViewer 5.1. The NetBeans Platform gives immediate feedback to the person performing the plugin installation.

The Java 9 module system doesn’t support module versioning. The versioning concern is left to the dependency-resolution systems like Maven. But these systems perform checks at compile time, not when the application is used.

Mixing Library Versions

This is not a trick we use often, but it’s a lifesaver when we have to. When our customers build their own plugins, they typically leverage .jar files built by other entities. We do, too, and in a typical Java application, there is only one class loader to load all these .jar files. If two versions of the same library are present, the resolution of class names is ambiguous and the application fails in strange ways. The Java 9 module system doesn’t provide a direct way to address this concern.

The NetBeans Platform uses its own class loaders. To simplify, each module has its own. Each class loader only needs to deal with a well-defined set of dependencies, and other class loaders are not affected by these dependencies.

For example, we have two optional plugins making use of the JAXB library, a popular building block to read XML files. One of them is the VTK plugin, a plugin to visualize 3D models. Another one is the Reservoir plugin, a plugin to visualize RESQML datasets. These two plugins can coexist in the same INTViewer deployment without problems, and they don’t even need to have the same version of JAXB.

In a classic Java application, a choice would have to be made: which version of JAXB is “the right one,” and the module using the “wrong version” would have to be updated. The NetBeans Platform makes it really easy to deal with these version conflicts. As a result, INTViewer customers are not faced with refactoring their code for each release just because another unrelated module needed a more recent version of a specific library.

INT has greatly benefited from the NetBeans Platform. Its module system is both powerful and easy to use. It has allowed us to provide, release after release, a painless way to maintain INTViewer plugins, for ourselves and for our customers.

For more information about INTViewer, visit the INTViewer product page, or contact us for a free trial.


Filed Under: INTViewer Tagged With: INTViewer, modules, NetBeans, releases

Jan 26 2018

Simplifying the Learning Curve of the Seismic Unix Library

A graphical user interface to help jumpstart your SU Library adoption

The SU (Seismic Unix) Library is a well-known set of utilities used to research and process seismic data. Supported by the Center for Wave Phenomena (CWP) at the Colorado School of Mines (CSM), it is a powerful package that is widely used in the geoscience community.

Following the Linux philosophy, each utility within this package is a separate command. For example, the segyread command converts SEG-Y files to the SU format. With hundreds of commands at your disposal, and with each command having multiple parameters, it can be a daunting task to get started.

INTViewer provides a graphical user interface for the SU library, reducing the learning curve. The Seismic Workbench is a free plugin that has the documentation for the SU library built in, making it easy to find a particular command and all the parameters that this command requires. INTViewer builds the full command line for you based upon all individual commands selected. [See the Seismic Workbench plugin video walkthrough here.]

An example of generated command line

You can elect to run this command line from inside INTViewer or from your own terminal. Running inside INTViewer provides neat integration options: Not only you can leverage INTViewer’s built-in trace processors and generators, but you can also visualize in real time the datasets that each step creates. The workbench allows you to customize the display parameters of each output dataset, and save your set of steps as a complete job for later reuse.

An example of processing step configuration

While the SU Library was built with Linux in mind, Windows users are not without options. They typically use Cygwin to run native Linux applications, including the SU library utilities. [Stay tuned for our next blog describing the complete installation of Cygwin and the SU Library on Windows.] Users of the seismic workbench have reported that the graphical user interface and the integration with INTViewer made the SU Library much more accessible.

For more information about INTViewer, visit the INTViewer product page, or contact us for a free trial.


Filed Under: INTViewer Tagged With: INTViewer, seismic, unix

Dec 01 2017

How to Improve Performance and Reduce Latency of Your Geoscience Data

Storing and accessing large, sometimes sensitive geoscience data is one challenge many top E&P companies face.

Local access is great, but not every user in the world can have local access to the same data. Replication is an option, but with the size of seismic datasets reaching terabytes, this is not practical. In the real world, users only have access to a limited set of local data.

Common Solution Leads to Performance Issues

Many companies store data all over the world. The common infrastructure to allow ubiquitous access to data is to share these files using NFS, a well-known distributed file system protocol used by Linux-based servers.

The issue with NFS is that it is a “chatty” protocol: Many messages are sent back and forth between the client and the server. This is fine when all machines are physically close to each other, but the further away they get, the more latency you introduce. As a result, performance degrades.

NFS is also essentially transparent to the software using it. Some software, like INTViewer, doesn’t “know” that your data is remote, so it can’t optimize its data fetching strategy to the characteristics of your infrastructure. Actually, for seismic data, it assumes that access to individual traces is fast.

A Better Option

This is where INTGeoServer comes into play. Access to data hosted on INTGeoServer—a server with a modern architecture that uses web services to stream geoscience data—is optimized so that there is a limited number of back-and-forth messages. In other words, by installing INTGeoServer next to your data, you make this data accessible from remote places as if it were local.

INTGeoServerNFSGraphic2

To visualize any geoscience file in INTViewer, simply drag and drop that file from the file system to INTViewer’s main window and its content appears automatically. From this experience, it might seem that INTViewer is tied to the file system where it resides, meaning it can only read data from that file system. While this is a common use case, using INTGeoServer removes the requirement to have INTViewer and your data on the same file system.

From an INTViewer user point-of-view, the protocol used to access the data doesn’t change the interaction—the visualizations are the same, the analysis tools work the same way. From a system administrator point of view, however, the burden of maintaining worldwide NFS shares is lifted. And the benefit of accessing that data in larger chunks is that the performance profile improves substantially.

For more information about INTViewer and INTGeoServer, visit the INTViewer product page, or contact us for a free trial.


Filed Under: Uncategorized Tagged With: cloud, data storage, INTGeoServer, INTViewer

Oct 02 2017

Live Completion Is Better than AutoCompletion

A major feature of INTViewer 5.2 is the Python integration. Our development team worked very hard to ensure that our customers can get started easily and be productive once they are hooked.

One consistent user feedback was that the Python terminal lacked autocompletion. It could become tedious to have to type the full name of each class, each method or each variable. We took this feedback to heart and implemented autocompletion in INTViewer 5.2.

Just like any other editor, to trigger autocompletion, just type a partial name then press Ctrl+Space on your keyboard. If there is only one match possible, the Python terminal will autocomplete your line.

For example, if a seismic layer has the variable name “layer”, typing layer.setPl will autocomplete to layer.setPlotType(.

Another refinement is that the signature of the setPlotType method is displayed at the bottom of the screen. Also, the parameter that this method expects is displayed as a shadow in the same line.

Python terminal plot type layer
The Python terminal as you change the plot type of a layer
 
 
If several matches are possible, a contextual menu is shown.

Python Contextual Menu


All of these features are expected in a Python editor. But to deliver on the promise that the INTViewer Python API was easy to learn, we wanted to go beyond. The first work order was to add the concept of enumeration. If a method only accepts a defined set of parameter values, these values should be hinted at. Upon pressing Ctrl+Space on your keyboard, the Python terminal will show all these possible values.

In this contextual menu, the menu items with a purple dot show enumerated values. The green dots are for variables already defined and the yellow dots are for class constructors.

The autocompletion of plot types
 
 
If you plug your own Python classes, we made it incredibly easy to enable completion for enumerated values, just by adding a StaticStringEnumParam annotation. Here is an example for the setPlotType method:

Python StaticStringEnumParam annotation
Example of use of the StaticStringEnumParam annotation
 

In the Java language, enumerations are static: The set of values is defined as part of the enumeration definition and cannot be changed.

Python terminal - trace processor
The Python terminal as you create a trace processor
 

INTViewer is a highly pluggable application and enumerated sets are often only known at runtime. For example, many customers plug their own trace processors. It’s only when INTViewer starts that each installed plugin is inspected for trace processors. As a result, we also implemented dynamic enumerations.

The SeismicLayerProcessor class is the perfect example of dynamic enumerations. To find the list of possible trace processor names, INTViewer looks up which trace processors are currently plugged.

 
The definition of such dynamic enumerations is also quite simple. With the DynamicStringEnumParam annotation, INTViewer searches for the specified method in the specified class to generate the list of proposed options.

Python DynamicStringEnumParam annotation
Example of use of the DynamicStringEnumParam annotation
 

This is the first example of a “live” autocompletion. This is a feature that commercial Python editors typically do not provide because they lack the deep integration with the runtime environment.

If we only provided dynamic enumerations, calling our autocompletion “Live Completion” would be a bit of a stretch. The ground-breaking feature is that this live autocompletion doesn’t just apply to classes, it also applies to instances of these classes.

For example, in the screenshot below, the dataset manipulated has only 2 keys: TraceNumber and Time. When I type data.getMinimum(, the two proposed values are TraceNumber and Time.

Python terminal - raw Segy dataset
The Python terminal as you retrieve the boundaries of a raw Segy dataset
 
For another dataset that has 3 keys, I will get a different set of key names:

Python Indexed Segy
The Python terminal as you retrieve the boundaries of an indexed Segy dataset
 
As enumerated values are generated dynamically based upon the instance, not the class, we are able to provide a much more powerful autocompletion than a typical Python editor can provide. A python editor doesn’t execute your code, it can only perform a static analysis. The Python terminal has a different behavior where each line entered is executed on the fly, allowing us to inspect the set of local variables already defined and make more much insightful suggestions.

Defining your own dynamic instance-based enumeration is simple. In the example below using the InstanceStringEnumParam annotation, getKeyNames is a method defined in the same class as the getKeyMinimum method.

Python InstanceStringEnumParam annotation
Example of use of the InstanceStringEnumParam annotation


Dynamic enumerations really provide extra help for users to learn the INTViewer API. It’s a powerful mechanism that we also leverage when users instantiate datasets. Each resource in INTViewer has a path, typically a file path. Remembering and typing that exact file path is a cumbersome task, so we made the entry of paths “live” as well.

Python terminal local seismic dataset
The Python terminal as you enter the path to a local seismic dataset


INTViewer recognizes the methods that require paths as parameters, and autocompletes these parameters, filtering out files that are not of the specified type. You are not limited to browsing your local file system—this autocompletion also works for remote data servers such as INTGeoServer:

Python terminal remote seismic dataset
The Python terminal as you enter the path to a remote seismic dataset


As a developer, you can easily leverage this mechanism with the DataPathParam annotation. Here is the definition of the SeismicData constructor:

Python DataPathParam annotation
Example of use of the DataPathParam annotation


For files that are not data files, a simple PathParam annotation is available:

Python PathParam annotation
Example of use of the PathParam annotation


We put a great deal of effort into INTViewer Python capabilities and are really proud of what we were able to accomplish. To get started with Python in INTViewer, visit our help guide!

For more information about INTViewer, check out our other blogs, visit the INTViewer product page, or contact us for a free trial.


Filed Under: Uncategorized Tagged With: autocompletion, INTViewer, live completion, python

Aug 22 2017

How to Create Interactive Slideshows (VIDEO)

Presenting data to clients regularly poses many challenges, especially considering that today’s datasets are likely to exceed a petabyte or more. Presentations made with tools like PowerPoint may take hours to create, are instantly obsolete, and frequently don’t fully answer your clients’ questions.

With one simple plugin, INTViewer transforms the art of showing data to your clients by combining the simplicity of a slideshow with the power of live data.

Quick tip: Check out our INTViewer slideshow tutorial to get started!


Create, Share, and Standardize Presentations

The INTViewer slideshow plugin streamlines how your company presents data to potential customers.

Data managers can create slideshows in INTViewer and share them with their colleagues.

Large datasets can be transferred to laptops without any loss of definition using the lattice decimation plugin, making INTViewer slideshows portable.

This new presentation medium saves time and can help standardize how your sales team presents data, while leaving enough flexibility to answer customer questions.

Easy to Learn, Easy to Use

Presentations built using INTViewer work just like other presentation software—once you load the slideshow, press play to start, then press the Next button to go from one slide to another.

Create slideshows easily with INTViewer.

The slideshow window allows you to jump to a different slide without losing context.

2D-map-lines
This slide shows all of the lines at once.
verify-data-easily
The next slide shows the map and a cross-section of the highlighted 2D line.
Manipulating the data is incredibly easy. For example, to verify the definition of your data, you can zoom in just by holding the shift key and drawing a box around the section you want to view.

And to investigate a problematic area, you can view a spectrum analysis with just one click (S+draw a box).

seismic-analysis

Ready to make your presentations interactive?

For more information about INTViewer, check out our other blogs, visit the INTViewer product page, or contact us for a free trial.


Filed Under: INTViewer Tagged With: data, INTViewer, presentation, slideshow

  • « Go to Previous Page
  • Page 1
  • Page 2
  • Page 3
  • Page 4
  • Page 5
  • Page 6
  • Go to Next Page »

Footer

Solutions

  • Real-Time Visualization
  • Visualization Components
  • New Energy Visualization
  • OSDU Visualization
  • Machine Learning
  • Developer Tools
  • Cloud Partners
  • Customer Success Stories

Products

  • IVAAP
  • GeoToolkit
  • INTViewer
  • IVAAP Demos
  • GeoToolkit Demos

About

  • News
  • Events
  • Careers
  • Management Team

Resources

  • Blog
  • FAQ

Support

  • JIRA
  • Developer Community

Contact

INT logo
© 1989–2024 Interactive Network Technologies, Inc.
Privacy Policy
  • Careers
  • Contact Us
  • Search

COPYRIGHT © 2025 INTERACTIVE NETWORK TECHNOLOGIES, Inc