• Skip to main content
  • Skip to footer

INT

Empowering Visualization

COMMUNITY BLOG
CONTACT US SUPPORT
MENUMENU
  • Solutions
    • Overview
    • Real-Time Visualization
    • Visualization Components
    • New Energy Visualization
    • OSDU Visualization
    • Machine Learning
    • Developer Tools
    • Cloud Partners
  • Products
    • IVAAP™
          • SOLUTIONS

            Real-Time Visualization

            OSDU Visualization

            Visualization Components

            New Energy Visualization

            Upstream Data Visualization

          • SUCCESS STORIES

            WEATHERFORD
            Well delivery optimization software

            BARDASZ
            Data management, data quality monitoring

            ANPG / SATEC-MIAPIA
            Virtual data room

            MAILLANCE
            High-performance visualization of ML algorithms

            SEE ALL >

          • SUPPORT

            DEVELOPER COMMUNITY
            Join or log in to the INT Developer Community.

            GET SUPPORT
            Log a ticket for an issue or bug.

            CONTACT US

          • DEMOS

            IVAAP DEMOS
            Cloud-Based Demos

            FIRST TIME HERE?
            Register to access our
            IVAAP demos

    • GeoToolkit™
          • SUCCESS STORIES

            CAYROS
            Field development planning

            TOTALENERGIES
            High-performance large dataset reservoir rendering

            IFP ENERGIES NOUVELLES
            Seismic and structural interpretation validation

            SEE ALL >

          • SUPPORT

            DEVELOPER COMMUNITY
            Join or log in to the INT Developer Community.

            GET SUPPORT
            Log a ticket for an issue or bug.

            CONTACT US

          • DEMOS

            GEOTOOLKIT DEMOS
            Geoscience Demos

    • INTViewer™
          • SUCCESS STORIES

            STRYDE
            Fast seismic QA/QC in the field

            SILVERTHORNE SEISMIC
            Efficient 2D/3D seismic data delivery

            WIRELESS SEISMIC
            Drones, IoT, and Advanced Onsite Seismic Data Validation

            SEE ALL >

          • SUPPORT

            GET SUPPORT
            Log a ticket for an issue or bug.

            CONTACT US

          • PLUG-INS

            EXTEND INTVIEWER
            More than 65 plugins available

  • Demos
    • GeoToolkit Demos
    • IVAAP Demos
  • Success Stories
  • Resources
    • Blog
    • Developer Community
    • FAQ
    • INT Resources Library
  • About
    • Overview
    • News
    • Events
    • Careers
    • Meet Our Team
    • About INT

maps

Feb 17 2022

How Apache SIS Simplifies the Hidden Complexity of Coordinate Systems in IVAAP

See how Apache SIS, with IVAAP, helps support our client’s coordinate systems by using less code.

With the recent release of IVAAP 2.9, now is a good time to reflect on the help we got along the way. One of the components that made IVAAP possible is the Apache SIS library. The goal of this blog article is to bring more visibility to this awesome Java library.

What Is the Apache SIS Library?

Apache SIS is an open-source library written in Java that makes it easier to develop geospatial applications. Many datasets have metadata designating their location on Earth, and these locations are relative to a datum and a map projection method. There are many datums and many map projection methods. Apache SIS facilitates their identification and the accurate conversion of coordinates between them.

What’s a Datum and What’s a Map Projection Method?

Most people are familiar with latitude and longitude coordinates. This geographic coordinate system has been used for maritime and land-based navigation for centuries. Since the late 1800s, the line defining 0º of longitude has been the Prime meridian, crossing the location of the Royal Observatory in Greenwich, England. This meridian defined one axis, from South to North. The equator defined the other axis, from West to East. The origin point of this system on the Earth’s surface is in the Gulf of Guinea, 600 km off the coast of West Africa.

The traditional geographic coordinate system
The traditional geographic coordinate system (Source)


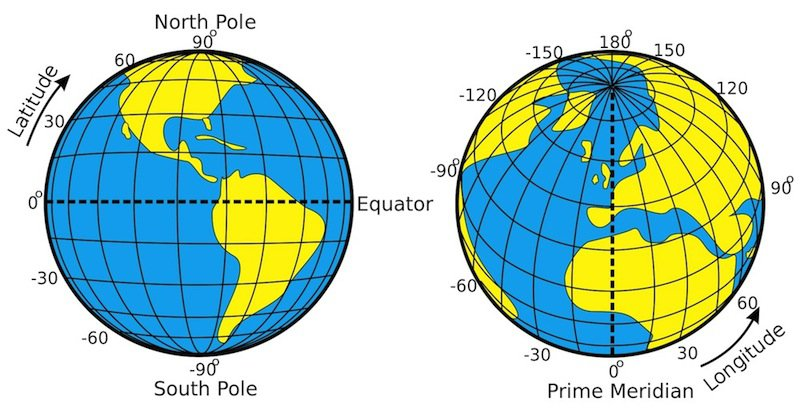
Similarly, a datum defines the origin point of the coordinate axes on the Earth’s surface and defines the direction of the axes. To account for the fact that the Earth is not a perfect sphere, a datum also describes the generalized shape of the Earth. For example, WGS 84 (World Geodetic System 1984) is a widely-used global datum based on latitudes and longitudes where the Earth is modeled as an oblate spheroid, centered around its center of mass.

The WGS 84 reference frame. The oblateness of the ellipsoid is exaggerated in this image. (Source)


WGS 84 is used by GPS receivers and the longitude 0º of this datum is actually 335 ft east of the Greenwich meridian.

While universal latitude and longitude coordinates are convenient, they are not universally practical because of land masses drift. Satellite measurements show that the location of Houston relative to the WGS 84 datum changes by 1 inch each year. A local datum is a more pragmatic choice than a global datum because distances from a local point of reference are smaller and don’t change over the years when all locations are on the same tectonic plate. A local datum may also align its spheroid to closely fit the Earth’s surface in this particular area.

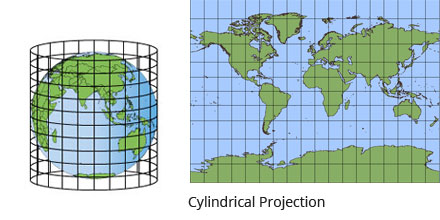
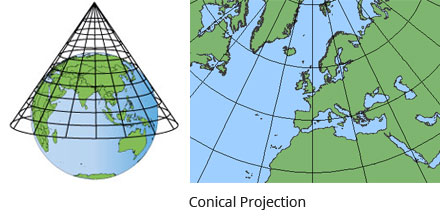
A map projection method indicates how the Earth’s surface is flattened into a plane in order to make a 2D map. The most widely known projection method was presented by Gerardus Mercator in 1569. This is a global cylindrical projection method. It preserves local directions and shapes but distorts sizes away from the equator.

Cylindrical Projection
An example of global cylindrical projection (Source)


In the US, the Lambert Conformal Conic projection has become a standard projection for mapping large areas. This is a projection that requires multiple parameters, defining the longitude and latitude of its center, a distance offset to this center, and the latitude of its southern and northern parallels.

Conical Projection
An example of local conical projection (Source)


When a datum and a projection are used together, they define a projected coordinate reference system. While local systems limit distortions, they are only valid in a small area, an area known as the ”area of use” where a minimum level of accuracy is guaranteed.

Select Coordinate System
A screenshot from INTViewer showing the area of use of NAD27 / Wyoming East Central, a derived projected coordinate reference system


How Does Apache SIS Help IVAAP?

To show geoscience datasets on one of IVAAP’s 2D map widgets, you need to use a common visualization coordinate reference system.

IVAAP Screenshot
An IVAAP screenshot showing the location of wells on a map


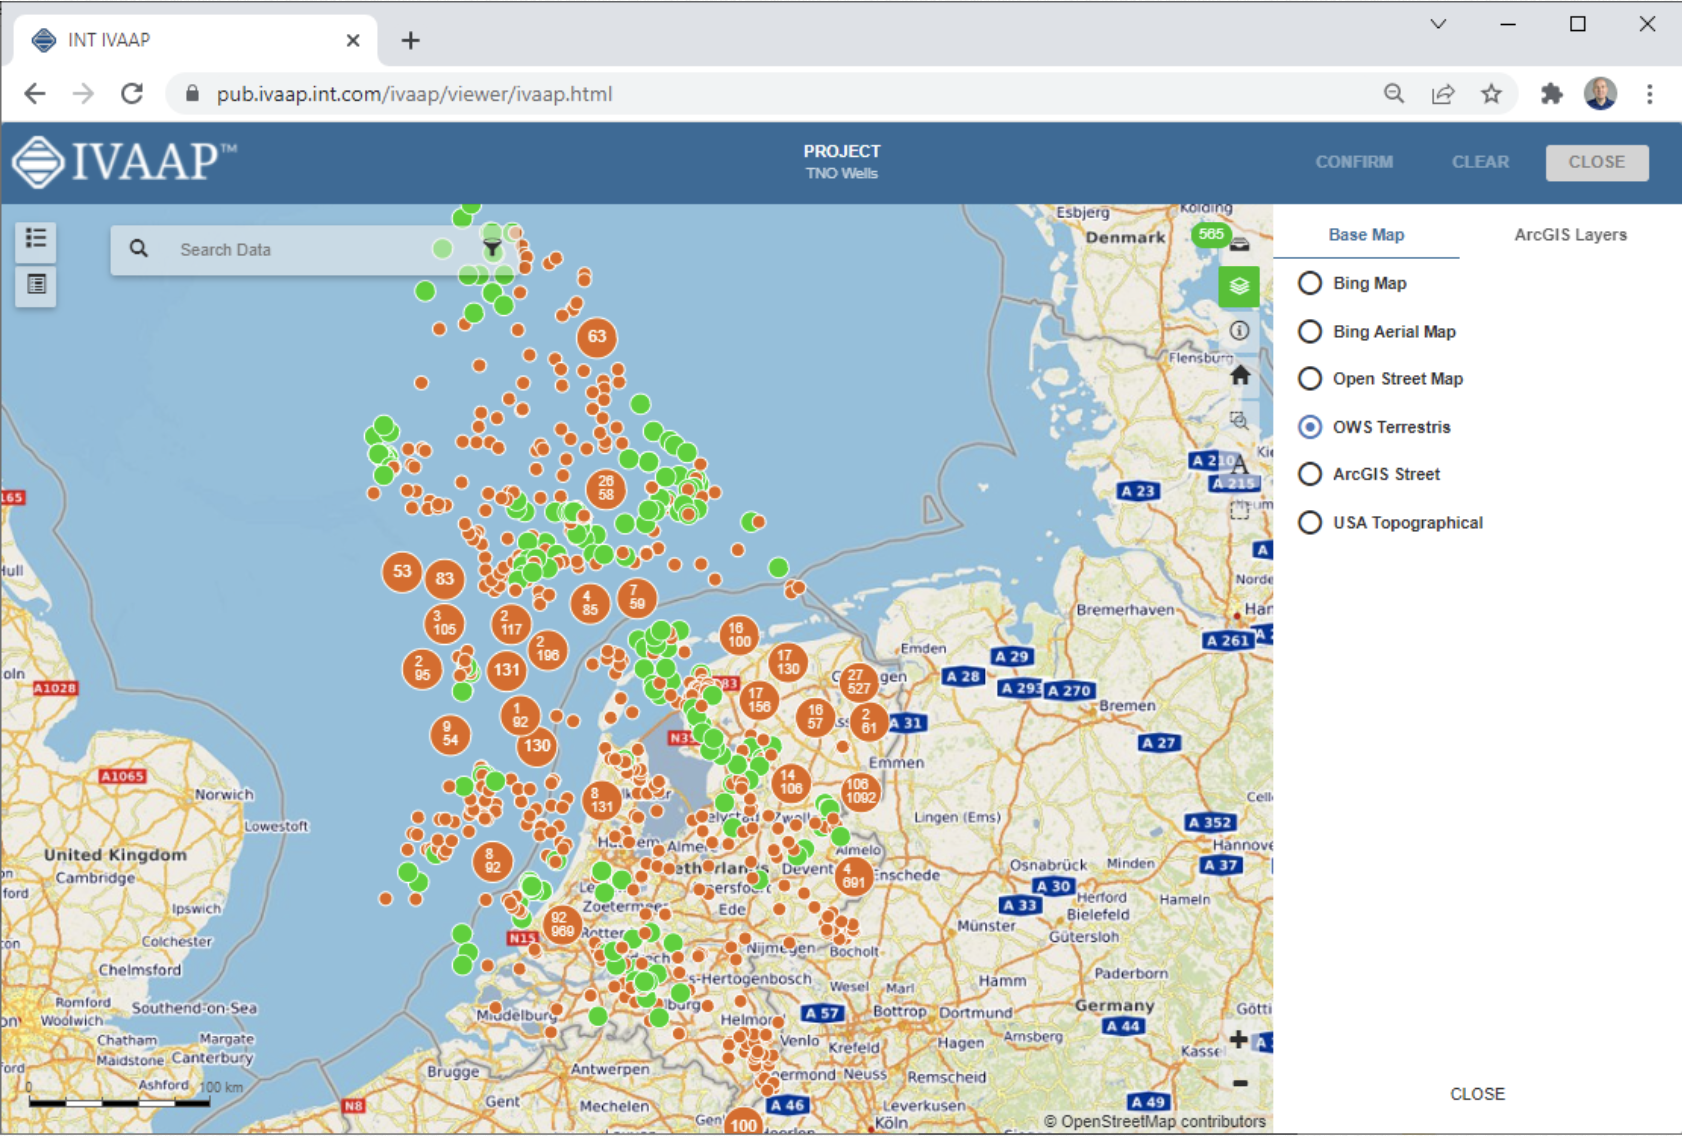
This is where Apache SIS helps us: It understands the properties of both the data and visualization systems and is able to convert coordinates between them.

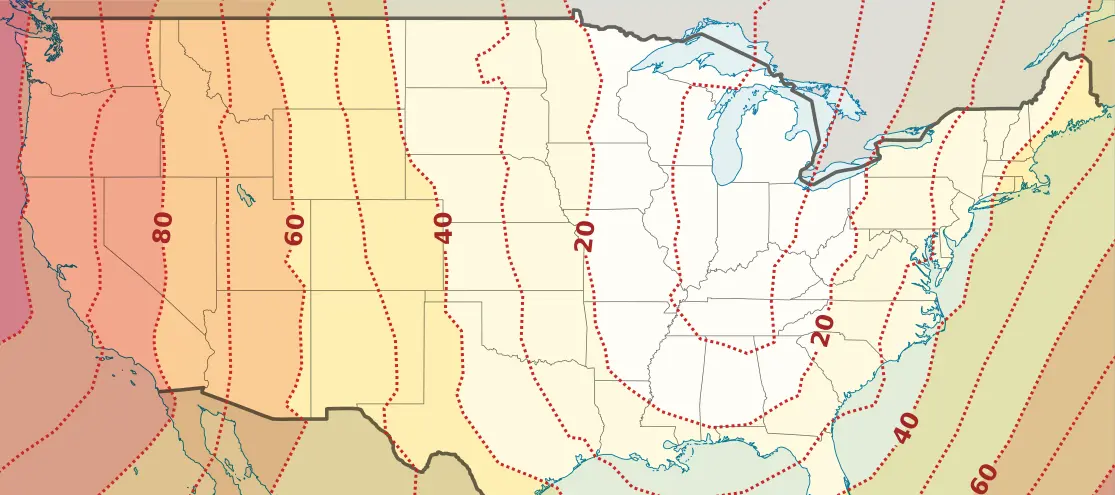
The math to perform these conversions is complex, this is not something you want to implement on your own. It requires specialized skills, both as a programmer and a domain expert. And just beyond the math, the number of datums and projection methods is mind-boggling. Many historical surveys are still in use today. For example, there are two datums used for making horizontal measurements in North America: the North American Datum of 1927 (NAD 27) and the North American Datum of 1983 (NAD 83). The two datums are based on two different ellipsoid models. As a result, the two datums have grid shifts of up to 100 meters, depending on location. IVAAP is able to visualize datasets that used NAD 27 as a reference, and it is Apache SIS that makes it possible to accurately reproject these coordinates into modern coordinate systems, accounting for their respective datum shift.

The datum shift between NAD 27 and NAD 83 (Source)


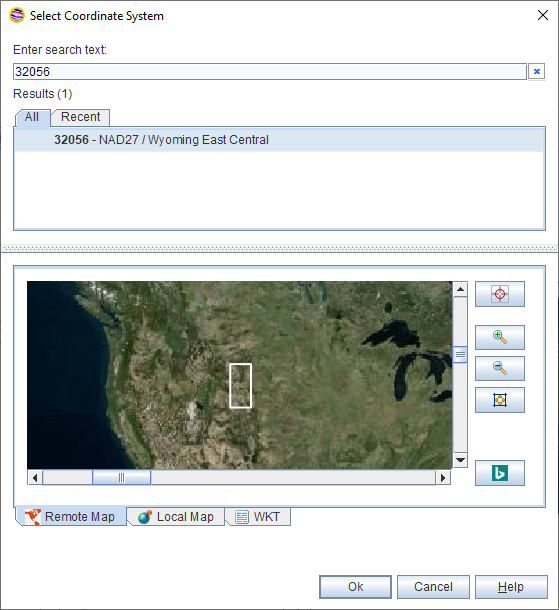
The oil and gas industry is at the origin of some of these local coordinate systems. Many of today’s new oil fields are in remote areas, initially lacking a geographical survey. There is an organization called the “OGP Surveying and Positioning Committee” which keeps track of these coordinate systems. It is colloquially known as “EPSG” for historical reasons. It regularly provides a database of these coordinate systems to all its members. This database is used by IVAAP and Apache SIS provides a simple API to take advantage of it. Each record in this database has a numerical WKID (Well Known ID). To instantiate a projection method or a coordinate system defined in this database, you just need to prefix this id with the “EPSG:” string.

OperationMethod method = getCoordinateOperationFactory().getOperationMethod("EPSG:9807"); // Transverse Mercator method

CoordinateReferenceSystem crs = CRS.forCode("EPSG:32056”);


The EPSG database itself is extensive, but it is common for INT customers to use unlisted coordinate reference systems, created for brand new oil fields. In these cases, a WKT (Well Known Text) string can be used instead. This text is a human-readable description of a projection method or coordinate system. The Apache SIS provides a clean API to parse WKTs. It also provides an API for formula-based projection methods that can’t be described by a WKT.

PROJCS["NAD27 / Wyoming East Central",
    GEOGCS["NAD27",
        DATUM["North_American_Datum_1927",
            SPHEROID["Clarke 1866",6378206.4,294.9786982139006,
                AUTHORITY["EPSG","7008"]],
            AUTHORITY["EPSG","6267"]],
        PRIMEM["Greenwich",0,
            AUTHORITY["EPSG","8901"]],
        UNIT["degree",0.0174532925199433,
            AUTHORITY["EPSG","9122"]],
        AUTHORITY["EPSG","4267"]],
    PROJECTION["Transverse_Mercator"],
    PARAMETER["latitude_of_origin",40.66666666666666],
    PARAMETER["central_meridian",-107.3333333333333],
    PARAMETER["scale_factor",0.999941177],
    PARAMETER["false_easting",500000],
    PARAMETER["false_northing",0],
    UNIT["US survey foot",0.3048006096012192,
        AUTHORITY["EPSG","9003"]],
    AXIS["X",EAST],
    AXIS["Y",NORTH],
    AUTHORITY["EPSG","32056"]]

The WKT of NAD27 / Wyoming East Central, with the WKID 32056

Why Did INT Choose Apache SIS Over Other Options?

INT had previous experience using GeoTools. Similarly to Apache SIS, GeoTools is a Java library dedicated to facilitating the implementation of geographical information systems. Being an older library, it goes much further than Apache SIS. For example, one of its components allows the parsing of shape files, something currently outside of the scope of Apache’s library. As a matter of fact, the first versions of IVAAP were using GeoTools for coordinate conversions.

One of the issues we encountered with GeoTools is that it is a library that provides only fine-grained Java conversion APIs. There are several paths to convert coordinates between two systems, and GeoTools allows the developer to choose the best method. Choosing the “best” method without human interaction is complex; it depends on the extent of the data being manipulated and the “area of use” of each coordinate reference system involved. It also depends on the availability of well-known transformation algorithms between datums. In North America, the standard for transformations between datums was formerly known as NADCON. The rest of the world uses a standard known as NTV2. Apache SIS works with both datum shift standards. It may elect to use WGS 84 as a hub when no datum shift is applicable. An algorithm to pick the best method would require a significant amount of code for INT to write and maintain. While Apache SIS allows fine-grained control over the different transformations used when converting from one coordinate reference system into another, it also provides a high-level API to perform this conversion. The picking of the best algorithm is part of the Apache SIS’ implementation. Its high-level Java API that picks a conversion algorithm matches IVAAP’s general use microservice for the same function. To pick the right algorithm, it only takes 3 parameters:

  • A definition of the “from” coordinate system
  • A definition of the “to” coordinate system
  • A description of the “extent” of the coordinates to convert
double x = …
double y = …
GeographicBoundingBox extentInLongLat = …
DirectPosition position = new DirectPosition2D(x, y);
CoordinateReferenceSystem fromCrs = CRS.forCode("EPSG:32056");
CoordinateReferenceSystem toCrs = CRS.forCode("EPSG:3737");
CoordinateReferenceSystem displayOrientedFromCrs = AbstractCRS.castOrCopy(fromCrs).forConvention(AxesConvention.DISPLAY_ORIENTED);
CoordinateReferenceSystem displayOrientedToCrs = AbstractCRS.castOrCopy(toCrs).forConvention(AxesConvention.DISPLAY_ORIENTED);
CoordinateOperation operation = CRS.findOperation(displayOrientedFromCrs, displayOrientedToCrs, extentInLongLat);
MathTransform mathTransform = operation.getMathTransform();
double[] coordinate = mathTransform.transform(position, position).getCoordinate();

Sample code to convert a single x, y position from “NAD27 / Wyoming East Central” to “NAD83 / Wyoming East Central”

We still use GeoTools for other parts, but as a general rule, the Apache SIS Java API tends to be simpler, more modern than GeoTools when it comes to manipulating coordinates and coordinate systems.

After 3 years of use, we are happy with our decision to move to Apache SIS. This library allows us to support more of our customers’ coordinate systems, with less code. We are also planning to use it to interpret the metadata of GeoTIFF files. The support has been excellent. When we needed help, the members of the Apache SIS development team were really keen to help us. This is one of the reasons why INT felt we needed to give back to the open-source community. Being a long-time member of OSDU, INT contributed to OSDU a coordinate conversion library built on top of Apache SIS. This coordinate conversion library converts GeoJSON and trajectory stations between different coordinate reference systems. Users can specify the specific transformation steps that will be used in the conversion process, either through EPSGs or WKTs. Behind the scenes, it’s the Apache SIS’ fine-grained API that is being used.


Filed Under: IVAAP Tagged With: apache, apache sis, ivaap, java, maps

Apr 08 2021

Extended Well Data: How to Use the New Well Data Structure in INTViewer 2021

LAS format is the industry-standard format to store and exchange well log curve data. Despite its simplicity and usability, it has some strong limitations: log curves must have the same Z sampling for instance.

The latest INTViewer 2021 introduces a new well data structure, the Extended Well Data (EWD). Like the existing well data based on LAS files, EWD can be displayed in the Well Log Window. They can be displayed in Map views, 3D, and seismic viewers as well (provided the trajectory is well defined). 

This new format allows more complex edition operation, heterogeneous log curves in the same well data, and a new time/depth conversion process. 

Synthesis Window

The EWD structure allows more flexibility in log and well edition. The EWD Synthesis window exhibits all logs and well metadata.

Extended Well Data Synthesis

On this window some actions are available:

  • Metadata edition
  • Add curves with formula
  • Remove curves
  • Open Well Log Window with selected curves

Curve data can be edited using the Log Curve editor.

log-curve

Z and values can be edited, samples can be added or removed, and data can be copied in an external spreadsheet, then pasted back in the editor after modification.

Contrary to standard LAS data, EWD allows log curves to have heterogeneous Z columns, and various samples count. Each log curve can then be edited individually without affecting other curves sampling.

To learn more about how to edit wells in INTViewer, check out our video tutorial:


Log Curve Formula

Like with standard LAS-based well data, curves can be added using a formula. Since log curves can have different Z units, users will be forbidden to mix time and depth curves using formulas.

Log Curve Formula

Since curves can be edited individually and have different sampling, the result curve, and all other curves used as input, will be resampled to the sampling of the first data found in the formula (in the image above GR_Time will be used).

Formula editor can be started from the main synthesis window, and also from the popup menu on the EWD node.

Time / Depth Conversion

By defining a curve as Time / Depth law (typically a curve that will have time or depth unit for data values, and opposite unit for Z values), EWD offers the ability to perform Time/Depth conversion. A simple editor to choose the data to convert and the law to use is opened when Time Depth conversion action is launched:

Time Depth Conversion


Time / Depth conversion can be performed on logs, but also on Markers. The EWD format can hold several Markers set, each having time or depth unit.

markers


Time/Depth conversion action can be found on the main EWD synthesis window, but it’s also available from the EWD contextual menu in Well Log Window.

The Time/Depth conversion process is a simple sample-by-sample linear interpolation using the Time/Depth law as reference. A more complex process, eventually with parameters, can be added with customization.

LAS Import/Export

EWD can be created from LAS files and exported to LAS files after edition. LAS data can then be imported as EWD in INTViewer 2021. Users can perform various editions, time/depth conversion, and other actions, then export the result in standard LAS to use the data outside INTViewer 2021. 

Export EWD to LAS

When exporting to LAS, the data domain must be specified (a LAS can only contain data sharing the same Z unit). Users can also choose which data to export. The following screenshot shows an EWD data and the exported LAS side by side. 

In the EWD view log curves and markers are in depth, the time depth law is displayed in green. Converted and exported data are in time.

INTViewer 2021 SS

Users have the choice with EWD to display or not in the same view time and depth data. 

Customization

The Extended Well Data GUIs can be customized to offer more specific behaviour to the standard EWD functionalities. So a specific plugin will be able to modify:

  • EWD Synthesis customization 
    • Specific header panel 
    • Custom table filters
    • Custom table control (available units, domain, validation)
  • Time/Depth conversion
    • Conversion process and parameters can be added

For more information on INTViewer, please visit int.flywheelstaging.com/products/intviewer/


Filed Under: INTViewer Tagged With: 3D, Extended Well Data, INTViewer, maps, seismic

Mar 02 2021

INT’s INTViewer 2021 Release Extends Functionality for Geoscience Data QA/QC from Anywhere

New features expand support for well data analysis, mapping, import/export georeferenced images, more flexible licensing, and more.

Houston, TX —INT is pleased to announce the newest release of INTViewer. This release includes a RemoteMap plugin, support for the import and export of GeoTIFF files, a new extended well data structure, and flexible license borrowing.


“This latest release focuses on giving INTViewer users the ability to create a new Well data model, improved mapping capabilities with new features, and the ability to borrow licenses through a new and improved UI. We believe these additions and improvements will result in significant performance gains for our clients.”

—Laurent Renard, Research and Development Manager at INT, Inc.


RELEASE HIGHLIGHTS:

  • RemoteMap Plugin — Allows users to overlay data on a background map from Google or Bing maps, set up a custom Web Map Service (WMS) server (authentication not supported), and the ability to overly multiple remote layers.
  • Import and Export GeoTIFF Files — Users can produce georeferenced images by exporting maps to a GeoTIFF image to view in any GIS software.
  • Extended Well Data (EWD) — Can be displayed in the Well Log Window, Map views, and 3D and seismic viewers. EWD offers the ability to edit your log curve data and Time/Depth conversion as well as manual editing. EWD can be created from LAS files and exported to LAS files after editing.
  • License Borrowing — Allows users to perform borrowing licenses through a new UI. This improvement will be useful when a geoscientist needs to take INTViewer on his laptop to work in the field for a limited time.

INTViewer is a software that allows geoscientists to view seismic and well data, check for errors, confirm geospatial integrity, perform light processing, and analyze their datasets. INTViewer is specifically designed to quickly access large datasets—prestack, stack, and 2D—from a laptop in the field to a desktop or remotely via the cloud. INTViewer is customizable to support proprietary and automated workflow via Python script.

Read the press release on PRWeb.

For more information about INTViewer or INT’s other products, please visit int.flywheelstaging.com. 

Interested in trying INTViewer?

Request a trial for INTViewer today


Filed Under: INTViewer, Press Release Tagged With: INTViewer, maps, press release, python

Footer

Solutions

  • Real-Time Visualization
  • Visualization Components
  • New Energy Visualization
  • OSDU Visualization
  • Machine Learning
  • Developer Tools
  • Cloud Partners
  • Customer Success Stories

Products

  • IVAAP
  • GeoToolkit
  • INTViewer
  • IVAAP Demos
  • GeoToolkit Demos

About

  • News
  • Events
  • Careers
  • Management Team

Resources

  • Blog
  • FAQ

Support

  • JIRA
  • Developer Community

Contact

INT logo
© 1989–2024 Interactive Network Technologies, Inc.
Privacy Policy
  • Careers
  • Contact Us
  • Search

COPYRIGHT © 2025 INTERACTIVE NETWORK TECHNOLOGIES, Inc