• Skip to main content
  • Skip to footer

INT

Empowering Visualization

COMMUNITY BLOG
CONTACT US SUPPORT
MENUMENU
  • Solutions
    • Overview
    • Real-Time Visualization
    • Visualization Components
    • New Energy Visualization
    • OSDU Visualization
    • Machine Learning
    • Developer Tools
    • Cloud Partners
  • Products
    • IVAAP™
          • SOLUTIONS

            Real-Time Visualization

            OSDU Visualization

            Visualization Components

            New Energy Visualization

            Upstream Data Visualization

          • SUCCESS STORIES

            WEATHERFORD
            Well delivery optimization software

            BARDASZ
            Data management, data quality monitoring

            ANPG / SATEC-MIAPIA
            Virtual data room

            MAILLANCE
            High-performance visualization of ML algorithms

            SEE ALL >

          • SUPPORT

            DEVELOPER COMMUNITY
            Join or log in to the INT Developer Community.

            GET SUPPORT
            Log a ticket for an issue or bug.

            CONTACT US

          • DEMOS

            IVAAP DEMOS
            Cloud-Based Demos

            FIRST TIME HERE?
            Register to access our
            IVAAP demos

    • GeoToolkit™
          • SUCCESS STORIES

            CAYROS
            Field development planning

            TOTALENERGIES
            High-performance large dataset reservoir rendering

            IFP ENERGIES NOUVELLES
            Seismic and structural interpretation validation

            SEE ALL >

          • SUPPORT

            DEVELOPER COMMUNITY
            Join or log in to the INT Developer Community.

            GET SUPPORT
            Log a ticket for an issue or bug.

            CONTACT US

          • DEMOS

            GEOTOOLKIT DEMOS
            Geoscience Demos

    • INTViewer™
          • SUCCESS STORIES

            STRYDE
            Fast seismic QA/QC in the field

            SILVERTHORNE SEISMIC
            Efficient 2D/3D seismic data delivery

            WIRELESS SEISMIC
            Drones, IoT, and Advanced Onsite Seismic Data Validation

            SEE ALL >

          • SUPPORT

            GET SUPPORT
            Log a ticket for an issue or bug.

            CONTACT US

          • PLUG-INS

            EXTEND INTVIEWER
            More than 65 plugins available

  • Demos
    • GeoToolkit Demos
    • IVAAP Demos
  • Success Stories
  • Resources
    • Blog
    • Developer Community
    • FAQ
    • INT Resources Library
  • About
    • Overview
    • News
    • Events
    • Careers
    • Meet Our Team
    • About INT

Microsoft

Oct 11 2022

Microsoft and INT Deploy IVAAP for OSDU Data Platform on Microsoft Energy Data Services

This post was co-authored by Kadri Umay, Principal Program Manager, Microsoft.

Energy companies are currently going through a massive transformation by moving hundreds of applications to monitor, interpret, and administer their data into the cloud. In addition, they have embarked on adopting a common data standard, the OSDU™ Data Platform, to simplify interoperability between applications to facilitate data access, exchange, and collaboration.

With Microsoft Energy Data Services, energy companies can leverage new cloud-based advanced data visualization capabilities for geoscientists provided by INT and Microsoft Energy Data Services.

Microsoft Energy Data Services is a data platform fully supported by Microsoft, that enables efficient data management, standardization, liberation, and consumption in energy exploration. The solution is a hyperscale data ecosystem that leverages the capabilities of the OSDU Data Platform and Microsoft’s secure and trustworthy cloud services with our partners’ extensive domain expertise.

INT is proud to be among the early adopters who have been involved since the preview of Microsoft Energy Data Services. INT is a very active member of the OSDU Forum that offers IVAAP™, an advanced data visualization platform that allows geoscientists to easily access, interact with, and visualize data to create dashboards within Microsoft Azure, leveraging Microsoft Energy Data Services.

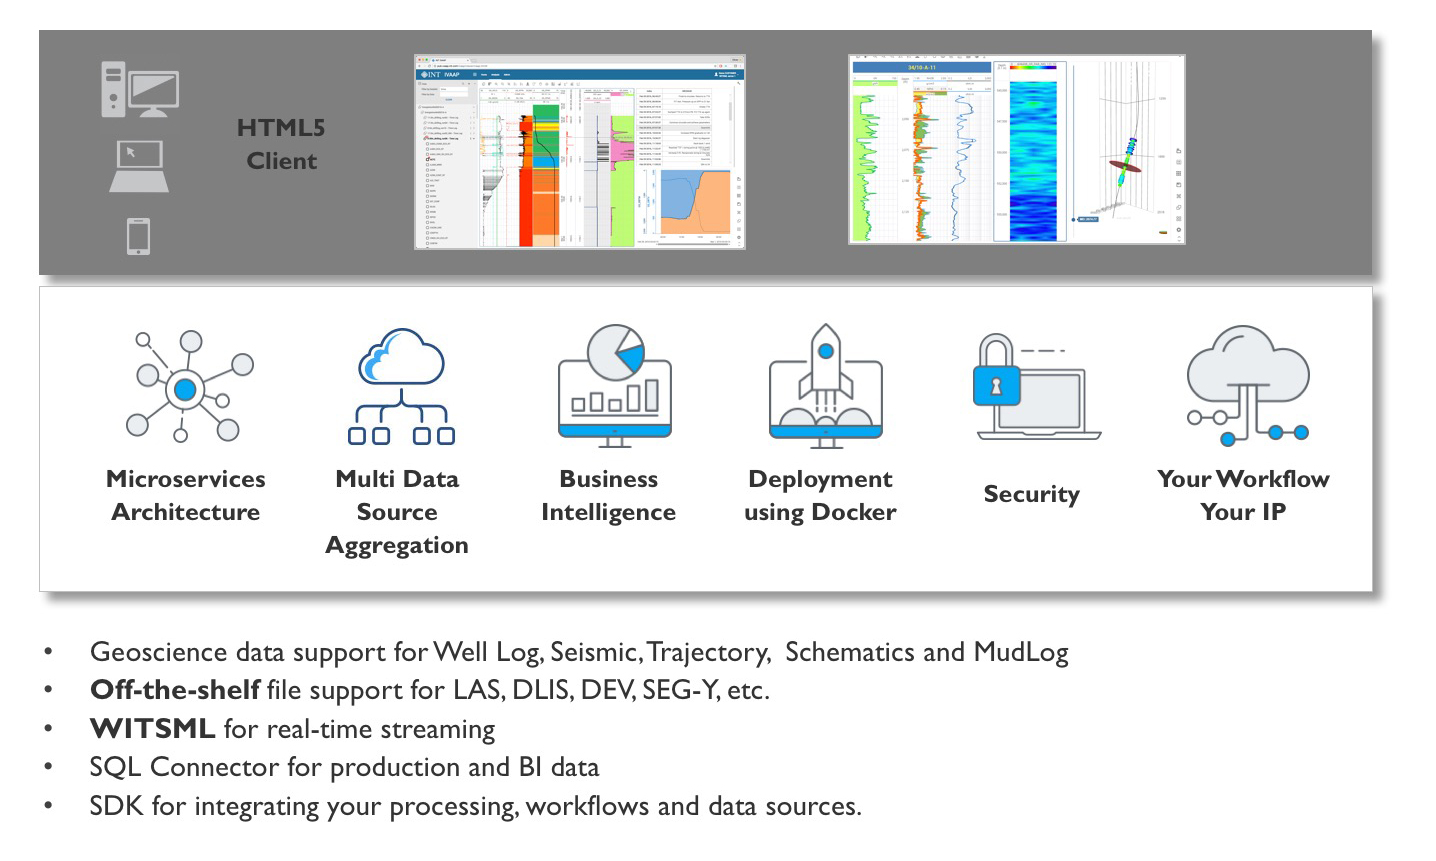
The IVAAP data visualization platform helps geoscientists and data scientists simplify their data work with the following features:

  • Access to the OSDU Data Platform is already supported (well, seismic, reservoir), and any other data sources from a single application in the cloud.
  • Full interoperability, which means data types aligned with the OSDU Data Platform can be extended to support custom formats and aggregate custom DDMS.
  • Intuitive, user-defined dashboards for engineers, geophysicists, and managers to visualize and interact with large datasets of well logs and seismic schematics, build data collections, and launch their machine learning—all from one place.
  • Many standard data connectors, powerful APIs, and SDKs that provide developers and architects ways to implement their own workflow easily.
  • Accelerated delivery of geoscience, drilling, and production cloud-enabled solutions with seamless support on Microsoft Azure.

“Providing a reliable, trusted platform as a service that accelerates the deployment of the OSDU Data Platform is key for any successful cloud transformation. Through the IVAAP platform’s integration with Microsoft Azure, customers will now have immediate access to these capabilities. This integration will simplify the access and provisioning of the massive amount of data generated by the energy industry, enabling impeccable and secure digital interactions. Our partnership with Microsoft in deploying Microsoft Energy Data Services is an important step toward our goal of providing reliable, cost-effective solutions for energy ISVs in the OSDU Data Platform.”

—Dr. Hughes Thevoux-Chabuel, VP Cloud Solutions, INT


Microsoft Energy Data Services is an enterprise-grade, fully managed OSDU Data Platform for the energy industry that is efficient, standardized, easy to deploy, and scalable for data management—ingesting, aggregating, storing, searching, and retrieving data. The offering will provide the scale, security, privacy, and compliance expected by our enterprise customers. The platform offers out-of-the-box compatibility with INT IVAAP, an advanced data visualization platform that allows geoscientists to easily access, interact with, and visualize the OSDU Data Platform to create dashboards with data contained in Microsoft Energy Data Services.

Learn more

  • Get started with Microsoft Energy Data Services today.
  • Watch the INT demo: IVAAP Data Visualization on Microsoft Azure using Microsoft Energy Data Services.

Visit us online at int.com/ivaap for a preview of IVAAP or for a demo of INT’s other data visualization products. 

For more information, please visit int.flywheelstaging.com or contact us at intinfo@int.com.


Filed Under: IVAAP Tagged With: ivaap, Microsoft, microsoft energy data services, OSDU

Mar 24 2021

INT Supports The Open Group OSDU™ Forum Mercury Release with Advanced Domain Data Visualization in the Cloud

As a long-standing OSDU Forum Member, INT has worked closely with the OSDU development teams to ensure seamless integration of IVAAP visualization of OSDU data on all major cloud providers.

Houston, TX – March 24, 2021 – INT is pleased to announce our partnership with The Open Group OSDU™ Forum as part of the new Mercury Release. INT’s flagship data visualization platform, IVAAP, offers a unique way for operators to search, explore, interact with, and automate their data on OSDU in a single platform in the cloud. 

Developed by The Open Group OSDU™ Forum, the OSDU Data Platform is an Open Source, standards-based and technology-agnostic data platform for the energy industry that stimulates innovation, industrializes data management, and reduces time to market for new solutions.

For companies adopting OSDU, IVAAP is a powerful, fast, and cost-effective alternative to custom building an application or assembling multiple components to visualize domain data. INT partners with all major cloud providers that support OSDU — AWS, Microsoft Azure, Google Cloud Platform, and RedHat OpenShift by IBM. And it includes multiple customization options, including an SDK to provide a complete, end-to-end visualization solution.


Olivier Lhemann, founder and president of INT, explains: “As more energy companies transition their data and workflows to the cloud, it’s more important than ever to have a common data standard. Our work with OSDU is critical to helping companies solve the challenge of interoperability, of viewing their data from a single application, eliminating silos and liberating workflows. IVAAP is a universal cloud viewer that significantly reduces time to market and accelerates the adoption of innovative technologies.”


To learn more about IVAAP and how it works with OSDU, visit INT.com/IVAAP.

Read the full press release on PRWeb.

About INT:

INT software empowers the energy companies to visualize their complex data (seismic, well log, reservoir, and schematics in 2D/3D). INT offers a visualization platform (IVAAP) and libraries (GeoToolkit) that developers can use with their data ecosystem to deliver subsurface solutions (Exploration, Drilling, Production). INT’s powerful HTML5/JavaScript technology can be used for data aggregation, API services, high-performance visualization of G&G and petrophysical data in a browser. INT simplifies complex subsurface data visualization.

About The Open Group

The Open Group is a global consortium that enables the achievement of business objectives through technology standards. Our diverse membership of more than 800 organizations includes customers, systems and solutions suppliers, tool vendors, integrators, academics, and consultants across multiple industries. For more information, visit www.opengroup.org.

INT, the INT logo, and IVAAP are trademarks of Interactive Network Technologies, Inc., in the United States and/or other countries.


Open Subsurface Data Universe™ and OSDU™ are trademarks of The Open Group.

Filed Under: IVAAP, Press Release Tagged With: AWS, cloud, IBM, ivaap, Microsoft, open group, OSDU

Jan 12 2021

Comparing Storage APIs from Amazon, Microsoft and Google Clouds

One of the unique capabilities of IVAAP is that it works with the cloud infrastructure of multiple vendors. Whether your SEGY file is posted on Microsoft Azure Blob Storage, Amazon S3 or Google Cloud Storage, IVAAP will be capable of visualizing it.

It’s only when administrators register new connectors that vendor-specific details need to be entered.  For all other users, the user interface will be identical regardless of the data source. The REST API consumed by IVAAP’s HTML5 client is common to all connectors as well. The key component that does the hard work of “speaking the language of each cloud vendor and hiding their details to the other components” is the IVAAP Data Backend.

While the concept of “storage in the cloud” is similar across all three vendors, they each provide a different API to achieve similar goals. In this article, we will compare how to implement 4 basic functionalities. Because the IVAAP Data Backend is written in Java, we’ll only compare Java APIs.


Checking that an Object or Blob Exists

Amazon S3

String awsAccessKey = …
String awsSecretKey = …
String region = …
String bucketName = …
String keyName = …
AwsCredentials credentials = AwsBasicCredentials.create(awsAccessKey, awsSecretKey);
S3Client s3Client = S3Client.builder().credentialsProvider(credentials).region(region).build();
try {
    HeadObjectRequest.Builder builder = HeadObjectRequest.builder().bucket(bucketName).key(keyName);
    s3Client.headObject(request);
    return true;
} catch (NoSuchKeyException e) {
    return false;
}

Microsoft Azure Blob Storage

String accountName = …
String accountKey = …
String containerName = …
String blobName = ...
StorageSharedKeyCredential credential = new StorageSharedKeyCredential(accountName, accountKey);
String endpoint = String.format(Locale.ROOT, "https://%s.blob.core.windows.net", accountName);
BlobServiceClientBuilder builder = new BlobServiceClientBuilder().endpoint(endpoint).credential(credential);
BlobServiceClient client = builder.buildClient();
BlobContainerClient containerClient = client.getBlobContainerClient(containerName);
BlobClient blobClient = containerClient.getBlobClient(blobName);
return blob.exists();

Google Cloud Storage

String authKey = …
String projectId = …
String bucketName = …
String blobName = ...
ObjectMapper mapper = new ObjectMapper();
JsonNode node = mapper.readTree(authKey);
ByteArrayInputStream in = new ByteArrayInputStream(mapper.writeValueAsBytes(node));
GoogleCredentials credentials = GoogleCredentials.fromStream(in);
Storage storage = StorageOptions.newBuilder().setCredentials(credentials)
                        .setProjectId(projectId)
                        .build()
                        .getService();
Blob blob = storage.getBlob(bucketName, blobName, BlobGetOption.fields(BlobField.ID));
return blob.exists();


Getting the Last Modification Date of an Object or Blob

Amazon S3

String awsAccessKey = …
String awsSecretKey = …
String region = …
String bucketName = …
String keyName = …
AwsCredentials credentials = AwsBasicCredentials.create(awsAccessKey, awsSecretKey);
S3Client s3Client = S3Client.builder().credentialsProvider(credentials).region(region).build();
HeadObjectRequest headObjectRequest = HeadObjectRequest.builder()
.bucket(bucketName)
.key(keyName)
.build();
HeadObjectResponse headObjectResponse = s3Client.headObject(headObjectRequest);
return headObjectResponse.lastModified();

Microsoft Azure Blob Storage

String accountName = …
String accountKey = …
String containerName = …
String blobName = …
StorageSharedKeyCredential credential = new StorageSharedKeyCredential(accountName, accountKey);
String endpoint = String.format(Locale.ROOT, "https://%s.blob.core.windows.net", accountName);
BlobServiceClientBuilder builder = new BlobServiceClientBuilder()
.endpoint(endpoint)
.credential(credential);
BlobServiceClient client = builder.buildClient();
BlobClient blob = client.getBlobClient(containerName, blobName);            BlobProperties properties = blob.getProperties();
return properties.getLastModified();

Google Cloud Storage

String authKey = …
String projectId = …
String bucketName = …
String blobName = …
ObjectMapper mapper = new ObjectMapper();
JsonNode node = mapper.readTree(authKey);
ByteArrayInputStream in = new ByteArrayInputStream(mapper.writeValueAsBytes(node));
GoogleCredentials credentials = GoogleCredentials.fromStream(in);
Storage storage = StorageOptions.newBuilder().setCredentials(credentials)
                        .setProjectId(projectId)
                        .build()
                        .getService();
Blob blob = storage.get(bucketName, blobName,  BlobGetOption.fields(Storage.BlobField.UPDATED));
return blob.getUpdateTime();


Getting an Input Stream out of an Object or Blob

Amazon S3

String awsAccessKey = …
String awsSecretKey = …
String region = …
String bucketName = …
String keyName = …
AwsCredentials credentials = AwsBasicCredentials.create(awsAccessKey, awsSecretKey);
S3Client s3Client = S3Client.builder().credentialsProvider(credentials).region(region).build();
GetObjectRequest getObjectRequest = GetObjectRequest.builder()
.bucket(bucketName)
.key(keyName)
.build();
return s3Client.getObject(getObjectRequest);

Microsoft Azure Blob Storage

String accountName = …
String accountKey = …
String containerName = …
String blobName = …
StorageSharedKeyCredential credential = new StorageSharedKeyCredential(accountName, accountKey);
String endpoint = String.format(Locale.ROOT, "https://%s.blob.core.windows.net", accountName);
BlobServiceClientBuilder builder = new BlobServiceClientBuilder()
.endpoint(endpoint)
.credential(credential);
BlobServiceClient client = builder.buildClient();
BlobClient blob = client.getBlobClient(containerName, blobName);
return blob.openInputStream();

Google Cloud Storage

String authKey = …
String projectId = …
String bucketName = …
String blobName = …
ObjectMapper mapper = new ObjectMapper();
JsonNode node = mapper.readTree(authKey);
ByteArrayInputStream in = new ByteArrayInputStream(mapper.writeValueAsBytes(node));
GoogleCredentials credentials = GoogleCredentials.fromStream(in);
Storage storage = StorageOptions.newBuilder().setCredentials(credentials)
                        .setProjectId(projectId)
                        .build()
                        .getService();
Blob blob = storage.get(bucketName, blobName,  BlobGetOption.fields(BlobField.values()));
return Channels.newInputStream(blob.reader());


Listing the Objects in a Bucket or Container While Taking into Account Folder Hierarchies

S3

String awsAccessKey = …
String awsSecretKey = …
String region = …
String bucketName = …
String parentFolderPath = ...
AwsCredentials credentials = AwsBasicCredentials.create(awsAccessKey, awsSecretKey);
S3Client s3Client = S3Client.builder().credentialsProvider(credentials).region(region).build();
ListObjectsV2Request.Builder builder = ListObjectsV2Request.builder().bucket(bucketName).delimiter("/").prefix(parentFolderPath + "/");
ListObjectsV2Request request = builder.build();
ListObjectsV2Iterable paginator = s3Client.listObjectsV2Paginator(request);
Iterator<CommonPrefix> foldersIterator = paginator.commonPrefixes().iterator();
while (foldersIterator.hasNext()) {
…
}

Microsoft

String accountName = …
String accountKey = …
String containerName = …
String parentFolderPath = ...
StorageSharedKeyCredential credential = new StorageSharedKeyCredential(accountName, accountKey);
BlobServiceClientBuilder builder = new BlobServiceClientBuilder()
.endpoint(endpoint)
.credential(credential);
BlobServiceClient client = builder.buildClient();
BlobContainerClient containerClient = client.getBlobContainerClient(containerName);
Iterable<BlobItem> iterable = containerClient.listBlobsByHierarchy(parentFolderPath + "/");
for (BlobItem currentItem : iterable) {
   …
}

Google

String authKey = …
String projectId = …
String bucketName = …
String parentFolderPath = ...
ObjectMapper mapper = new ObjectMapper();
JsonNode node = mapper.readTree(authKey);
ByteArrayInputStream in = new ByteArrayInputStream(mapper.writeValueAsBytes(node));
GoogleCredentials credentials = GoogleCredentials.fromStream(in);
Storage storage = StorageOptions.newBuilder().setCredentials(credentials)
                        .setProjectId(projectId)
                        .build()
                        .getService();
Page<Blob> blobs = cloudStorage.listBlobs(bucketName, BlobListOption.prefix(parentFolderPath + "/"), BlobListOption.currentDirectory());
for (Blob currentBlob : blobs.iterateAll()) {
 ...
}


Most developers will discover these APIs by leveraging their favorite search engine. Driven by innovation and performance, cloud APIs become obsolete quickly. Amazon was the pioneer, and much of the documentation still indexed by Google is for the v1 SDK, while the v2 has been available for more than two years, but wasn’t a complete replacement. This sometimes makes research challenging for the simplest needs. Microsoft has migrated from v8 to v12 a bit more recently and has a similar challenge to overcome. Being the most recent major player, the Google SDK is not dragged down much by obsolete articles.

The second way that developers will discover an API is by using the official documentation. I found that the Microsoft documentation is the most accessible. There is a definite feel that the Microsoft Azure documentation is treated as an important part of the product, with lots of high-quality sample code targeted at beginners.

The third way that developers discover an API is by using their IDE’s code completion. All cloud vendors make heavy use of the builder pattern. The builder pattern is a powerful way to provide options without breaking backward compatibility, but slows down the self-discovery of the API. The Amazon S3 API also stays quite close to the HTTP protocol, using terminology such as “GetRequest” and “HeadRequest”. Microsoft had a higher level API in v8 where you were manipulating blobs. The v12 iteration moved away from apparent simplicity by introducing the concept of blob clients instead. Microsoft offers a refreshing explanation of this transition. Overall, I found that the Google SDK tends to offer simpler APIs for performing simple tasks.

There are more criterias than simplicity, discoverability when comparing APIs. Versatility and performance are two of them. The Amazon S3 Java SDK is probably the most versatile because of the larger number of applications that have used its technology. It even works with S3 clones such as MinIO Object Storage (and so does IVAAP). The space where there are still a lot of changes is asynchronous APIs. Asynchronous APIs tend to offer higher scalability, faster execution, but can only be compared in specific use cases where they are actually needed. IVAAP makes heavy use of asynchronous APIs, especially to visualize seismic data. This would be the subject of another article. This is an area that evolves rapidly and would deserve a more in-depth comparison.

For more information on IVAAP, please visit int.flywheelstaging.com/products/ivaap/


Filed Under: IVAAP Tagged With: API, cloud, Google, ivaap, java, Microsoft

Sep 15 2020

Integrating Powerful Map Capabilities into Your Subsurface Web Applications

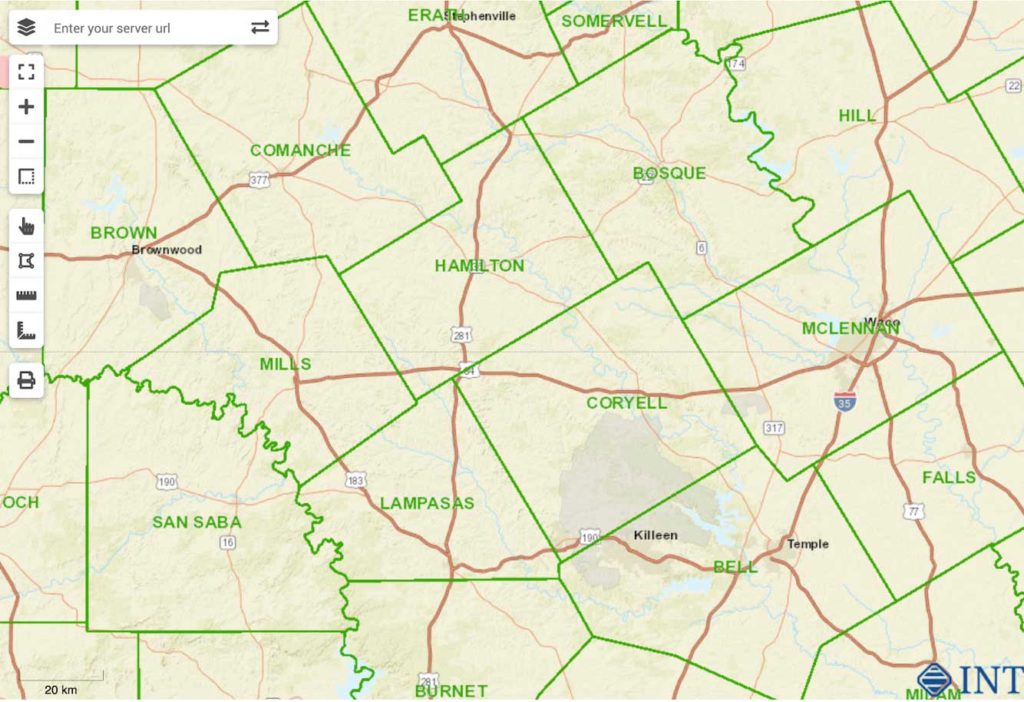
Map-based search is an integral part of subsurface data visualization. In order to meet usability expectations, developers of subsurface applications in the cloud must add powerful map and map-based search functionalities.

The GeoToolkit map widget simplifies the process, allowing users to get quick and clear insights using common web mapping services. In this blog post, we will cover how to access the map widget in GeoToolkit, how to integrate other Web Services, including ArcGIS, ESRI REST, OpenStreetMap, Google, Microsoft, etc., and more about GeoToolkit’s features, including layering, labeling, symbols, annotations, and more.

map4-web

Features

With GeoToolkit.JS, there are many general functionalities that you can use in your web application. The map, which is based on the Core toolkit, provides two different versions of libraries: it has ECMAScript 6 or if you’re going for a more classical approach, ECMAScript 5. It can be used in part with different UI frameworks like React, Angular, or VUE. Moreover, it has user-friendly functionalities like symbol aggregation, label collision, export to PDF, and imaging formats.

There are also different functionalities that can be available such as axes, titles, and scrollbars. The predefined interaction tools allow you to display crosshair, panning tools, zoom to measure distance, tooltip, rubberband, and more. GeoToolkit.JS map supports a wide range of map formats and services like ArcGIS, GeoJSON, KML, Mapbox, Bing, and so on. It is also compatible with other GeoToolkitJS elements like charts, shapes, and widgets.

Getting Started

import {Map} from '@int/geotoolkit/map/Map';
import {Plot} from '@int/geotoolkit/plot/Plot';
import {Tile} from '@int/geotoolkit/map/layers/Tile';
const map = new Map();
map.addLayer(new Tile({
 'name': 'OpenStreetMap',
 'url': https://demo.int.com/osm_tiles/{z}/{x}/{y}.png
}))
const plot = new Plot({
  'canvaselement': canvas,
  'root': map
});


map3-web


  1. Create a map widget.
  2. Connect DOM canvas with the widget by creating a Plot done like other widgets.
  3. Add a layer (or layers) of interest to the widget.

Web Services: ESRI REST, OpenStreetMap, Google, Microsoft

It is important to consider which types of services can be supported since all of your data is received from different types of servers. Some services hosted include: ESRI Rest, ArcGIS, OpenStreetMap, Google Map, Microsoft, etc.

The ArcGIS Web Map protocol which is used by ArcGIS online is an easy and convenient way to build your map application. You can go to ArcGIS online, create your content, put necessary layers, combine them together, provide the link to our map widget and it will automatically be recognized. Most layers are supported. Image services (ArcGIS Image Service Layer, Image Services Vector Layers, and WMS) and Tile services (Image Service, ArcGIS Tiled Map Service Layer, Web Tiled Layer, OpenStreetMap) are supported. Feature Services include map service (ArcGIS Feature Layer), KML, WFS, and CSV. We also provide some real-time services support like stream services (ArcGIS Stream Layer), GeoRSS, Vector Tiles (VectorTileLayer), and Bing Maps services. Two extra formats that are supported are GeoJSON and GPX.

Map Services

Services cannot be used without visualization. Our part in maps products is to provide visualization for these services. To start visualization, you need to create your map widget and specify different properties. One example of a system is CRS, which is a common coordinate system of displayed data. You can specify map limits if you want to limit the visualization area of interest. You can also set different adornments to your maps like map scale. Zoom settings include min/max with a range of scales available and time/speed to customize the map management to your convenience.

Map Layers

There are four main types of layers supported:

  • Image type that displays a single image received from a server. For example, WMS for Web Maps Services and ArcGISImage supports ArcGIS MapServer and ImageServer services.
  • With Tile layers, the data consists of several images (tiles) painted next to each other and thus forming a complete picture. Tile can be used as a universal layer for any tile service. Bing can be used for all Microsoft Bing Services.
  • Vector layers draw not pictures but vector data (called “features”): points, polygons, and polylines, which depict cities, rivers, islands, and more. Support of different formats includes: GeoJSON, KML, CSV, GeoRSS, Lerc translate their format into the map objects, the ArcGISFeature supports ARCGIS FeatureServer services., WFS for Web Feature Services, and VectorTile.
  • Shape layer is used for compatibility with other GeoToolkitJS elements to display on the map charts, contours, and other complex shapes (or just trivial ones).

Layer Settings

General setting for layers include url to the server or file, data coordinate system (epsg codes are supported), alpha as the value of the layer transparency, layerfilter for setting visibility conditions, tooltip.visible to enable tooltip support by the layer, and tooltip.formatter to generate information (in HTML format) of the tooltip content (can be used in both the basic GeoToolkitJS formatters or a custom one).


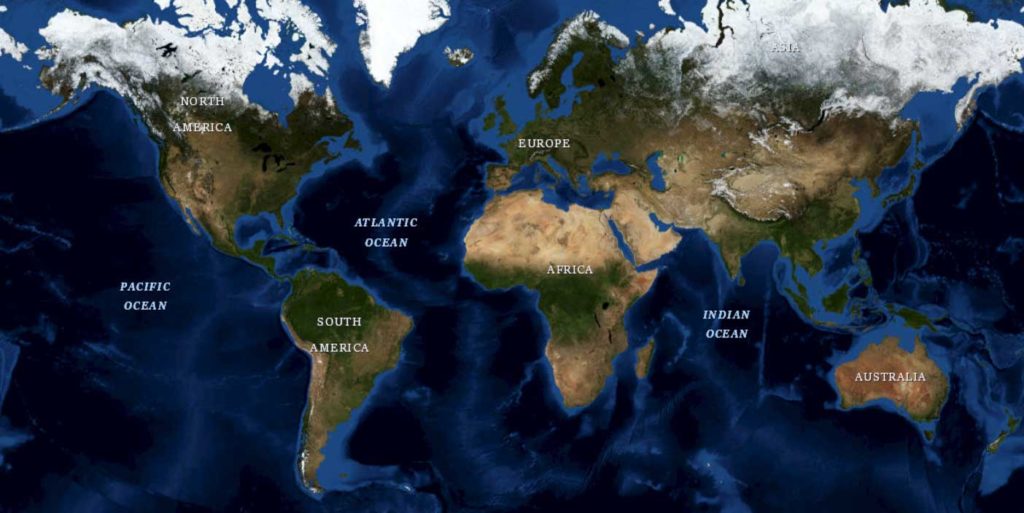
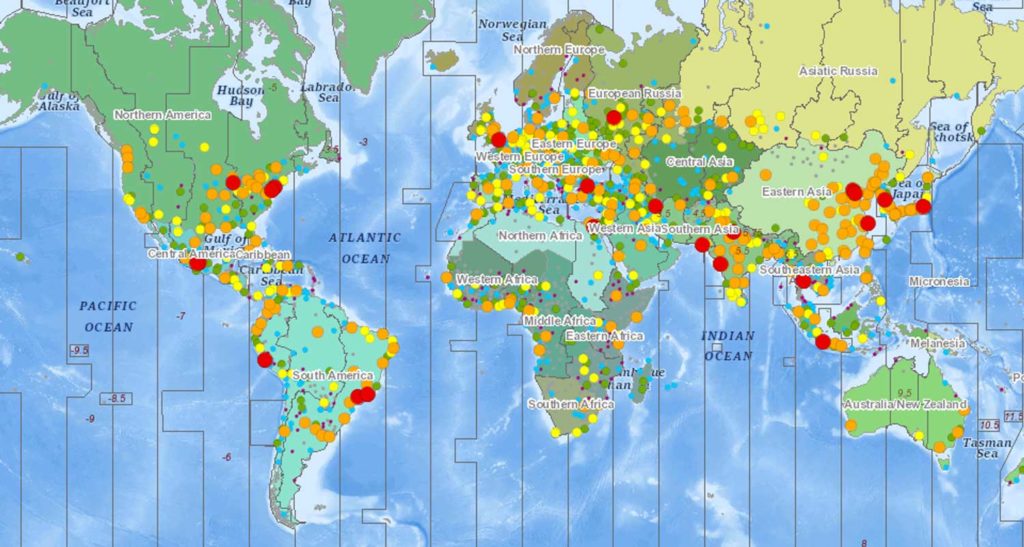
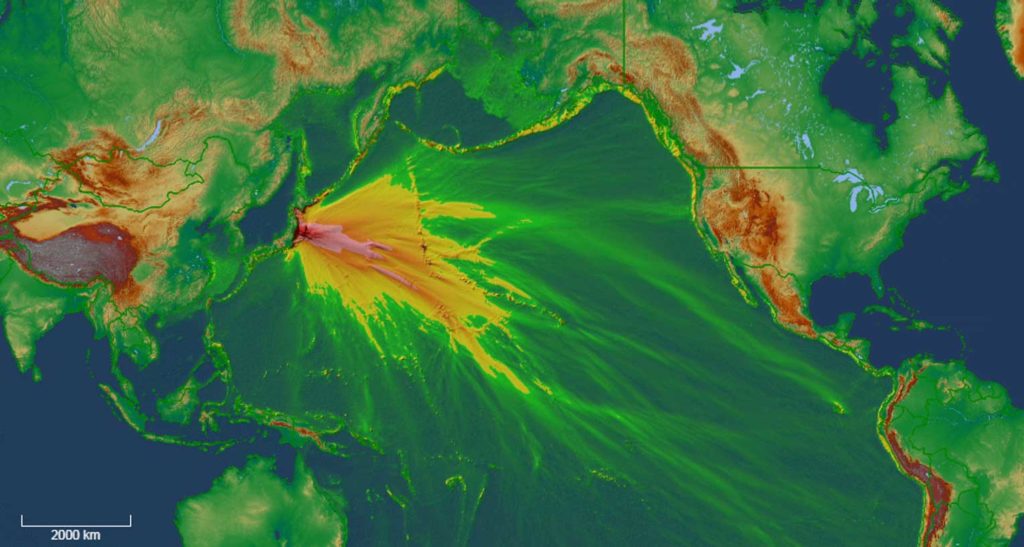
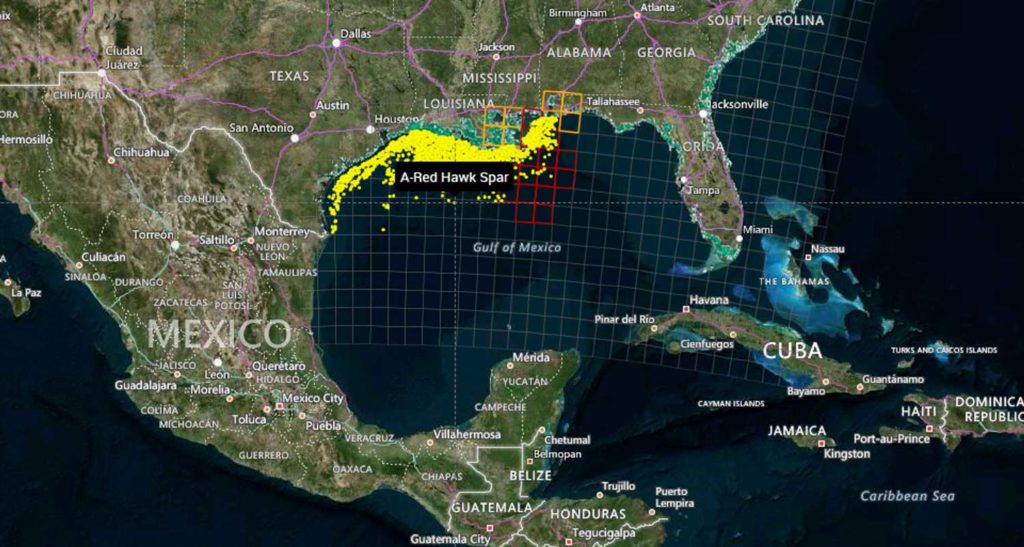
Examples of different layers:

map2-web

tsunami-web

map-web

Geo-Reference Images

Geotoolkit provides powerful options like fast WebGL implementation and ImageTransform to help speed up the process to transform any image in your application.

Feature Annotations

In map displays, you can have a lot of different annotations and some of them can potentially overlap. To help filter out the overlapped annotations, you want to use some collision detection to remove unnecessary labels. We provide all of these functionalities which can be configured. The steps to display labels are:

  1. Use annotations.visible layer property to include annotations (hidden by default)
  2. To select annotation info, change the annotation.strategy parameter to the AnnotationByAttribute or AnnotationByRule instance with the attribute name or \expression to display.
  3. Set the text shape for the template to customize annotations drawing styles and textSizeInfo option to dynamically resize annotations.
  4. Annotation filters prevent some information from being written in order to save space, time, etc.

Robust Map Features for Your Subsurface Application

Overall, GeoToolkit’s map widget allows you to integrate many robust map features into your subsurface or exploration applications. We hope this helps you simplify the process, meet usability expectations, and get the insights you need.

For more information on GeoToolkit’s maps widget and its features, please visit our GeoToolkit page.

Want to know more? Check out our webinar: Integrating Powerful Map Capabilities into Your Subsurface Web Applications.


Filed Under: GeoToolkit, HTML5, JavaScript Tagged With: arcgis, Bing, CRS, ESRI, GeoJSON, Google, KML, map, Mapbox, Microsoft, OpenStreetMap, WMS

Nov 01 2017

Bridging the Gap Between Business and IT: Visualization Architecture in the Digital Oilfield

A Closer Look at IVAAP

Thierry Danard, VP of Core Platform Technologies

In our latest Tech Talk, E&P Visualization in the Cloud, we featured IVAAP, our cloud-enabled visualization and analytics development platform. We showed how it can be used to monitor and analyze well data as a critical part of your digital transformation.

Thierry Danard, our VP of Core Platform Technologies, presented some of the technical aspects of IVAAP, so we asked him a few questions after the talk to dig a bit deeper:

> Hi, Thierry! We already know that you are the brains behind INTViewer, so which part of IVAAP are you responsible for?

I mostly work on the “P” part of IVAAP, the “platform.” IVAAP can be customized fully, both on the browser side and on the backend side. I focus on the backend side, meaning the microservices on the data side.

> What makes the IVAAP platform unique?

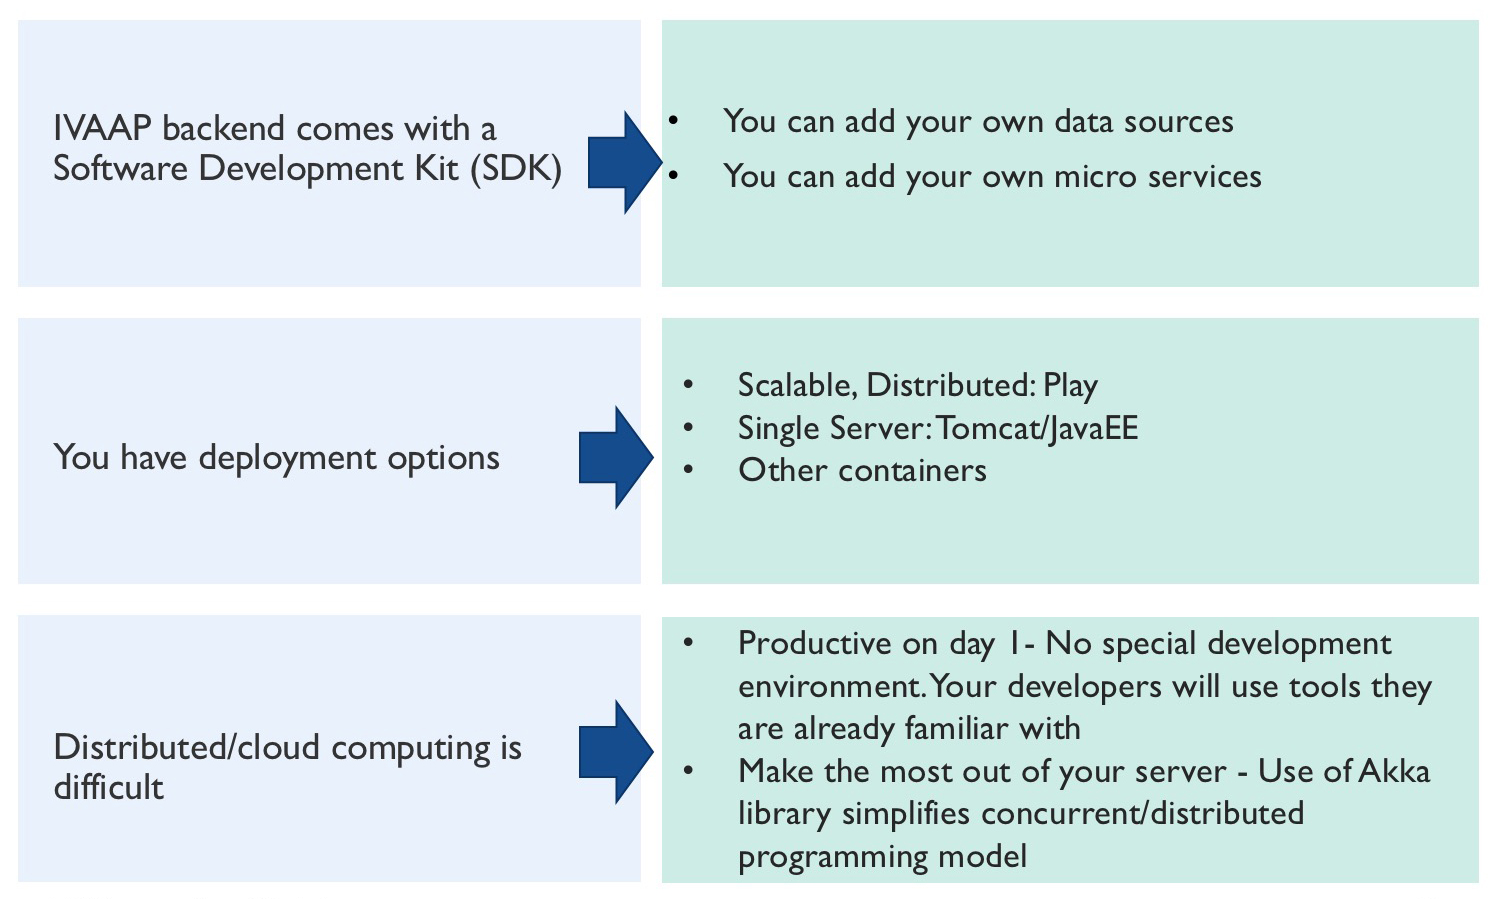
IVAAP comes with a Software Development Kit (SDK) so geoscience developers can tailor our solution to their needs. Developing solutions for the cloud is hard. We want to facilitate the work of these developers. The SDK is designed to ease the challenges developers face when developing distributed solutions.

But developers are not the only customers of IVAAP within IT. Deploying cloud solutions is also hard, and infrastructure folks want options when it comes to deployment. We made the IVAAP platform container-agnostic so that it can be deployed in a highly distributed environment or using standalone servers without changes: This is the same microservice code running.

IVAAP is unique because it bridges the gap between the business and IT: It provides a common platform that both sides can embrace, not just end-users.


SDK-architecture-ivaap
SDK Architecture


> Can you give us examples of containers that IVAAP works on?

The most widely used container for the IVAAP backend is Play. This is a high-velocity web framework designed to run on multiple machines, in a distributed fashion.

Another one is Apache Tomcat, the most widely used standalone Java application server. Other well-known JavaEE application servers are Oracle Glassfish and WebLogic.

> Why might a developer choose Tomcat over Play?

Not every customer has a network of machines to dedicate to well monitoring or analysis. Depending on what you use IVAAP for, you might not need distributed processing.

But developers also benefit. Developers can use the Integrated Development Environment (IDE) that they already use; it already works with Tomcat. No need to use a special environment, no need to install special plugins or to configure several servers. Developers can be productive from day one. The promise of IVAAP is to accelerate the delivery of geoscience, drilling and production cloud-enabled solutions. You can’t accelerate these deliveries unless your developers are productive.

The IVAAP Approach


> How does the SDK help developers create distributed microservices?

The IVAAP backend API makes a large use of the Akka library. Akka is a toolkit for building highly concurrent, distributed applications. The core Java programming model makes it very difficult for cloud developers to implement distributed processing. The Akka library addresses this concern with its simple model based on actors and messages.

Akka and Play are designed to work together. When Akka code is deployed in Play, you can sustain heavy loads. For example, the Akka actor system might decide to delegate individual processing units to one or several machines. This is virtually transparent to the developer as this is a behavior that depends on the state of each server.

> How does the SDK help developers create efficient microservices?

The API of the SDK is designed from the ground up to favor asynchronous execution over synchronous execution.

Synchronous code tends to reserve lots of resources just to wait for an answer. Asynchronous code doesn’t reserve these resources while a long processing task is being performed. Less CPU and less memory usage means more processing power for each deployed server, allowing your solution to perform under heavy loads.

> What’s coming next for the IVAAP backend?

Now that we made it easy to add new data sources and new microservices, we are adding connectivity to even more data repositories, such as OSISoft PI, Procount, or Peloton. This is a typical use case of the backend API. We have cleanly separated the microservices and data access parts. Now it’s just a matter of plugging additional data sources.


Stay tuned for more interviews with our developers! In the meantime, click here to learn more about IVAAP.


Filed Under: Uncategorized Tagged With: Azure, ivaap, Microsoft

  • Page 1
  • Page 2
  • Go to Next Page »

Footer

Solutions

  • Real-Time Visualization
  • Visualization Components
  • New Energy Visualization
  • OSDU Visualization
  • Machine Learning
  • Developer Tools
  • Cloud Partners
  • Customer Success Stories

Products

  • IVAAP
  • GeoToolkit
  • INTViewer
  • IVAAP Demos
  • GeoToolkit Demos

About

  • News
  • Events
  • Careers
  • Management Team

Resources

  • Blog
  • FAQ

Support

  • JIRA
  • Developer Community

Contact

INT logo
© 1989–2024 Interactive Network Technologies, Inc.
Privacy Policy
  • Careers
  • Contact Us
  • Search

COPYRIGHT © 2025 INTERACTIVE NETWORK TECHNOLOGIES, Inc