• Skip to main content
  • Skip to footer

INT

Empowering Visualization

COMMUNITY BLOG
CONTACT US SUPPORT
MENUMENU
  • Solutions
    • Overview
    • Real-Time Visualization
    • Visualization Components
    • New Energy Visualization
    • OSDU Visualization
    • Machine Learning
    • Developer Tools
    • Cloud Partners
  • Products
    • IVAAP™
          • SOLUTIONS

            Real-Time Visualization

            OSDU Visualization

            Visualization Components

            New Energy Visualization

            Upstream Data Visualization

          • SUCCESS STORIES

            WEATHERFORD
            Well delivery optimization software

            BARDASZ
            Data management, data quality monitoring

            ANPG / SATEC-MIAPIA
            Virtual data room

            MAILLANCE
            High-performance visualization of ML algorithms

            SEE ALL >

          • SUPPORT

            DEVELOPER COMMUNITY
            Join or log in to the INT Developer Community.

            GET SUPPORT
            Log a ticket for an issue or bug.

            CONTACT US

          • DEMOS

            IVAAP DEMOS
            Cloud-Based Demos

            FIRST TIME HERE?
            Register to access our
            IVAAP demos

    • GeoToolkit™
          • SUCCESS STORIES

            CAYROS
            Field development planning

            TOTALENERGIES
            High-performance large dataset reservoir rendering

            IFP ENERGIES NOUVELLES
            Seismic and structural interpretation validation

            SEE ALL >

          • SUPPORT

            DEVELOPER COMMUNITY
            Join or log in to the INT Developer Community.

            GET SUPPORT
            Log a ticket for an issue or bug.

            CONTACT US

          • DEMOS

            GEOTOOLKIT DEMOS
            Geoscience Demos

    • INTViewer™
          • SUCCESS STORIES

            STRYDE
            Fast seismic QA/QC in the field

            SILVERTHORNE SEISMIC
            Efficient 2D/3D seismic data delivery

            WIRELESS SEISMIC
            Drones, IoT, and Advanced Onsite Seismic Data Validation

            SEE ALL >

          • SUPPORT

            GET SUPPORT
            Log a ticket for an issue or bug.

            CONTACT US

          • PLUG-INS

            EXTEND INTVIEWER
            More than 65 plugins available

  • Demos
    • GeoToolkit Demos
    • IVAAP Demos
  • Success Stories
  • Resources
    • Blog
    • Developer Community
    • FAQ
    • INT Resources Library
  • About
    • Overview
    • News
    • Events
    • Careers
    • Meet Our Team
    • About INT

plugins

Mar 09 2021

How to Use INTViewer 2021’s New Mapping Capabilities

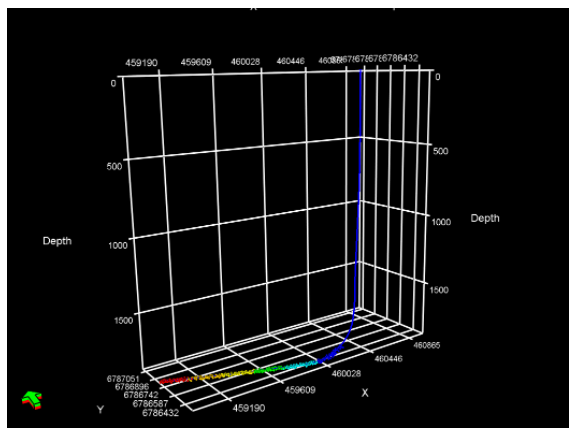
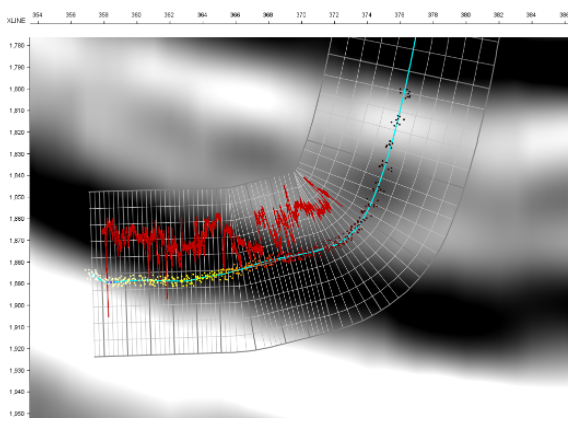
INTViewer is a platform that allows geoscientists to view seismic data, check for errors, confirm geospatial integrity, perform light processing, and analyze their dataset. INTViewer is specifically designed to enable users to quickly access large datasets—prestack, stack, and 2D— from a laptop in the field to a desktop or remotely via the cloud.

The upcoming release of INTViewer 2021 has new map features including a RemoteMap plugin and support for the import and export of GeoTIFF files.

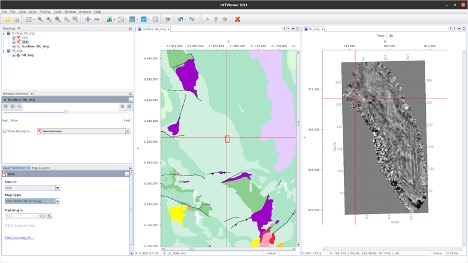
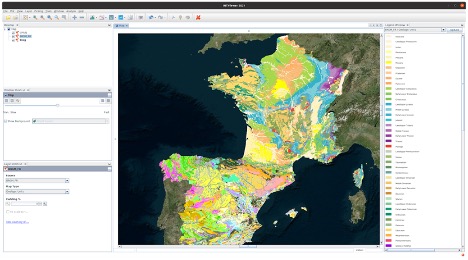
Users can populate map views with more GIS data(1). The possibility to aggregate several GIS data sources allows users to get a clear understanding of their field.

INTViewer Timeslice
Time slice exported from INTViewer and rendered on top of a satellite view in QGIS.


In the previous version of the RemoteMap plugin, users could use a Web Map Tile Service like Google or Bing to visualize in the background. In the 2021 update, we have added the possibility to set up a custom WMS server. Users can now register their preferred WMS servers in the settings panel and access them in any map view, making it easy to correlate geographic information with their data.

INTViewer Teapot Field
Teapot field, showing study bounds, lithology and faults from USGIN Geology


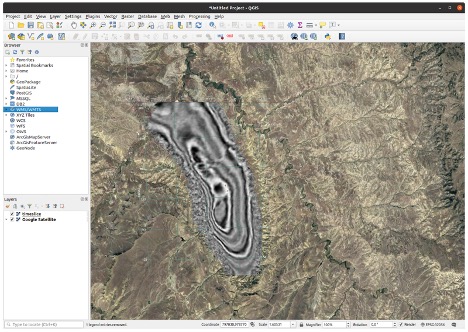
Using INTViewer, users can also produce georeferenced images by exporting maps to a GeoTIFF image to view in their favorite GIS software.

INTViewer map

With these new and improved features, users will be able to get a better understanding of their field, easily and efficiently correlate geographic data, and import and export GeoTIFF files.


For more information on INTViewer, please visit int.flywheelstaging.com/products/intviewer/


1 These features are available via the RemoteMap and GisRaster plugins, available on the update center.


Filed Under: INTViewer Tagged With: geotiff, gis, INTViewer, mapping, plugins, remotemap

Jul 12 2018

Installing the Seismic Unix Library on Windows [Walkthrough]

*This post has been recently updated to reflect 2022 updates.

In our previous blog, Simplifying the Learning Curve of the Seismic Unix Library, we described how INTViewer can leverage the SU library. This library is typically meant for Linux, but it can also be used on Windows. This walkthrough describes how to install the SU Library on Windows 10 to use the Seismic Workbench plugin.

The installation of the Seismic Unix Library includes 3 steps:

  • Download the SU Library code and Cygwin
  • Install and configure Cygwin
  • Compile the SU Library code

For this walkthrough, we use SU Library 44R23 and Cygwin 2.881.

Downloading the SU Library Code

The SU Library code can be downloaded here: https://wiki.seismic-unix.org/doku.php

Extract the contents of the downloaded .tgz file to C:\apps\cwp_su_all_44R23

Downloading Cygwin

Cygwin can be downloaded here: https://cygwin.com/install.html

Choose the 32 bit version of Cygwin (not 64).

Installing and Configuring Cygwin

To install Cygwin, execute its installer (setup-x86.exe). This will install the Cygwin program, which when run, creates a POSIX shell window similar-looking to the Windows command window but which behaves in a more Unix-like way.

You will need to install several additional Cygwin components before your workflows can run. To get these, run the installer program (called Setup and represented by an icon with a black “C” shape enclosing a green arrow). Click Next →.

Click Next →.

su3

Choose an installation directory and click Next →. This tutorial assumes that the default location is not used.  Instead of “C:\cygwin64” use “C:\cygwin”. Installing Cygwin in the root of a drive in a folder named “cygwin” is good practice since it will be detected automatically by INTViewer in this configuration.

seismic unix library installation - INTViewer

Choose a directory where Setup will store installation files. This directory can be reused for future installs so that the download doesn’t have to be repeated. Click Next →.

On this screen, you can choose your connection options. Click Next →.

Select a download site, preferably the one closest to you. Click Next →.

seismic unix library installation - INTViewer

Now we need to select all of the packages required for compiling Seismic Unix. The Search field is a handy way to quickly find the packages. Just enter text to search, but do NOT press Enter, as this will cause the installer to move to the next page.

First, select gcc-core. To select a package, use the drop-down menu to select the version shown…

Next, select gcc-g++.

Next, select make.

7

Next, select libgcc1.

Next, select libgd-devel.

Next, select both libQtOpenGL4 packages.

10

Next, select libtiff-devel.

Next, select libXaw-devel.

Next, select rpcbind.

Next, select libnetpbm-devel.

Next, select tiff-opengl.

Finally, select libX11-devel. Click Next →.

The following screen will display any dependencies required for the selected packages. Click Next →. Cygwin will proceed to download and install all of the selected packages and required dependencies.

seismic unix library installation - INTViewer

Create an icon on the desktop or start menu if desired. Click Next →.

Copy .bash_profile and .bashrc from C:\cygwin\etc\defaults\etc\skel and place them in your standard Windows user directory. (C:\Users\Josh for me)


Add the following lines to the end of each file:

# Setup for SU
export CWPROOT=/cygdrive/c/apps/cwp_SU_all_44R23
# Setup PATH to include SU
export PATH=$CWPROOT/bin:$PATH


Compiling the SU Library Code

Now that Cygwin is set up, we need to compile the Seismic Unix code. First, copy the file Makefile.config_Cygwin_32 located at C:\apps\cwp_su_all_44R23\src\configs to C:\apps\cwp_su_all_44R23\src\.

Replace Makefile.config located at C:\apps\cwp_su_all_44R23\src with the copied file.

Run Cygwin, and navigate to /cygdrive/c/apps/cwp_su_all_44R23/src. Once here, enter the make install command. This will compile the standard Seismic Unix code.

After the previous make file is finished, enter the make xtinstall command. This will compile the X-toolkit code.

Cygwin and the SU Library are now ready to use!

Testing the Installation

As a quick test, open the Cygwin command line, and enter the following command line, and enter the following command, modifying the paths to match your directory structure. A copy of the SEG-Y file should have been created if the installation was successful.

segyread tape=/cygdrive/d/data/Segy/Tony/stack-tony.sgy | segywrite tape=/cygdrive/d/data/Segy/Tony/stack-tony-out.sgy

For more information about INTViewer, visit the INTViewer product page, or contact us for a free trial.


Filed Under: INTViewer Tagged With: INTViewer, plugins, seismic unix, SU library

Aug 01 2017

3 NetBeans Shortcuts to Help You Be More Productive

I have been using NetBeans daily for about 8 years, so I’d say I am pretty familiar … with the features I use all the time. Over the years, friends and colleagues have shown me that there are faster ways to get the job done. I have gathered in this post three shortcuts that I learned from others and that you can also use when you develop an INTViewer plugin.

#1 Finding a class file in the Project Tree

A software like INTViewer has thousands of source files, spread over dozens of plugins. As I am in the process of editing one file, I often find myself needing to find out which other files are related: I need contextual information about the file I am changing or I need to commit all changes to that module at once.

The project view before Shift+Ctrl+1 is pressed.


The shortcut to do this is to type Shift+Ctrl+1 on your keyboard.

The project view after Shift+Ctrl+1 is pressed.


This shortcut opens both the package where the file resides and the module that contains that file.

#2 Closing all other files

The process of writing software is not a continuous flow. I work on several aspects of the software at the time, with lots of interruptions. Sooner or later, I have several dozens of unrelated files open. When I need to work on a tricky part of the code, the first task is to clear the clutter.

The NetBeans makes it easy: the “close button” of each NetBeans window has a handy tooltip that informs you of available shortcuts.

The NetBeans tooltip for the window close button.


By pressing the Alt key as I am clicking this close button, I isolate the associated file, closing all other files that are open. I do this for each group of windows, and in 2 or 3 clicks, I reduced my clutter to the 2 or 3 files that matter.

Interestingly, because INTViewer is based on the NetBeans platform, INTViewer users also benefit from the same feature. If I have several INTViewer windows open, I can click on the one window I want to keep, automatically closing all others in the same tab group.

The INTViewer tooltip for the window close button.


#3 Loading already-configured projects

INTViewer itself is made of more than 80 plugins, but there are at least 50% more that are not part of the standard distribution. They are proprietary customer plugins, community plugins that we share with all our users, prototype plugins that we are working on. I sometimes need to run these plugins on top of the “bleeding edge” version of INTViewer’s code, sometimes on specific distributions that customers already use, sometimes on top of other plugins. The project configuration possibilities are endless, but I tend to use about 10 of these different configurations all the time.

NetBeans has a feature called Project Groups to facilitate switching between project configurations. To save your current project configuration, go to File→Project Groups. You will see a dialog with a button New Group that leads to the screen below:

This dialog proposes several options on how to create your project group. I typically use the Free Group option and press the Create Group button.

To load a project group already created, go to File→Project Groups, pick the project group that you need to work on, and choose Select Group

Your project tree will load exactly as you left it when you saved it as project group.


Filed Under: INTViewer Tagged With: INTViewer, NetBeans, plugins

Jun 21 2017

Visualize Microseismic Events with INTViewer Plugins [Walkthrough]

INTViewer is well-known for its seismic analysis capabilities. Among the less well-known plugins, there is a set that always impresses during demos: the microseismic plugins, a set of four plugins that allows INTViewer users to visualize microseismic events.

To download these free plugins from INTViewer, open Tools→Download Plugins and click the Download Plugin link. A wizard will open. Follow this wizard to perform the installation.

INTViewer’s Plugin Store, directly accessible from inside the application.


This installation adds a menu item to the File menu. Select File→Open in 3D→Microseismic, then select a dataset. INTViewer supports microseismic files in .CSV (comma-separated values) format. A microseismic dataset is essentially a set of X and Y points, and each point has a timestamp and attribute values. If your dataset is not stored in the .CSV format, it would be easy to plug your own with the INTViewer public API.

There are several ways that microseismic events can be represented in a .CSV file, and a mapping needs to be specified to let INTViewer know how to read this file. There is an Auto Detect button that facilitates that process.


INTViewer is able to detect complex data formats, even with the date and time stored in the same column. In this example above, the timestamp section specifies that both date and time are stored in column 1.

The 3D visualization will load after you press the OK button.

Basic visualization of microseismic events in 3D


The visualization of microseismic events can have up to 7 dimensions. The first 3 dimensions are X, Y and Z. A 4th dimension is color. In the example above, points are colored by amplitude values. You can visualize a 5th dimension by selecting an attribute to control the size.

Visualization with variable size symbols


You can visualize a 6th dimension by selecting an attribute to control the transparency.

Visualization with transparency


The last dimension are the symbols themselves. Just like we use color maps to color points, we can use symbol maps to symbolize points.

Visualization with a symbol map


Because events are indexed by time, INTViewer makes it easy to reveal the sequence of events for a microseismic dataset. Open Window→Playback

The Playback window


The Playback window shows an histogram of events, ordered by timestamp. The longer the bar, the higher the number of events for that timestamp. By pressing the Play buttons, you start the animation of all your microseismic displays.

Interaction between the Playback window and the 3D visualization


The playback window is not the only histogram you can visualize. The distribution of any attribute is accessible.

Histogram of the CHI attribute


Cross-plotting is also possible. Select two attributes of a microseismic dataset for the X and Y axis, then one for the color.

Cross-Plot between the LTA and CHI attributes, colored by depth


The map window has capabilities similar to the 3D window. The color and symbol of points can be controlled by the values of any two attributes.

Example of map visualization


The map window is a powerful tool, featuring on-the-fly conversions between coordinate reference systems. If you specified a CRS during the mapping step, you can reproject your data to any other CRS.

All windows can visualize multiple datasets at once. In the example below, we combined a well and microseismic events.

Combining a well trajectory and a microseismic in 3D


The XSection window visualization is particularly interesting. It allows you to combine a seismic dataset, a well trajectory, and microseismic events.

Combining a seismic, a well trajectory and a microseismic in a XSection window
The Gamma-Ray (GR) well curve is shown in red


The last feature of this walkthrough is INTViewer’s Python scripting. Just like any other data type, you automate the visualization of microseismic events with a few lines of Python. INTViewer has the option to act as a Python server that an external system can easily control. Events can be added programmatically to microseismic datasets. New points are visualized immediately, making INTViewer an option to visualize real-time microseismic data.

We’ve published a few tutorials showcasing how Python can be used to work with microseismic data:

Generating synthetic microseismic data
Creating a sub-selection of a microseismic dataset using a cross-plot trend shape

Ready to learn more? Contact us for a live demo of the microseismic plugins!


Filed Under: INTViewer Tagged With: histogram, microseismic, plugins, python

Footer

Solutions

  • Real-Time Visualization
  • Visualization Components
  • New Energy Visualization
  • OSDU Visualization
  • Machine Learning
  • Developer Tools
  • Cloud Partners
  • Customer Success Stories

Products

  • IVAAP
  • GeoToolkit
  • INTViewer
  • IVAAP Demos
  • GeoToolkit Demos

About

  • News
  • Events
  • Careers
  • Management Team

Resources

  • Blog
  • FAQ

Support

  • JIRA
  • Developer Community

Contact

INT logo
© 1989–2024 Interactive Network Technologies, Inc.
Privacy Policy
  • Careers
  • Contact Us
  • Search

COPYRIGHT © 2025 INTERACTIVE NETWORK TECHNOLOGIES, Inc