• Skip to main content
  • Skip to footer

INT

Empowering Visualization

COMMUNITY BLOG
CONTACT US SUPPORT
MENUMENU
  • Solutions
    • Overview
    • Real-Time Visualization
    • Visualization Components
    • New Energy Visualization
    • OSDU Visualization
    • Machine Learning
    • Developer Tools
    • Cloud Partners
  • Products
    • IVAAP™
          • SOLUTIONS

            Real-Time Visualization

            OSDU Visualization

            Visualization Components

            New Energy Visualization

            Upstream Data Visualization

          • SUCCESS STORIES

            WEATHERFORD
            Well delivery optimization software

            BARDASZ
            Data management, data quality monitoring

            ANPG / SATEC-MIAPIA
            Virtual data room

            MAILLANCE
            High-performance visualization of ML algorithms

            SEE ALL >

          • SUPPORT

            DEVELOPER COMMUNITY
            Join or log in to the INT Developer Community.

            GET SUPPORT
            Log a ticket for an issue or bug.

            CONTACT US

          • DEMOS

            IVAAP DEMOS
            Cloud-Based Demos

            FIRST TIME HERE?
            Register to access our
            IVAAP demos

    • GeoToolkit™
          • SUCCESS STORIES

            CAYROS
            Field development planning

            TOTALENERGIES
            High-performance large dataset reservoir rendering

            IFP ENERGIES NOUVELLES
            Seismic and structural interpretation validation

            SEE ALL >

          • SUPPORT

            DEVELOPER COMMUNITY
            Join or log in to the INT Developer Community.

            GET SUPPORT
            Log a ticket for an issue or bug.

            CONTACT US

          • DEMOS

            GEOTOOLKIT DEMOS
            Geoscience Demos

    • INTViewer™
          • SUCCESS STORIES

            STRYDE
            Fast seismic QA/QC in the field

            SILVERTHORNE SEISMIC
            Efficient 2D/3D seismic data delivery

            WIRELESS SEISMIC
            Drones, IoT, and Advanced Onsite Seismic Data Validation

            SEE ALL >

          • SUPPORT

            GET SUPPORT
            Log a ticket for an issue or bug.

            CONTACT US

          • PLUG-INS

            EXTEND INTVIEWER
            More than 65 plugins available

  • Demos
    • GeoToolkit Demos
    • IVAAP Demos
  • Success Stories
  • Resources
    • Blog
    • Developer Community
    • FAQ
    • INT Resources Library
  • About
    • Overview
    • News
    • Events
    • Careers
    • Meet Our Team
    • About INT

python

Mar 02 2021

INT’s INTViewer 2021 Release Extends Functionality for Geoscience Data QA/QC from Anywhere

New features expand support for well data analysis, mapping, import/export georeferenced images, more flexible licensing, and more.

Houston, TX —INT is pleased to announce the newest release of INTViewer. This release includes a RemoteMap plugin, support for the import and export of GeoTIFF files, a new extended well data structure, and flexible license borrowing.


“This latest release focuses on giving INTViewer users the ability to create a new Well data model, improved mapping capabilities with new features, and the ability to borrow licenses through a new and improved UI. We believe these additions and improvements will result in significant performance gains for our clients.”

—Laurent Renard, Research and Development Manager at INT, Inc.


RELEASE HIGHLIGHTS:

  • RemoteMap Plugin — Allows users to overlay data on a background map from Google or Bing maps, set up a custom Web Map Service (WMS) server (authentication not supported), and the ability to overly multiple remote layers.
  • Import and Export GeoTIFF Files — Users can produce georeferenced images by exporting maps to a GeoTIFF image to view in any GIS software.
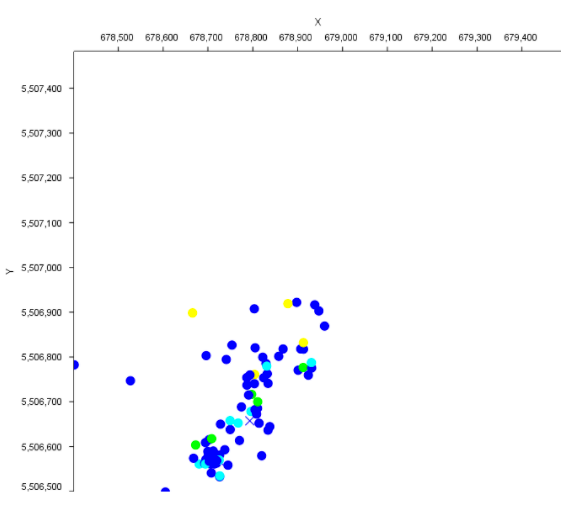
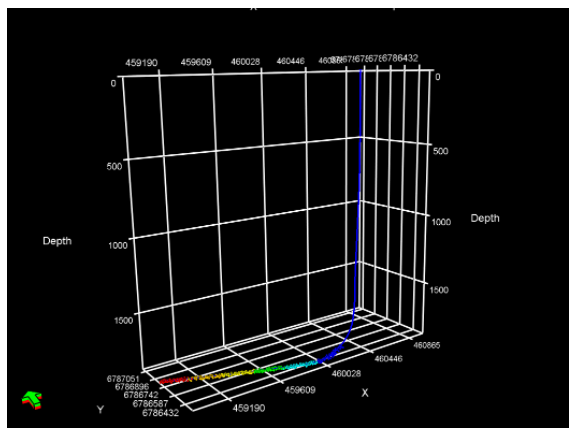
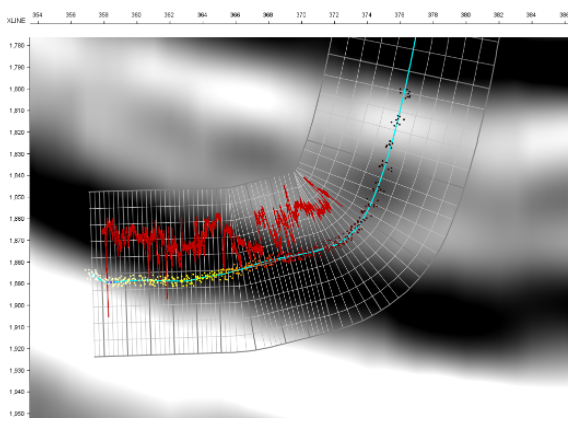
  • Extended Well Data (EWD) — Can be displayed in the Well Log Window, Map views, and 3D and seismic viewers. EWD offers the ability to edit your log curve data and Time/Depth conversion as well as manual editing. EWD can be created from LAS files and exported to LAS files after editing.
  • License Borrowing — Allows users to perform borrowing licenses through a new UI. This improvement will be useful when a geoscientist needs to take INTViewer on his laptop to work in the field for a limited time.

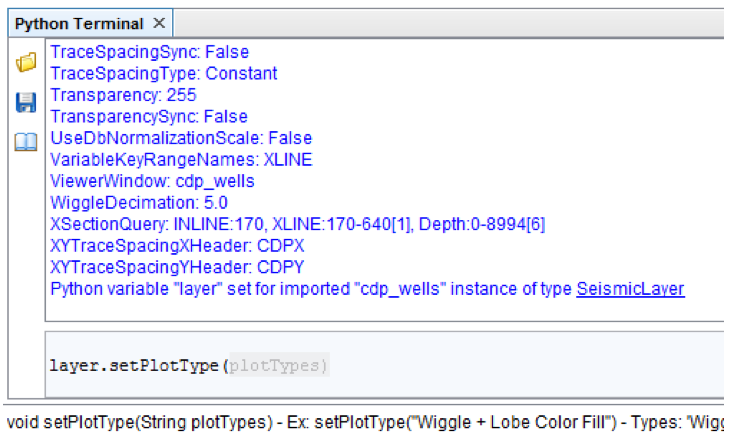
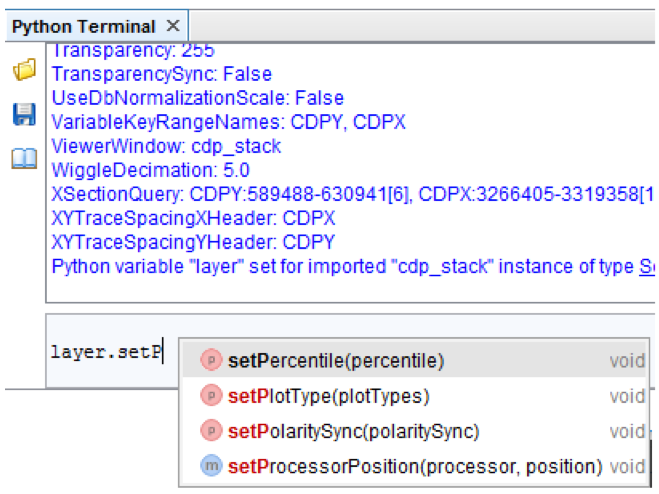
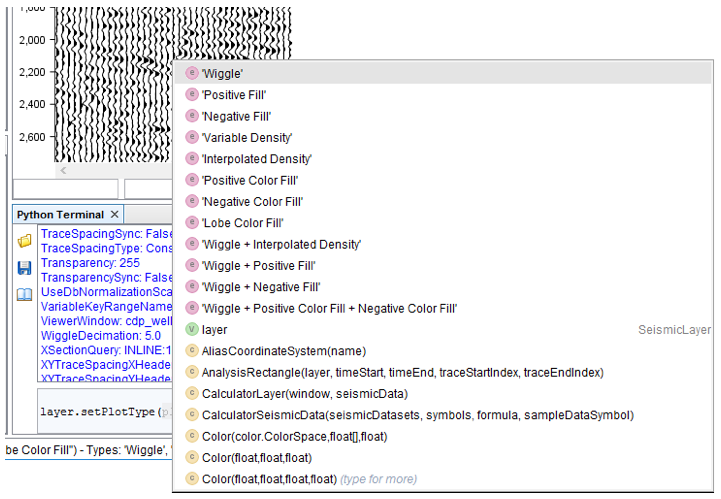
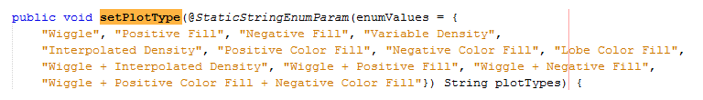
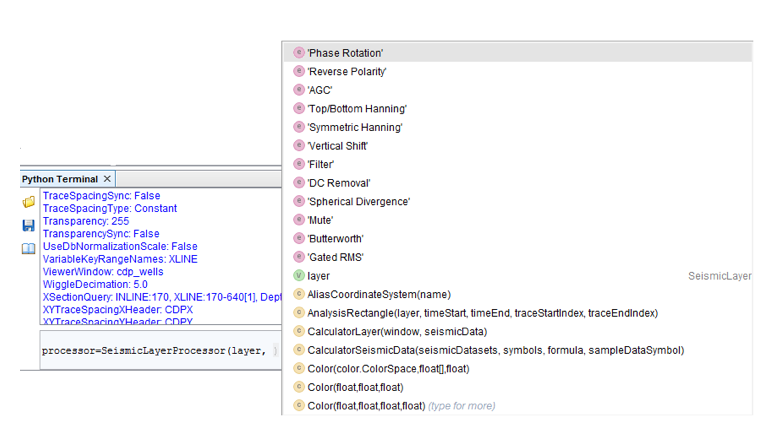
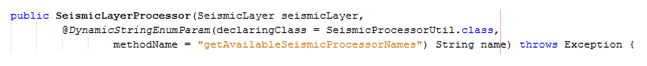
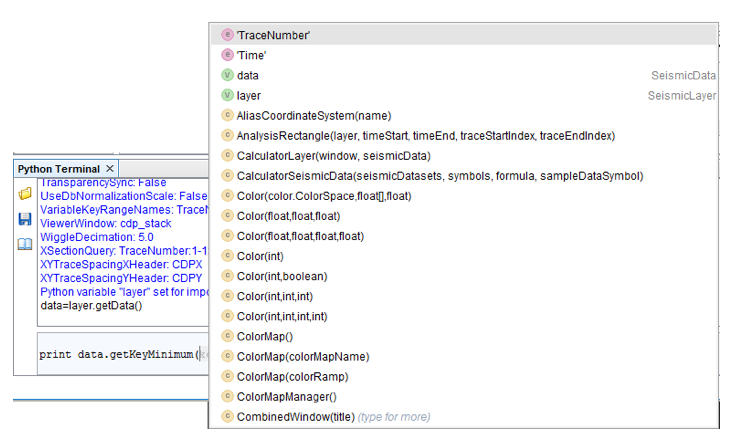
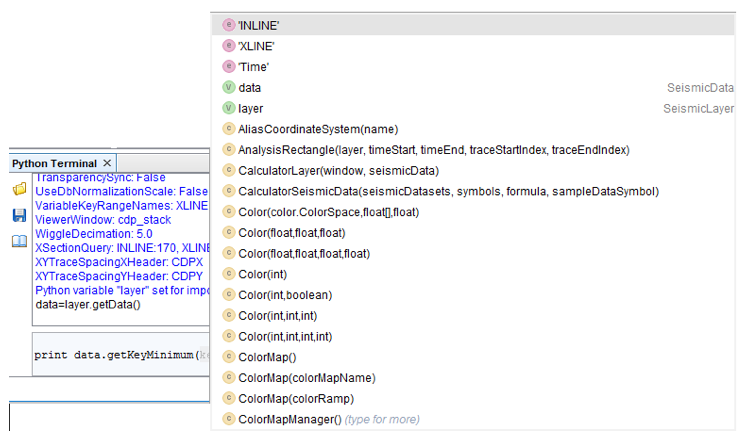
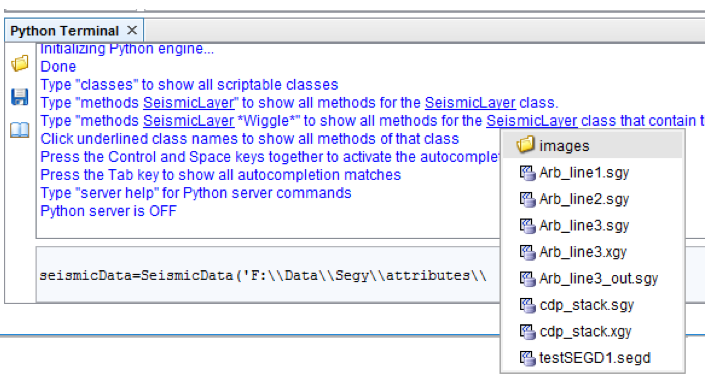
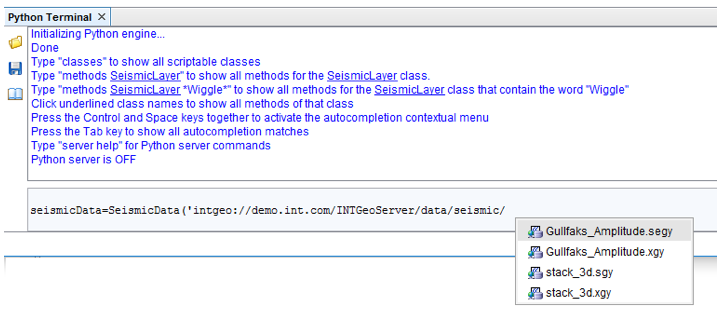
INTViewer is a software that allows geoscientists to view seismic and well data, check for errors, confirm geospatial integrity, perform light processing, and analyze their datasets. INTViewer is specifically designed to quickly access large datasets—prestack, stack, and 2D—from a laptop in the field to a desktop or remotely via the cloud. INTViewer is customizable to support proprietary and automated workflow via Python script.

Read the press release on PRWeb.

For more information about INTViewer or INT’s other products, please visit int.flywheelstaging.com. 

Interested in trying INTViewer?

Request a trial for INTViewer today


Filed Under: INTViewer, Press Release Tagged With: INTViewer, maps, press release, python

Oct 02 2017

Live Completion Is Better than AutoCompletion

A major feature of INTViewer 5.2 is the Python integration. Our development team worked very hard to ensure that our customers can get started easily and be productive once they are hooked.

One consistent user feedback was that the Python terminal lacked autocompletion. It could become tedious to have to type the full name of each class, each method or each variable. We took this feedback to heart and implemented autocompletion in INTViewer 5.2.

Just like any other editor, to trigger autocompletion, just type a partial name then press Ctrl+Space on your keyboard. If there is only one match possible, the Python terminal will autocomplete your line.

For example, if a seismic layer has the variable name “layer”, typing layer.setPl will autocomplete to layer.setPlotType(.

Another refinement is that the signature of the setPlotType method is displayed at the bottom of the screen. Also, the parameter that this method expects is displayed as a shadow in the same line.

Python terminal plot type layer
The Python terminal as you change the plot type of a layer
 
 
If several matches are possible, a contextual menu is shown.

Python Contextual Menu


All of these features are expected in a Python editor. But to deliver on the promise that the INTViewer Python API was easy to learn, we wanted to go beyond. The first work order was to add the concept of enumeration. If a method only accepts a defined set of parameter values, these values should be hinted at. Upon pressing Ctrl+Space on your keyboard, the Python terminal will show all these possible values.

In this contextual menu, the menu items with a purple dot show enumerated values. The green dots are for variables already defined and the yellow dots are for class constructors.

The autocompletion of plot types
 
 
If you plug your own Python classes, we made it incredibly easy to enable completion for enumerated values, just by adding a StaticStringEnumParam annotation. Here is an example for the setPlotType method:

Python StaticStringEnumParam annotation
Example of use of the StaticStringEnumParam annotation
 

In the Java language, enumerations are static: The set of values is defined as part of the enumeration definition and cannot be changed.

Python terminal - trace processor
The Python terminal as you create a trace processor
 

INTViewer is a highly pluggable application and enumerated sets are often only known at runtime. For example, many customers plug their own trace processors. It’s only when INTViewer starts that each installed plugin is inspected for trace processors. As a result, we also implemented dynamic enumerations.

The SeismicLayerProcessor class is the perfect example of dynamic enumerations. To find the list of possible trace processor names, INTViewer looks up which trace processors are currently plugged.

 
The definition of such dynamic enumerations is also quite simple. With the DynamicStringEnumParam annotation, INTViewer searches for the specified method in the specified class to generate the list of proposed options.

Python DynamicStringEnumParam annotation
Example of use of the DynamicStringEnumParam annotation
 

This is the first example of a “live” autocompletion. This is a feature that commercial Python editors typically do not provide because they lack the deep integration with the runtime environment.

If we only provided dynamic enumerations, calling our autocompletion “Live Completion” would be a bit of a stretch. The ground-breaking feature is that this live autocompletion doesn’t just apply to classes, it also applies to instances of these classes.

For example, in the screenshot below, the dataset manipulated has only 2 keys: TraceNumber and Time. When I type data.getMinimum(, the two proposed values are TraceNumber and Time.

Python terminal - raw Segy dataset
The Python terminal as you retrieve the boundaries of a raw Segy dataset
 
For another dataset that has 3 keys, I will get a different set of key names:

Python Indexed Segy
The Python terminal as you retrieve the boundaries of an indexed Segy dataset
 
As enumerated values are generated dynamically based upon the instance, not the class, we are able to provide a much more powerful autocompletion than a typical Python editor can provide. A python editor doesn’t execute your code, it can only perform a static analysis. The Python terminal has a different behavior where each line entered is executed on the fly, allowing us to inspect the set of local variables already defined and make more much insightful suggestions.

Defining your own dynamic instance-based enumeration is simple. In the example below using the InstanceStringEnumParam annotation, getKeyNames is a method defined in the same class as the getKeyMinimum method.

Python InstanceStringEnumParam annotation
Example of use of the InstanceStringEnumParam annotation


Dynamic enumerations really provide extra help for users to learn the INTViewer API. It’s a powerful mechanism that we also leverage when users instantiate datasets. Each resource in INTViewer has a path, typically a file path. Remembering and typing that exact file path is a cumbersome task, so we made the entry of paths “live” as well.

Python terminal local seismic dataset
The Python terminal as you enter the path to a local seismic dataset


INTViewer recognizes the methods that require paths as parameters, and autocompletes these parameters, filtering out files that are not of the specified type. You are not limited to browsing your local file system—this autocompletion also works for remote data servers such as INTGeoServer:

Python terminal remote seismic dataset
The Python terminal as you enter the path to a remote seismic dataset


As a developer, you can easily leverage this mechanism with the DataPathParam annotation. Here is the definition of the SeismicData constructor:

Python DataPathParam annotation
Example of use of the DataPathParam annotation


For files that are not data files, a simple PathParam annotation is available:

Python PathParam annotation
Example of use of the PathParam annotation


We put a great deal of effort into INTViewer Python capabilities and are really proud of what we were able to accomplish. To get started with Python in INTViewer, visit our help guide!

For more information about INTViewer, check out our other blogs, visit the INTViewer product page, or contact us for a free trial.


Filed Under: Uncategorized Tagged With: autocompletion, INTViewer, live completion, python

Jun 21 2017

Visualize Microseismic Events with INTViewer Plugins [Walkthrough]

INTViewer is well-known for its seismic analysis capabilities. Among the less well-known plugins, there is a set that always impresses during demos: the microseismic plugins, a set of four plugins that allows INTViewer users to visualize microseismic events.

To download these free plugins from INTViewer, open Tools→Download Plugins and click the Download Plugin link. A wizard will open. Follow this wizard to perform the installation.

INTViewer’s Plugin Store, directly accessible from inside the application.


This installation adds a menu item to the File menu. Select File→Open in 3D→Microseismic, then select a dataset. INTViewer supports microseismic files in .CSV (comma-separated values) format. A microseismic dataset is essentially a set of X and Y points, and each point has a timestamp and attribute values. If your dataset is not stored in the .CSV format, it would be easy to plug your own with the INTViewer public API.

There are several ways that microseismic events can be represented in a .CSV file, and a mapping needs to be specified to let INTViewer know how to read this file. There is an Auto Detect button that facilitates that process.


INTViewer is able to detect complex data formats, even with the date and time stored in the same column. In this example above, the timestamp section specifies that both date and time are stored in column 1.

The 3D visualization will load after you press the OK button.

Basic visualization of microseismic events in 3D


The visualization of microseismic events can have up to 7 dimensions. The first 3 dimensions are X, Y and Z. A 4th dimension is color. In the example above, points are colored by amplitude values. You can visualize a 5th dimension by selecting an attribute to control the size.

Visualization with variable size symbols


You can visualize a 6th dimension by selecting an attribute to control the transparency.

Visualization with transparency


The last dimension are the symbols themselves. Just like we use color maps to color points, we can use symbol maps to symbolize points.

Visualization with a symbol map


Because events are indexed by time, INTViewer makes it easy to reveal the sequence of events for a microseismic dataset. Open Window→Playback

The Playback window


The Playback window shows an histogram of events, ordered by timestamp. The longer the bar, the higher the number of events for that timestamp. By pressing the Play buttons, you start the animation of all your microseismic displays.

Interaction between the Playback window and the 3D visualization


The playback window is not the only histogram you can visualize. The distribution of any attribute is accessible.

Histogram of the CHI attribute


Cross-plotting is also possible. Select two attributes of a microseismic dataset for the X and Y axis, then one for the color.

Cross-Plot between the LTA and CHI attributes, colored by depth


The map window has capabilities similar to the 3D window. The color and symbol of points can be controlled by the values of any two attributes.

Example of map visualization


The map window is a powerful tool, featuring on-the-fly conversions between coordinate reference systems. If you specified a CRS during the mapping step, you can reproject your data to any other CRS.

All windows can visualize multiple datasets at once. In the example below, we combined a well and microseismic events.

Combining a well trajectory and a microseismic in 3D


The XSection window visualization is particularly interesting. It allows you to combine a seismic dataset, a well trajectory, and microseismic events.

Combining a seismic, a well trajectory and a microseismic in a XSection window
The Gamma-Ray (GR) well curve is shown in red


The last feature of this walkthrough is INTViewer’s Python scripting. Just like any other data type, you automate the visualization of microseismic events with a few lines of Python. INTViewer has the option to act as a Python server that an external system can easily control. Events can be added programmatically to microseismic datasets. New points are visualized immediately, making INTViewer an option to visualize real-time microseismic data.

We’ve published a few tutorials showcasing how Python can be used to work with microseismic data:

Generating synthetic microseismic data
Creating a sub-selection of a microseismic dataset using a cross-plot trend shape

Ready to learn more? Contact us for a live demo of the microseismic plugins!


Filed Under: INTViewer Tagged With: histogram, microseismic, plugins, python

Apr 16 2017

Simple Usability Features for Desktop Applications

My day-to-day workstation is a Windows PC. It has a good GPU, but otherwise, it’s a fairly normal computer. I use NetBeans IDE all the time. I also use Microsoft Word and Excel, but I find that there is still room to improve: The user interface is still overly driven by the file system. I constantly switch between applications, often repeating the same steps to point each application to where my files might be, either in My Documents, Downloads, Data, or Desktop.

INTViewer is an application that is very file-driven. Once you launch INTViewer, most likely your next interaction will be to designate the location on disk of a file to load, whether that file is a seismic dataset, an INTViewer session, or a slideshow. Likewise, as you save renderings to image files, or as you export sample values to Excel, you will need to designate a location on disk for your output.

Microsoft Windows has a standard dialog to choose and save files, but this is not an optimal way to navigate your file system from within your application because this dialog hides your content while you are choosing a path on disk. INTViewer addresses this by offering to open the directory where you just saved a file.
 

The notification that appears in INTViewer once you save a session file.
 
The idea is to make the application aware of the user workflow, anticipate it, and facilitate it. If you save a session file, your next step might be to share it with others. How many times have you saved a file and wondered the next second where you just saved it? Opening the directory where this file resides makes this next task easier. INTViewer’s non-blocking notification is not intrusive: users can ignore it, and there’s no “cancel” button to press to shoo a pesky dialog away.

(I often wish Notepad had this feature. In fact, I wish ALL desktop applications had this feature. It’s really simple to implement and would make my day-to-day tasks that much easier.)

One benefit that desktop applications have over web applications is productivity. A power user often loads files from the same directories. As a result, the path of these directories is well-known. This is especially true for Linux users. Why not facilitate the entry of these paths? Here is an example of field where a file path needs to be entered.

For power users, the “choose” button should only be a fallback. Otherwise, it interrupts the flow. Typing the path directly would be a better option if only it were easier. The Python terminal has no choose button, so when we designed the autocompletion of Python scripts, we made it possible for users to enter a path interactively: just type Control+Space on your keyboard. With that, the file system becomes accessible at your fingertips, without a file chooser.
 

INTViewer Python scripting terminal
 

This is a simple feature, but very useful in this scripting context. Once we added it, we realized it would be quite simple to reuse in the context of path fields. Path fields in INTViewer 5.2 have the same contextual capabilities as the Python terminal.

Now that both of these features are in place, I use them all the time. In fact, I save so much time (and headache), I wish all of my other desktop applications worked this way.

Check back soon for more new features and tips on how to use INTViewer or contact us for a demo.


Filed Under: INTViewer Tagged With: INTViewer, python, script

Footer

Solutions

  • Real-Time Visualization
  • Visualization Components
  • New Energy Visualization
  • OSDU Visualization
  • Machine Learning
  • Developer Tools
  • Cloud Partners
  • Customer Success Stories

Products

  • IVAAP
  • GeoToolkit
  • INTViewer
  • IVAAP Demos
  • GeoToolkit Demos

About

  • News
  • Events
  • Careers
  • Management Team

Resources

  • Blog
  • FAQ

Support

  • JIRA
  • Developer Community

Contact

INT logo
© 1989–2024 Interactive Network Technologies, Inc.
Privacy Policy
  • Careers
  • Contact Us
  • Search

COPYRIGHT © 2025 INTERACTIVE NETWORK TECHNOLOGIES, Inc