The WebGL technology that allows 3D rendering on browsers was released in 2009, and yet, 11 years later, 3D is hardly said to be common for web applications in E&P. Despite the advantages of 3D rendering and the trend of migrating applications to web browsers, there are various obstacles that developers have to face and overcome. The steep learning curve, the insufficient cross-platform support, and the difficulty of maintaining make WebGL a beast to work with. In a way, we want to keep the obstacles away from web developers, so INT provides Carnac3D, a subset of GeoToolkit, as an industry-leading graphical product.
Carnac3D is a comprehensive set of graphical tools for data visualization, and it empowers 3D rendering for IVAAP and many other industrial applications. The toolset utilizes WebGL to achieve GPU rendering in web browsers. Meanwhile, it mitigates the drawbacks of the technology and enriches the functionalities specialized for oil and gas.
Getting Started with 3D Rendering Should Not Be Frustrating
The concept of 3D rendering has a lot in common with photography: We need a camera, a scene, and a light source to get started. They are so essential that we can’t take photos without them. In WebGL, it is the same process, except we cannot take that equipment for granted. We had to create a camera, a scene, and a light source ourselves each time we built an application, by playing with the C-like shading language and the low-level graphical APIs. It was a tedious procedure, so we have proposed a solution in Carnac3D. We want our users to have all tools ready when they start to build an application, without having to build tools first.
Having things encapsulated doesn’t mean the user will lose control of the details, because we also provide an intuitive interface. No matter which framework (Angular, React, or Vue) or language (JavaScript or TypeScript) the users choose, they can modify and control the settings for rendering with minimum efforts.
An active community and strong support are things that developers look for when they evaluate and choose among different technologies. INT honors these and has established a developer site with detailed documentation and tutorials. Whenever our users have questions, they can always get help by simply opening a support ticket or logging on to the INT Developer Community.
Rendering E&P Models Is as Simple as Providing Data
From the render engine’s perspective, it only rasterizes primitives like triangles and does not understand industrial models by default. How can our users render complicated industrial models without having to stack triangles? Our work in Carnac3D gets the job done, so the users can focus on what is more important for them.
3D graphics require a lot of math computations to be done. For example, the render engine behind the hood needs to perform numerous matrix operations for simple actions such as translating, scaling, and rotation. During our process of developing, we created many helper functions that tackle 3D math. Our math module also handles the situation when the users need to trim and fit their 3D data.
Typical E&P features in Carnac3D include, but are not limited to, well trajectories, log curves, array logs, seismics, surfaces, volumetric rendering, and reservoirs. In the user’s application, these features are available and ready to use by providing corresponding datasets. Possible sources for the dataset are local files on disk, data in cloud storage like AWS, and different services like INTGeoServer. We also take into account if users have their own data storage.
ReservoirGrid Is an Example of How We Optimize Things
ReservoirGrid is a feature in Carnac3D that allows users to visualize reservoir characterization. For years, web developers in oil and gas industries have worked on increasing the capacity of reservoir rendering while maintaining a desirable performance. Due to the limitation of web browsers, it’s hard for web applications to catch up with desktop counterparts in terms of performance and scalability. ReservoirGrid is our solution that tackles the dilemma.
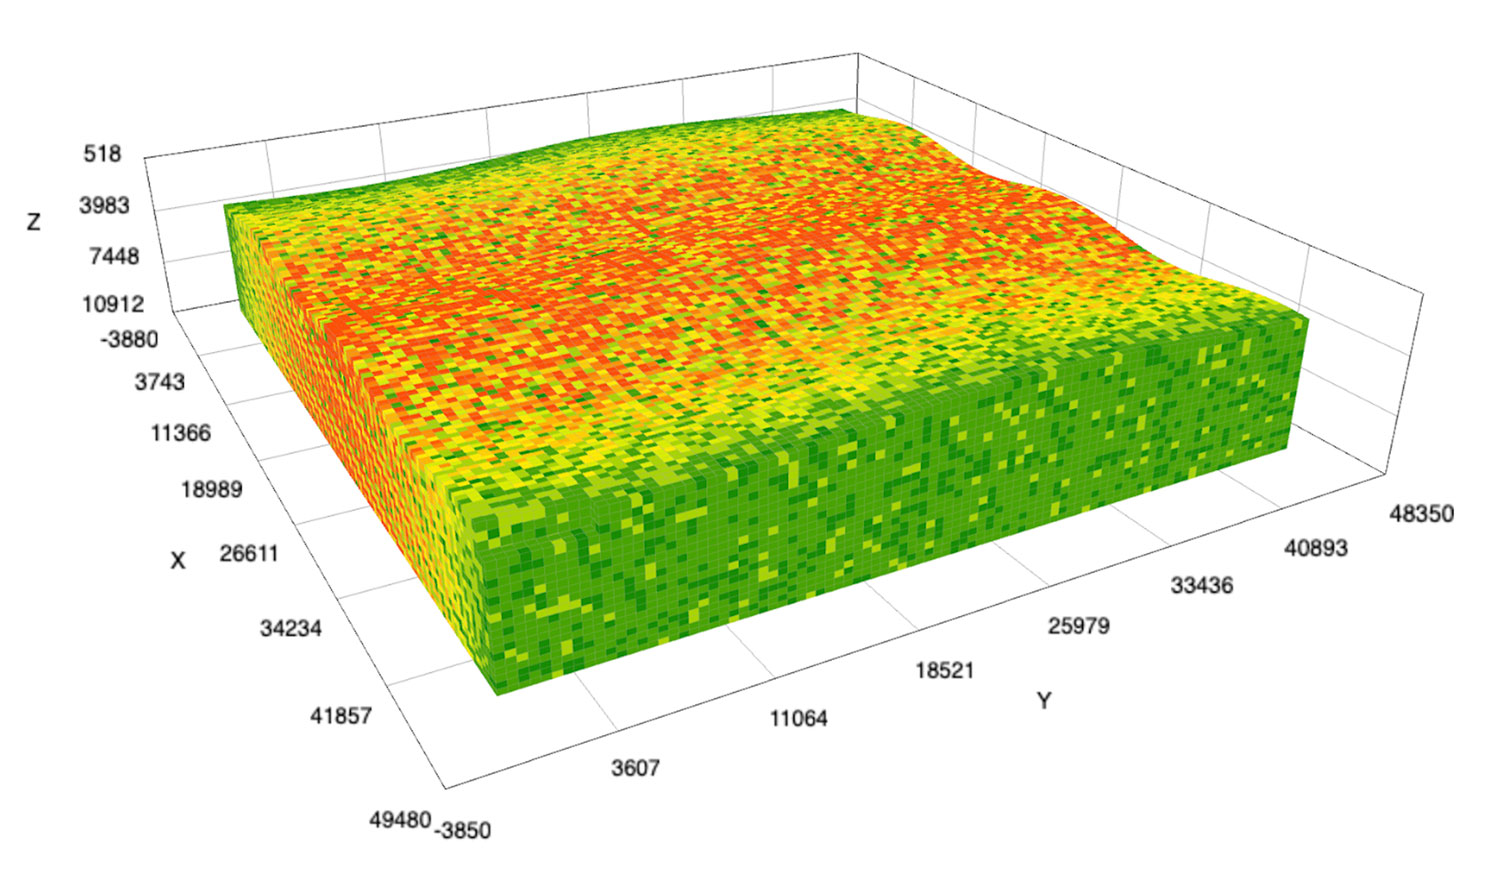
To break down into details, we shall see a reservoir consists of numerous hexahedral cells. Each cell stores information such as property value (color), IJK index, and custom data. By bundling the cells together, it can display some internal objects like horizons and skeletons. What makes our ReservoirGrid standout if it sounds concise already? The short answer is optimization.
We rely on all possible hardware accelerations that WebGL is capable of doing. For example, we noticed that the outlines of each cell bring extra computing burden, so we eliminated these extra draw calls by dealing with them in shaders. We consider it slow to let the CPU do cell filtering, so we impose filters in shaders to reduce communication costs. We observe that each cell might have different shapes, but it is hexahedral anyway, so we manage the GPU to perform instancing drawing with a single draw call. The above and many other minor optimizations help ReservoirGrid render up to a million cells with an entry-level GPU.
For more information on 3D Rendering or INT’s GeoToolkit, please visit our GeoToolkit page.
Want to know more? Check out our webinar Optimizing 3D Subsurface Web Applications.