• Skip to main content
  • Skip to footer

INT

Empowering Visualization

COMMUNITY BLOG
CONTACT US SUPPORT
MENUMENU
  • Solutions
    • Overview
    • Real-Time Visualization
    • Visualization Components
    • New Energy Visualization
    • OSDU Visualization
    • Machine Learning
    • Developer Tools
    • Cloud Partners
  • Products
    • IVAAP™
          • SOLUTIONS

            Real-Time Visualization

            OSDU Visualization

            Visualization Components

            New Energy Visualization

            Upstream Data Visualization

          • SUCCESS STORIES

            WEATHERFORD
            Well delivery optimization software

            BARDASZ
            Data management, data quality monitoring

            ANPG / SATEC-MIAPIA
            Virtual data room

            MAILLANCE
            High-performance visualization of ML algorithms

            SEE ALL >

          • SUPPORT

            DEVELOPER COMMUNITY
            Join or log in to the INT Developer Community.

            GET SUPPORT
            Log a ticket for an issue or bug.

            CONTACT US

          • DEMOS

            IVAAP DEMOS
            Cloud-Based Demos

            FIRST TIME HERE?
            Register to access our
            IVAAP demos

    • GeoToolkit™
          • SUCCESS STORIES

            CAYROS
            Field development planning

            TOTALENERGIES
            High-performance large dataset reservoir rendering

            IFP ENERGIES NOUVELLES
            Seismic and structural interpretation validation

            SEE ALL >

          • SUPPORT

            DEVELOPER COMMUNITY
            Join or log in to the INT Developer Community.

            GET SUPPORT
            Log a ticket for an issue or bug.

            CONTACT US

          • DEMOS

            GEOTOOLKIT DEMOS
            Geoscience Demos

    • INTViewer™
          • SUCCESS STORIES

            STRYDE
            Fast seismic QA/QC in the field

            SILVERTHORNE SEISMIC
            Efficient 2D/3D seismic data delivery

            WIRELESS SEISMIC
            Drones, IoT, and Advanced Onsite Seismic Data Validation

            SEE ALL >

          • SUPPORT

            GET SUPPORT
            Log a ticket for an issue or bug.

            CONTACT US

          • PLUG-INS

            EXTEND INTVIEWER
            More than 65 plugins available

  • Demos
    • GeoToolkit Demos
    • IVAAP Demos
  • Success Stories
  • Resources
    • Blog
    • Developer Community
    • FAQ
    • INT Resources Library
  • About
    • Overview
    • News
    • Events
    • Careers
    • Meet Our Team
    • About INT

schematics

Apr 18 2024

Celebrating a Decade of Innovation: GeoToolkit.JS Marks 10 Years of Empowering Subsurface Data Visualization

In the realm of subsurface data visualization, the 10th anniversary of GeoToolkit.JS marks a significant milestone. What began as a comprehensive set of high-performance tools and libraries has evolved into an indispensable resource for developers seeking to craft advanced, domain-specific software efficiently.

GeoToolkit™ encompasses diverse features, catering to the complex needs of developers working with 2D/3D seismic, well log, schematics, contour, maps, charts, and more. Its flexibility allows embedding within energy applications or building from the ground up, facilitating swift and precise development. Also, integrating GeoToolkit.JS data visualization libraries within the oil and gas industry is a game-changer for the end user—be it a geoscientist, an engineer, or a decision-maker. These individuals rely on accurate, comprehensive insights derived from complex subsurface data.

This anniversary is not just a celebration of a decade but a commemoration of more than 30 years of GeoToolkit’s presence in the industry, with versions spanning .NET, Java, JavaScript / TypeScript, and C++. Over this period, GeoToolkit has continuously evolved, refining its capabilities and pushing the boundaries of subsurface data visualization.

The journey of GeoToolkit has been paved with remarkable achievements. Its key benefits include support for various subsurface data formats like LAS, DLIS, WITSML, SEG-Y, SEG-D, and more in some versions of GeoToolkit. Moreover, it provides robust technical support, extensive online documentation, and a thriving Developer Community, fostering collaboration and knowledge exchange.

GeoToolkit’s high-performance tools and libraries stand out for their plug-and-play nature. With just a single line of code, developers can deploy these tools or use them as the foundation for crafting custom applications, significantly expediting time-to-market.

The extensive capabilities of GeoToolkit cover a broad spectrum of functionalities, from 3D seismic and reservoir data visualization using WebGL technology to 2D scatter plots for comparison, well log displays that can correlate thousands of wells, and the creation of PDF reports with multiple widgets for streamlined log header construction.

Furthermore, its extensive volume rendering capability facilitates high-quality visualizations of massive datasets, enabling seamless visualization of billions of cells. GeoToolkit also boasts robust support for diverse map layers, such as Google, ESRI, Bing Maps, ArcGIS GeoServices, OpenStreetMap, and more, making it an invaluable asset for comprehensive geospatial applications.

Here’s a glimpse of the evolution of GeoToolkit.JS showcasing its transformative capabilities:

Report Builder

Build PDF reports with multiple widgets, including custom log headers, with template saving and printing for efficient creation and sharing.

Report Builder- pic

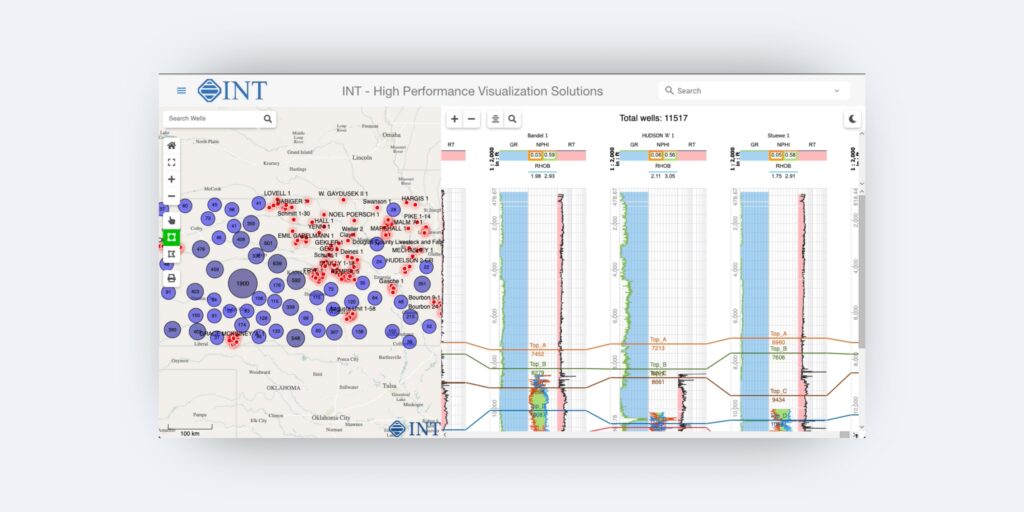
Well Log Correlation

Correlate thousands of wells effortlessly with well log displays, streamlining your analysis.

Well log correlation – pic

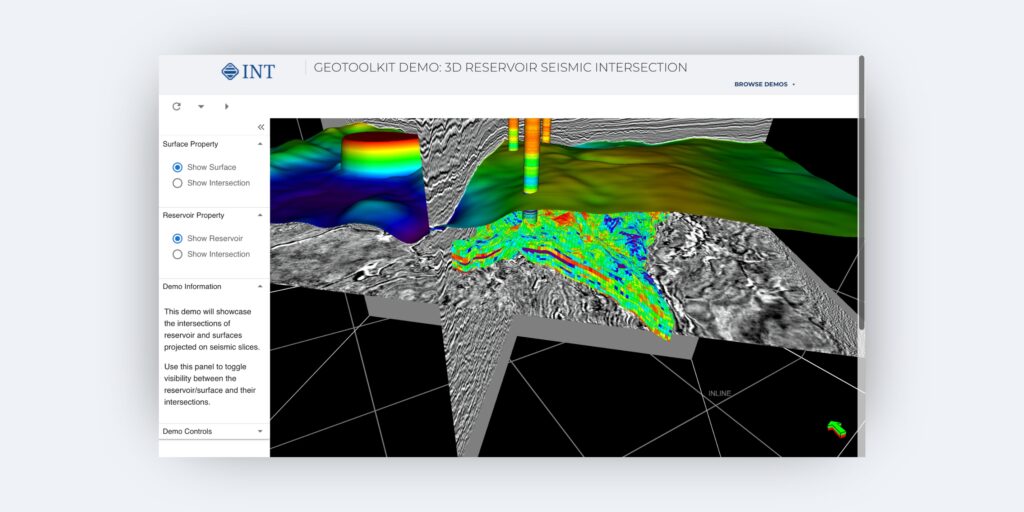
3D Reservoir Seismic Intersection

Intersect your 3D reservoir grid with seismic data and add well logs, horizons, and more.

3D Reservoir Seismic Intersection – pic

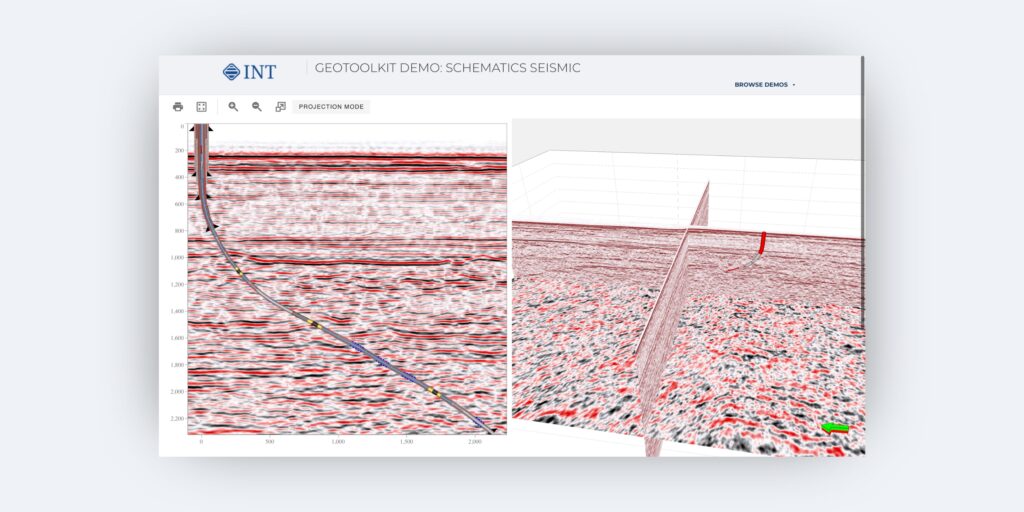
Schematics Seismic

Combining wellbore architecture with seismic profiles, this tool allows you to identify zones of interest in relation to each hole section and cementing sections versus formations crossed.

Schematics Seismic – pic

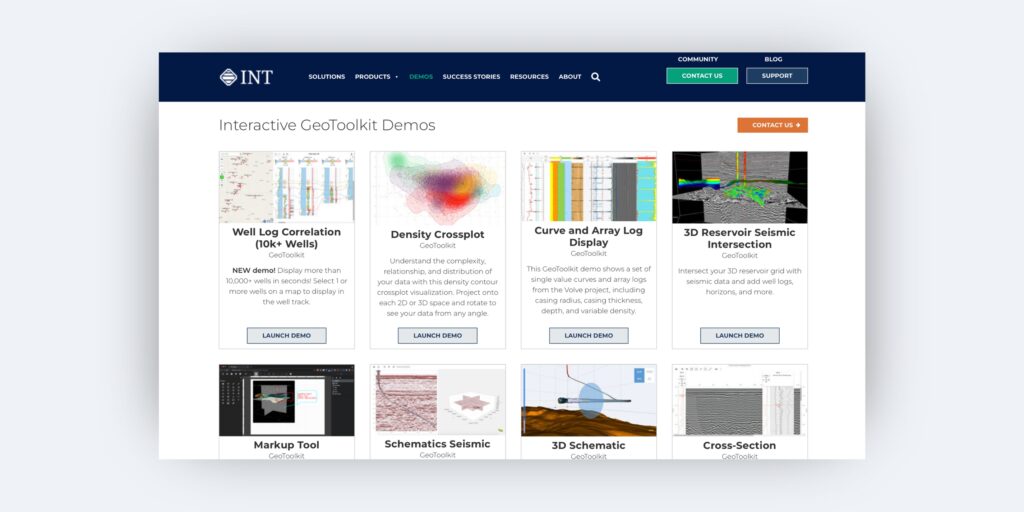
GeoToolkit Demo Gallery

Dive deeper and experience the transformative capabilities of GeoToolkit with our Interactive GeoToolkit Demos.

GeoToolkit Demo Gallery – pic


“Without INT’s GeoToolkit, we wouldn’t be where we are right now with C-Fields. We have high expectations that this tool will become the standard in Field Development planning and that we will be able to accomplish a lot with this tool. There’s nothing in the market like C-Fields right now.”

—Francisco Caycedo, Regional Director Latin America, CAYROS


However, amidst this celebration, expressing our deepest gratitude is crucial. To every individual involved in the development of GeoToolkit, your dedication, expertise, and unwavering commitment have been the cornerstone of our success. Your collective efforts have driven innovation, shaped the product, and paved the way for a decade of groundbreaking achievements.

To our clients, we extend our heartfelt thanks. Your trust, partnership, and continuous support have been the driving force behind GeoToolkit’s evolution. 

The 10th anniversary of GeoToolkit.JS showcases innovation and an unwavering commitment to empowering developers in the intricate landscape of subsurface data visualization. Here’s to a decade of achievements and many more years of pioneering advancements in the field.

To learn more about GeoToolkit.JS, please visit int.com/products/geotoolkit/ or contact us at intinfo@int.com.

Explore our Interactive GeoToolkit Demos
Request a 30-day trial
Filed Under: GeoToolkit, JavaScript Tagged With: .JS, .net, ArcGIS GeoServices, Bing maps, C++, DLIS, ESRI, java, javascript, LAS, OpenStreetMap, schematics, SEGD, segy, seismic, welllog, WITSML

Apr 15 2021

INT to leverage IBM, Red Hat Open Technologies to Enhance Efficiencies in Oil & Gas Exploration and Drilling Workflows

The latest version of INT’s data visualization platform, IVAAP, integrates with IBM Open Data for Industries, IBM’s hybrid cloud implementation of the Open Group OSDU data.

HOUSTON, TX — April 15, 2021 — INT today announced that IVAAP — a leading enterprise subsurface data visualization platform — integrates with IBM Open Data for Industries for Cloud Pak for Data built on Red Hat OpenShift. These open technologies will enable the upstream industry to visualize exploration and drilling data across hybrid cloud environments to drive efficiencies and speed decision making.

As the oil and gas industry undergoes unparalleled transformation, members of the value chain are seeking solutions to maximize digital opportunities across their operations. Data is a critical asset and when leveraged with artificial intelligence, can yield mission-critical insights and competitive advantage.  However, quite often, domain-specific data exists in silos — limiting workflow efficiencies that leverage data insights for real-time decision-making.

Today’s announcement focuses on open technologies for the IVAAP platform that remove these barriers:

  • IVAAP leverages IBM Open Data for Industries for IBM Cloud Pak for Data, a data platform enabling seamless integration of data sources with the flexibility to deploy across any infrastructure that leverages The Open Group OSDU Forum data standard. The Open Group OSDU Forum is an industry organization that brings together technology leaders, producers and members of the oil and gas value chain to build a data foundation based on data standards making subsurface data easier to find, combine, and use across geoscience workflows.
  • IVAAP integrates with IBM Open Data for Industries for IBM Cloud Pak for Data powered by Red Hat OpenShift, the industry’s leading open source Kubernetes platform. This will enable INT customers to run IVAAP on-premise, unlocking speed and agility for local operations as well as remote locations through the cloud, yet all with one consistent architecture. This provides upstream operators greater value and flexibility for real-time operational decision-making, as well as consistency to the enterprise operations.

“We are extremely excited about the work we are engaging in with The Open Group OSDUTM Forum and our collaboration with IBM. For clients who manage hybrid cloud environments, our goal is to bring the technology to where they need it — in the cloud and in their locally hosted environment.”

— Olivier Lhemann, President of INT.


“Our collaboration with INT enables choice and flexibility in deploying subsurface data visualization across hybrid cloud environments. By leveraging IBM Open Data for Industries for IBM Cloud Pak for Data, INT and the oil and gas community can leverage an enterprise-grade, open-source platform based on the OSDU data foundation, improving access to subsurface data across any infrastructure, including public cloud, local country cloud and on-prem,” says Dariusz Piotrowski, Global Solutions Leader,
IBM Industrial Sector.

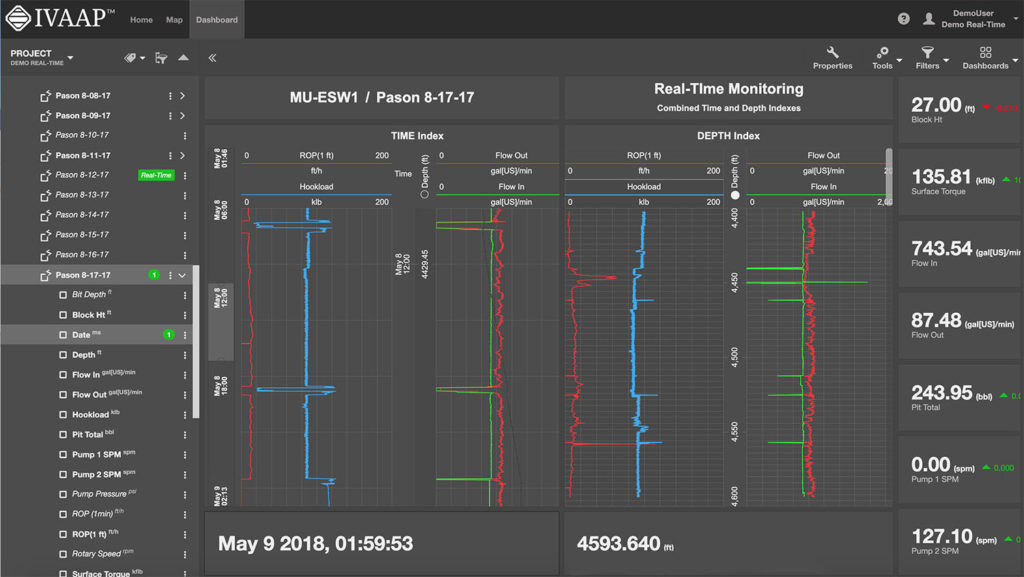
IVAAP is a sophisticated domain visualization and analytics platform that provides central access to data regardless of where it is — stored in the cloud and on-premise. Users can access, view, search, visualize, and analyze their subsurface data — wellbore, seismic, schematics, log, and more — in a web browser.

About INT:

INT software empowers the largest Oil & Gas (IOC/NOC) and services companies in the world to visualize their complex subsurface data (seismic, well log, reservoir, and schematics in 2D/3D). INT offers a visualization platform (IVAAP) and libraries (GeoToolkit) developers can use with their data ecosystem to deliver subsurface solutions (Exploration, Drilling, Production). INT’s powerful HTML5/JavaScript technology can be used for data aggregation, API services, high-performance visualization of G&G and petrophysical data in a browser. INT simplifies complex subsurface data visualization.

Read the press release on PRWeb.

For more information about IVAAP or INT’s other data visualization products, please visit https://int.flywheelstaging.com.

INT, the INT logo, and IVAAP are trademarks of Interactive Network Technologies, Inc., in the United States and/or other countries.

Red Hat, the Red Hat logo and OpenShift are trademarks or registered trademarks of Red Hat, Inc. or its subsidiaries in the U.S. and other countries.


Filed Under: IVAAP, Press Release Tagged With: IBM, ivaap, log, OSDU, schematics, seismic, subsurface data visualization, wellbore

Dec 02 2020

IVAAP Release 2.7: More Map Search and ArcGIS Features

IVAAP™ is a subsurface data visualization platform that provides developers and product owners powerful subsurface visualization features for their digital solutions in the cloud. IVAAP enables users to search, access, display, and analyze 2D/3D G&G and petrophysical data in a single user-friendly dashboard on the web. The latest release of IVAAP 2.7 comes with various new features and significant improvements.

Highlights from this release include many advanced search and map capabilities, improved 3D widget filter dialog, new interval curves support, new date/time picker for Cross-Plot widget axis settings, and more! 

Advanced Mapping Capabilities

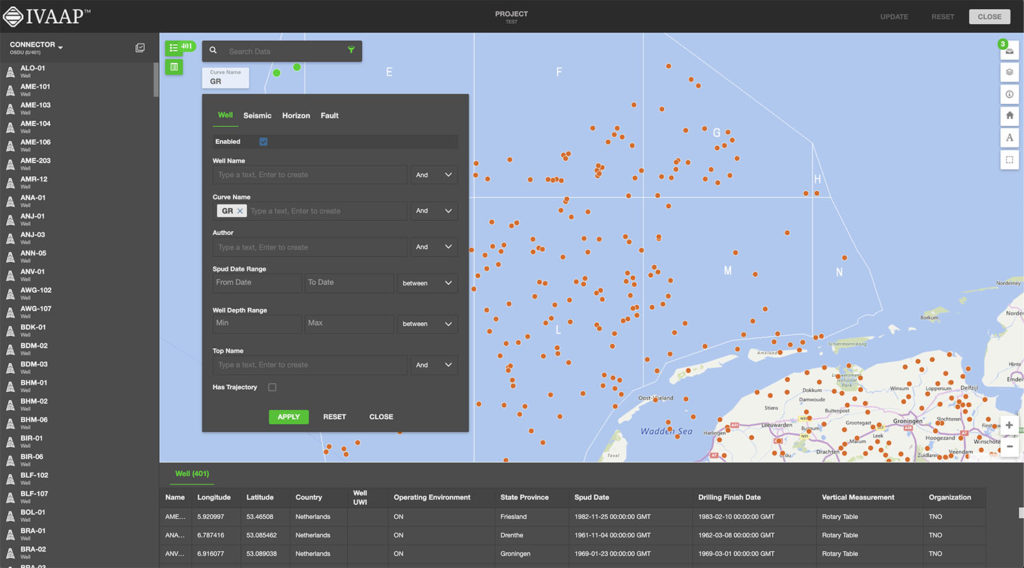
IVAAP features support for visual-based data discovery using map-based search, and is fully integrated with ArcGIS (ESRI), allowing for the search of structured and unstructured data in a data lake or any other file repository. IVAAP supports a wide range of map formats and services like ArcGIS, GeoJSON, KML, Mapbox, Bing, WMS, and more.

With the ArcGIS integration, you can easily access all layers and details from your ArcGIS server and display them within IVAAP to enrich map-based search of well, seismic, and other subsurface data.

New features include the ability to display a dynamic metadata table for a selected object in the map (Well, Seismic, etc.). 

Most layers are supported. Image services (ArcGIS Image Service Layer, Image Services Vector Layers, and WMS) and Tile services (Image Service, ArcGIS Tiled Map Service Layer, Web Tiled Layer, OpenStreetMap) are supported. Feature Services include map service (ArcGIS Feature Layer), KML, WFS, and CSV. We also provide some real-time services support like stream services (ArcGIS Stream Layer), GeoRSS, Vector Tiles (VectorTileLayer), and Bing Maps services. Two extra formats that are supported are GeoJSON and GPX.

This release includes improved search capabilities allowing search across any metadata for any user. Access to data can be restricted to read-only mode. We also made improvements to fence highlighting and access to well lists, and labels can now be saved with the dashboard.


2_7_0_Map Reduced


More Themes Control 

Previously, theme control within IVAAP was a bit limited. We’ve expanded the theme mechanism to all widgets so that users can customize themes with more control and options and access new updated themes.


2_7_0_Customized Themes

Lightmode theme


New Image Widget 

IVAAP can now display simple image files such as jpeg or png files in the image widget, align, and zoom in to show detail. This feature allows users to customize dashboards with logos or other image files needed to display. 

Improvements in 3D

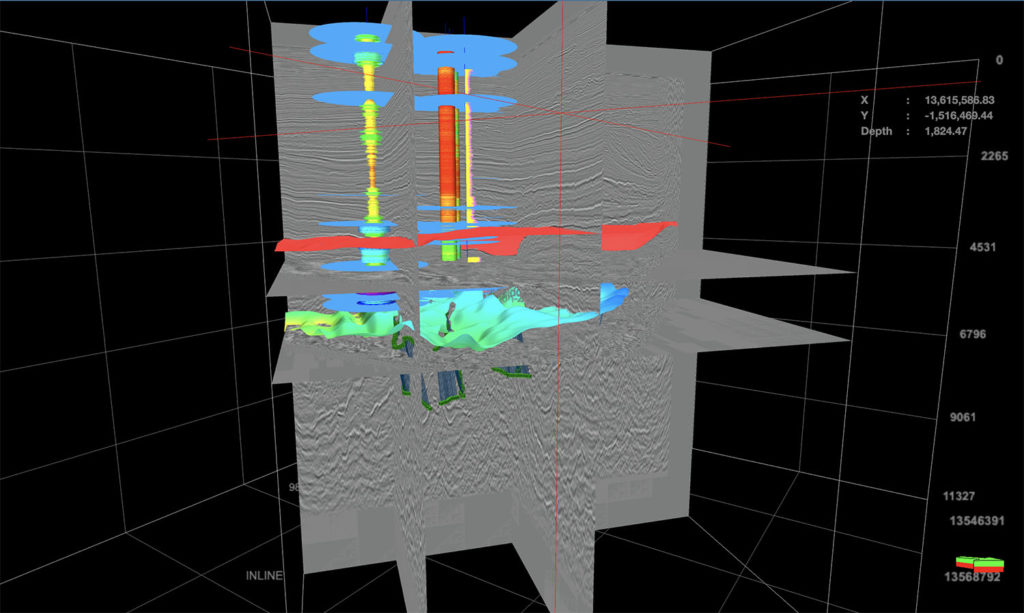
IVAAP’s 3D widget now supports tagging and aliases when displaying well data. We added reservoir data that can be serialized in the dashboard template. Users now have the ability to mix data with CRS and data without CRS. Another new feature is that users can apply properties to multiple or individual objects. And we’ve improved the dashboard restoration of multiple inlines, crossbones, and time slices. Finally, the 3D widget filter dialog has been redesigned.


2_7_0_3D Reduced


New Features in WellLog

For WellLog, we improved the set main index support for templates, dashboards, and well switching. With this improvement, a secondary index can be used to display data into a different index and secondary indexes can be restored when opening an existing dashboard or template. An improved automatic logarithmic mode gives users the ability to add a curve to a logarithmic track. New features added to WellLog include: the ability to automatically rotate labels for lithology and a reset action where users can right-click with the option to clear their display.


WellLog


New in Schematics

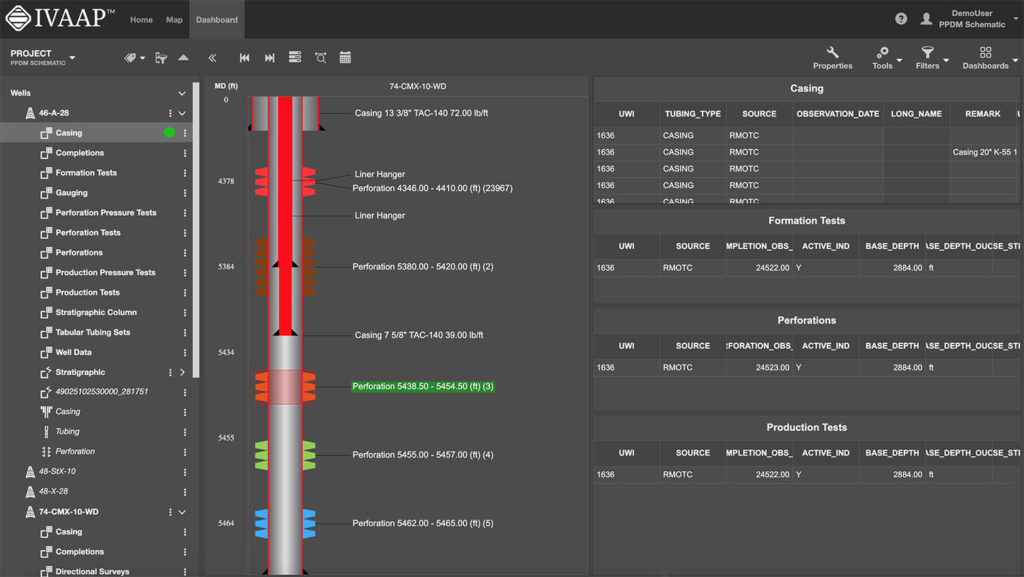
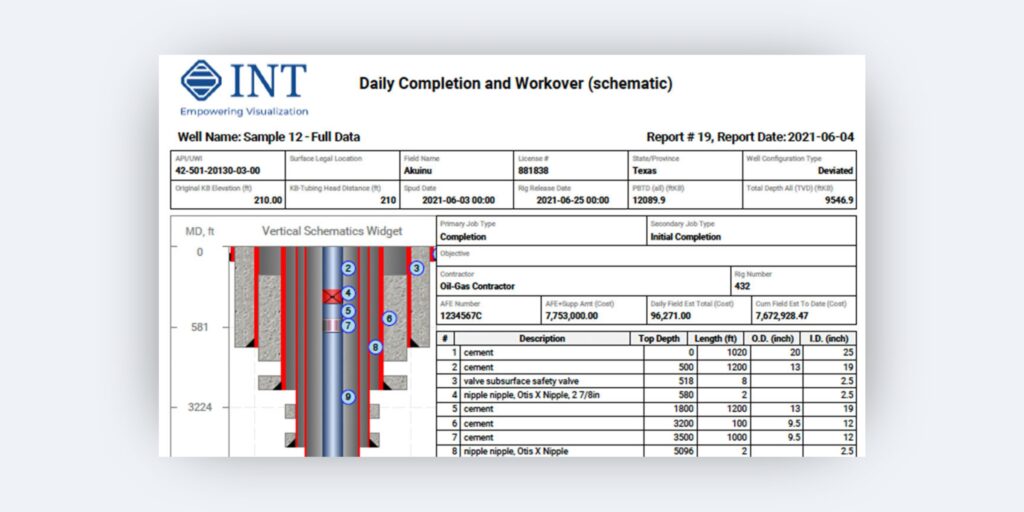
For the Schematics package, new features include: perforation with state definition support, the ability to customize by using a filter dialog, and the ability to use cursor tracking between Schematics and WellLog. We also improved the component selection support in the Schematics widget.


schematics 2.7


Time Series: Annotations and Perforations 

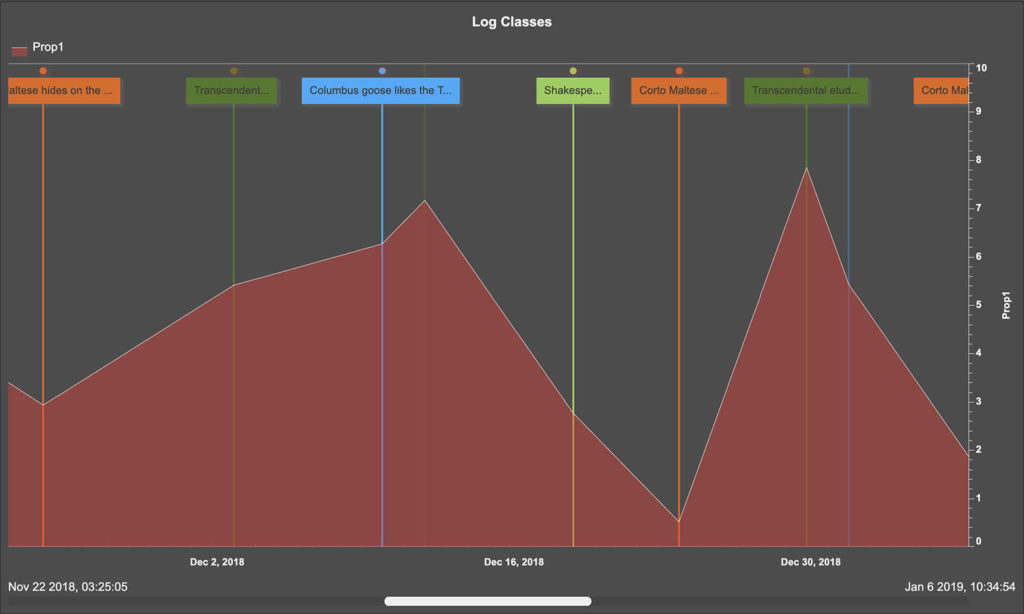
We improved the ability to select a data series from the legend. The Time Series widget now features support for annotations and perforations. The tooltip now shows the index data and time.


TimeSeries


New and Improved Line Chart

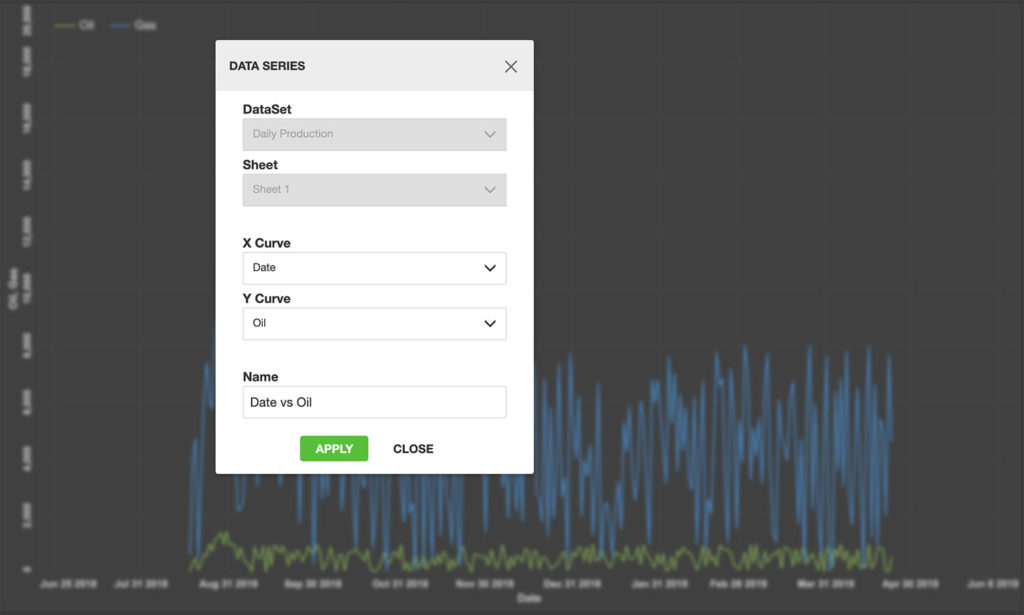
The IVAAP line chart now supports templates and data series dialog. We improved the ability to edit existing data series. Users can now flip the axis for date and time data, and the legend has been improved to show or hide the data series parent. There is also an improvement for single data sets, multi-data sets, and multi parent projects. 


LineChart


This release includes many more improvements to features and to the UI. For more information, check out the full release here.

Or check out int.com/ivaap for a preview of IVAAP or for more information about INT’s other data visualization products, please visit int.flywheelstaging.com or contact us at intinfo@int.com.


Filed Under: IVAAP, Uncategorized Tagged With: 3D, annotations, arcgis, CRS, ivaap, line chart, mapping, schematics, time series, welllog

Footer

Solutions

  • Real-Time Visualization
  • Visualization Components
  • New Energy Visualization
  • OSDU Visualization
  • Machine Learning
  • Developer Tools
  • Cloud Partners
  • Customer Success Stories

Products

  • IVAAP
  • GeoToolkit
  • INTViewer
  • IVAAP Demos
  • GeoToolkit Demos

About

  • News
  • Events
  • Careers
  • Management Team

Resources

  • Blog
  • FAQ

Support

  • JIRA
  • Developer Community

Contact

INT logo
© 1989–2024 Interactive Network Technologies, Inc.
Privacy Policy
  • Careers
  • Contact Us
  • Search

COPYRIGHT © 2025 INTERACTIVE NETWORK TECHNOLOGIES, Inc