• Skip to main content
  • Skip to footer

INT

Empowering Visualization

COMMUNITY BLOG
CONTACT US SUPPORT
MENUMENU
  • Solutions
    • Overview
    • Real-Time Visualization
    • Visualization Components
    • New Energy Visualization
    • OSDU Visualization
    • Machine Learning
    • Developer Tools
    • Cloud Partners
  • Products
    • IVAAP™
          • SOLUTIONS

            Real-Time Visualization

            OSDU Visualization

            Visualization Components

            New Energy Visualization

            Upstream Data Visualization

          • SUCCESS STORIES

            WEATHERFORD
            Well delivery optimization software

            BARDASZ
            Data management, data quality monitoring

            ANPG / SATEC-MIAPIA
            Virtual data room

            MAILLANCE
            High-performance visualization of ML algorithms

            SEE ALL >

          • SUPPORT

            DEVELOPER COMMUNITY
            Join or log in to the INT Developer Community.

            GET SUPPORT
            Log a ticket for an issue or bug.

            CONTACT US

          • DEMOS

            IVAAP DEMOS
            Cloud-Based Demos

            FIRST TIME HERE?
            Register to access our
            IVAAP demos

    • GeoToolkit™
          • SUCCESS STORIES

            CAYROS
            Field development planning

            TOTALENERGIES
            High-performance large dataset reservoir rendering

            IFP ENERGIES NOUVELLES
            Seismic and structural interpretation validation

            SEE ALL >

          • SUPPORT

            DEVELOPER COMMUNITY
            Join or log in to the INT Developer Community.

            GET SUPPORT
            Log a ticket for an issue or bug.

            CONTACT US

          • DEMOS

            GEOTOOLKIT DEMOS
            Geoscience Demos

    • INTViewer™
          • SUCCESS STORIES

            STRYDE
            Fast seismic QA/QC in the field

            SILVERTHORNE SEISMIC
            Efficient 2D/3D seismic data delivery

            WIRELESS SEISMIC
            Drones, IoT, and Advanced Onsite Seismic Data Validation

            SEE ALL >

          • SUPPORT

            GET SUPPORT
            Log a ticket for an issue or bug.

            CONTACT US

          • PLUG-INS

            EXTEND INTVIEWER
            More than 65 plugins available

  • Demos
    • GeoToolkit Demos
    • IVAAP Demos
  • Success Stories
  • Resources
    • Blog
    • Developer Community
    • FAQ
    • INT Resources Library
  • About
    • Overview
    • News
    • Events
    • Careers
    • Meet Our Team
    • About INT

seismic

Apr 18 2024

Celebrating a Decade of Innovation: GeoToolkit.JS Marks 10 Years of Empowering Subsurface Data Visualization

In the realm of subsurface data visualization, the 10th anniversary of GeoToolkit.JS marks a significant milestone. What began as a comprehensive set of high-performance tools and libraries has evolved into an indispensable resource for developers seeking to craft advanced, domain-specific software efficiently.

GeoToolkit™ encompasses diverse features, catering to the complex needs of developers working with 2D/3D seismic, well log, schematics, contour, maps, charts, and more. Its flexibility allows embedding within energy applications or building from the ground up, facilitating swift and precise development. Also, integrating GeoToolkit.JS data visualization libraries within the oil and gas industry is a game-changer for the end user—be it a geoscientist, an engineer, or a decision-maker. These individuals rely on accurate, comprehensive insights derived from complex subsurface data.

This anniversary is not just a celebration of a decade but a commemoration of more than 30 years of GeoToolkit’s presence in the industry, with versions spanning .NET, Java, JavaScript / TypeScript, and C++. Over this period, GeoToolkit has continuously evolved, refining its capabilities and pushing the boundaries of subsurface data visualization.

The journey of GeoToolkit has been paved with remarkable achievements. Its key benefits include support for various subsurface data formats like LAS, DLIS, WITSML, SEG-Y, SEG-D, and more in some versions of GeoToolkit. Moreover, it provides robust technical support, extensive online documentation, and a thriving Developer Community, fostering collaboration and knowledge exchange.

GeoToolkit’s high-performance tools and libraries stand out for their plug-and-play nature. With just a single line of code, developers can deploy these tools or use them as the foundation for crafting custom applications, significantly expediting time-to-market.

The extensive capabilities of GeoToolkit cover a broad spectrum of functionalities, from 3D seismic and reservoir data visualization using WebGL technology to 2D scatter plots for comparison, well log displays that can correlate thousands of wells, and the creation of PDF reports with multiple widgets for streamlined log header construction.

Furthermore, its extensive volume rendering capability facilitates high-quality visualizations of massive datasets, enabling seamless visualization of billions of cells. GeoToolkit also boasts robust support for diverse map layers, such as Google, ESRI, Bing Maps, ArcGIS GeoServices, OpenStreetMap, and more, making it an invaluable asset for comprehensive geospatial applications.

Here’s a glimpse of the evolution of GeoToolkit.JS showcasing its transformative capabilities:

Report Builder

Build PDF reports with multiple widgets, including custom log headers, with template saving and printing for efficient creation and sharing.

Report Builder- pic

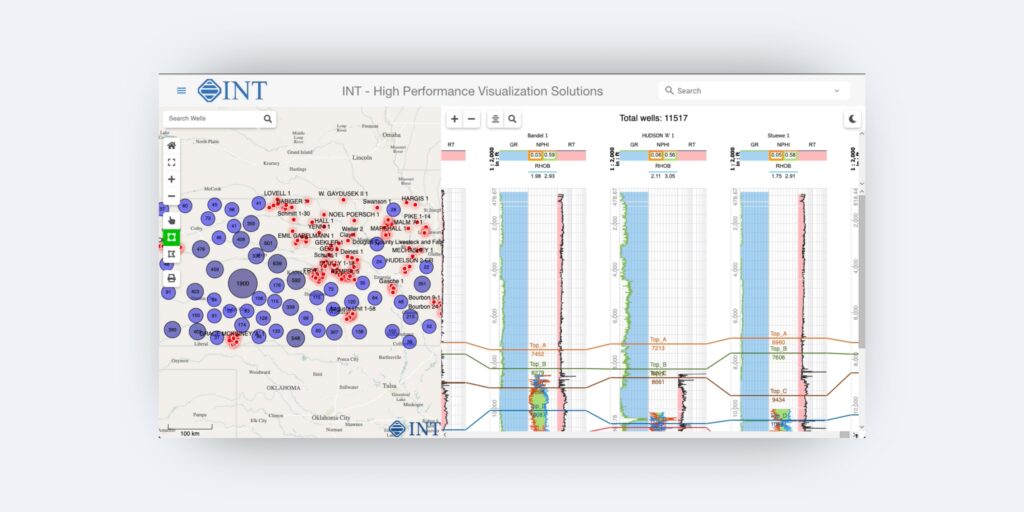
Well Log Correlation

Correlate thousands of wells effortlessly with well log displays, streamlining your analysis.

Well log correlation – pic

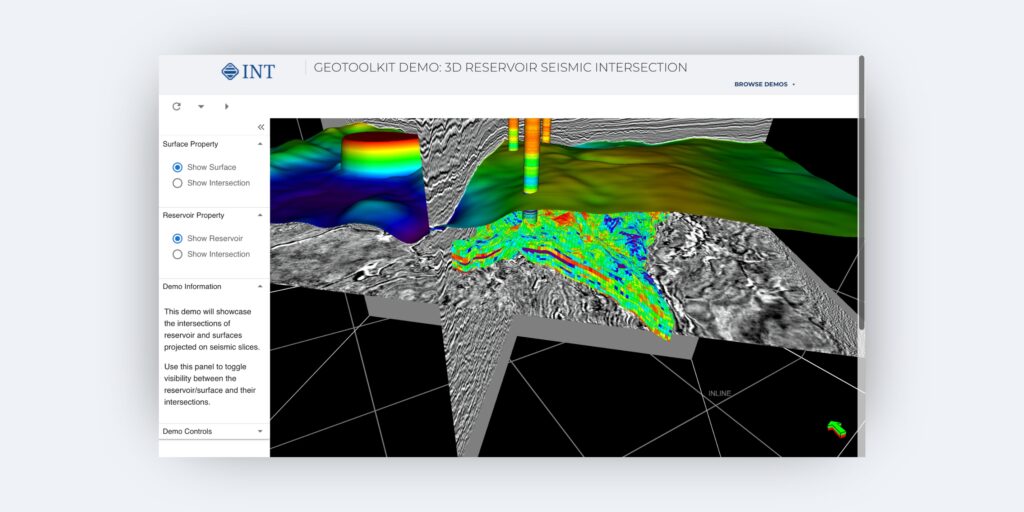
3D Reservoir Seismic Intersection

Intersect your 3D reservoir grid with seismic data and add well logs, horizons, and more.

3D Reservoir Seismic Intersection – pic

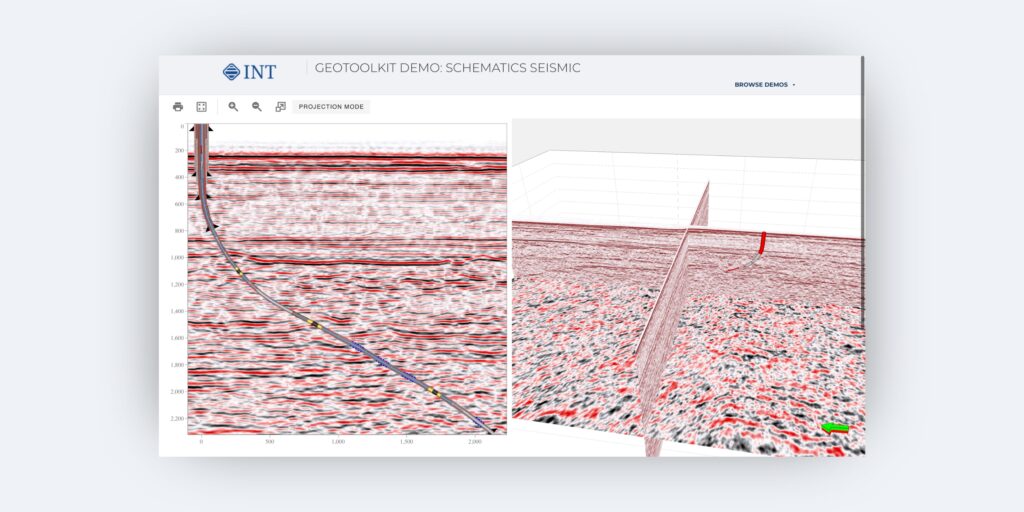
Schematics Seismic

Combining wellbore architecture with seismic profiles, this tool allows you to identify zones of interest in relation to each hole section and cementing sections versus formations crossed.

Schematics Seismic – pic

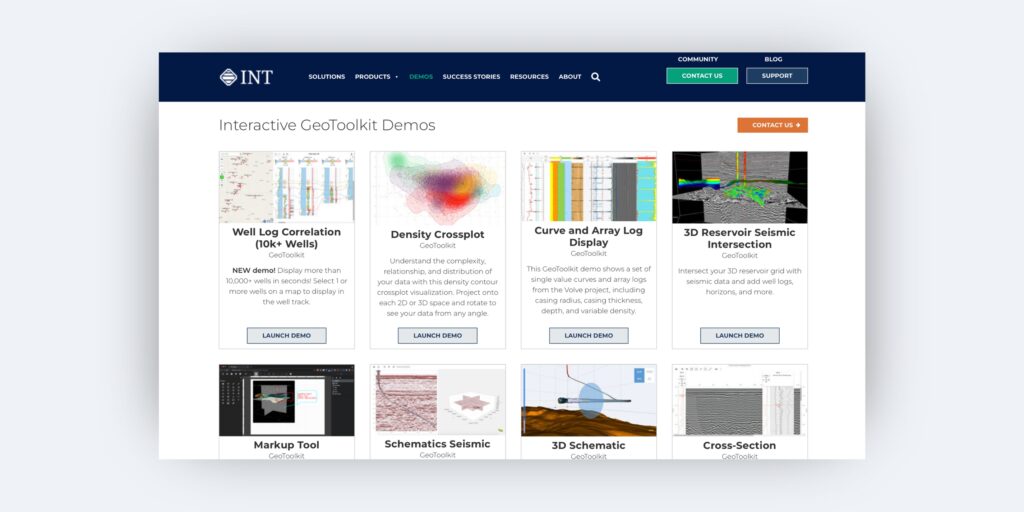
GeoToolkit Demo Gallery

Dive deeper and experience the transformative capabilities of GeoToolkit with our Interactive GeoToolkit Demos.

GeoToolkit Demo Gallery – pic


“Without INT’s GeoToolkit, we wouldn’t be where we are right now with C-Fields. We have high expectations that this tool will become the standard in Field Development planning and that we will be able to accomplish a lot with this tool. There’s nothing in the market like C-Fields right now.”

—Francisco Caycedo, Regional Director Latin America, CAYROS


However, amidst this celebration, expressing our deepest gratitude is crucial. To every individual involved in the development of GeoToolkit, your dedication, expertise, and unwavering commitment have been the cornerstone of our success. Your collective efforts have driven innovation, shaped the product, and paved the way for a decade of groundbreaking achievements.

To our clients, we extend our heartfelt thanks. Your trust, partnership, and continuous support have been the driving force behind GeoToolkit’s evolution. 

The 10th anniversary of GeoToolkit.JS showcases innovation and an unwavering commitment to empowering developers in the intricate landscape of subsurface data visualization. Here’s to a decade of achievements and many more years of pioneering advancements in the field.

To learn more about GeoToolkit.JS, please visit int.com/products/geotoolkit/ or contact us at intinfo@int.com.

Explore our Interactive GeoToolkit Demos
Request a 30-day trial
Filed Under: GeoToolkit, JavaScript Tagged With: .JS, .net, ArcGIS GeoServices, Bing maps, C++, DLIS, ESRI, java, javascript, LAS, OpenStreetMap, schematics, SEGD, segy, seismic, welllog, WITSML

Apr 11 2024

INT Supports OpenZGY and OpenVDS to Enhance Workflows and Data Collaboration

In the world of geospatial analytics and subsurface interpretation, streamlined access to vast seismic datasets is crucial. The rise of the Open Subsurface Data Universe™ (OSDU™) has propelled the development of innovative formats like OpenZGY and OpenVDS, designed to optimize seismic data storage and retrieval. As an active member of OSDU™, INT is committed to empowering our users with cutting-edge tools, which is why we’ve seamlessly integrated support for these essential OSDU formats within our platform.

The Limitations of Traditional Seismic Data Formats

As we explore deeper and more complex geological structures, the amount of seismic data collected continues to skyrocket. Unfortunately, traditional seismic data formats, such as SEG-Y, often struggle to handle this ever-growing volume effectively. These formats typically store data in a linear fashion, leading to several limitations: slow access times, limited scalability, and interoperability issues.

The OpenZGY and OpenVDS Revolution

OpenVDS and OpenZGY represent a revolutionary approach to seismic data storage and retrieval, addressing the limitations of traditional formats. Here’s how they transform data handling:

  • Superior Performance: These formats organize data into “bricks” and further into “micro-bricks,” enabling lightning-fast access in all directions (inline, crossline, and Z-slice). Projects utilizing OpenZGY and OpenVDS benefit from unparalleled responsiveness.
  • Enhanced Collaboration: As OSDU-compliant formats, OpenVDS and OpenZGY foster easy data exchange and knowledge transfer among teams and organizations. This breakdown of data silos leads to more informed decision-making.
  • Cloud Compatibility: OpenZGY and OpenVDS pave the way for seamless cloud integration. Geospatial professionals can leverage scalable cloud storage and processing for large-scale projects.

INT’s Commitment to Open Data Standards

At INT, we are strong advocates of open data standards in the geoscience realm. Our work with and early adoption of the OSDU Data Platform and our integration of OpenVDS and OpenZGY formats exemplify this dedication. Here’s how this benefits our users:

  • Streamlined Workflows: With the superior performance of OpenVDS and OpenZGY, INT users experience accelerated interpretation cycles. Complex analyses and visualization become significantly faster.
  • Data Interoperability: Projects involving various software tools become more effortless. Data can move freely between INT and other OSDU-compliant applications.
  • Future-Proofing: As the industry continues to embrace OSDU, INT ensures our users are well-positioned to take advantage of the evolving data landscape.

Leveraging INT with OpenZGY and OpenVDS

INT’s powerful visualization platform — IVAAP — offers numerous use cases for datasets stored in OpenVDS and OpenZGY formats:

  • Rapid Survey Evaluation: Quickly visualize and assess seismic surveys for quality control and planning purposes.
  • Efficient Attribute Generation: Accelerate attribute calculation and analysis on these optimized data structures.
  • Collaborative Interpretation Workflows: Share insights and seamlessly merge interpretations from location-dispersed team members working with OSDU-compliant data.

The Road Ahead

INT is actively engaged in the ongoing development of the OSDU platform. We’re dedicated to extending our support for OpenZGY and OpenVDS and other emerging data formats within the OSDU ecosystem. By continuing to optimize our platform for cutting-edge data standards, we strive to provide our users with industry-leading tools for unlocking valuable insights.

If you’re ready to propel your geospatial workflows with the power of OpenZGY, OpenVDS, and INT, don’t hesitate to contact us. Explore how our tailored solutions and commitment to open data can transform your subsurface visualization.


Filed Under: IVAAP Tagged With: ivaap, openVDS, openzgy, OSDU, seismic

Jan 07 2022

INT Advances IVAAP as Universal Subsurface Cloud Viewer with Full OSDU™ Data Platform Support

Empower energy users’ experience by embedding advanced subsurface data visualization with your data science in your digital solutions.

INT, a leading provider of data visualization software, just announced the newest version of their universal subsurface visualization and analytics application platform, IVAAP™. Offering full OSDU Data Platform support, IVAAP 2.9 enables exploration, visualization, and computation of energy data. The new release also expands IVAAP’s map-based search, data discovery, and data selection with 3D seismic volume intersection, 2D seismic overlays, reservoir, and basemap widgets to visualize all energy data types in the cloud.

As an OSDU-native application, IVAAP can accelerate the integration between the OSDU Data Platform and other EDM platforms. For example, INT recently partnered with Halliburton Landmark to demonstrate the power of interoperability between systems — linking IVAAP to Landmark EDM through the OSDU Data Platform on AWS. 

A major new feature of IVAAP is its integration capabilities with processing or machine learning services. This new capability was added in response to many energy companies who had many algorithms and models in various programs — Python, TensorFlow, Jupyter notebooks, to name a few — spread across the organization and were faced with the challenge to share them and make them accessible in other apps. With this new capability, IVAAP accelerates workflow integration and simplifies Machine Learning Operations (MLOps). 


“We’ve been working to fully integrate new features in IVAAP that can streamline user workflows, reducing time to decision and empowering users with data visualization to help them to collaborate, make strong, accurate business decisions, and otherwise improve their ability to work with subsurface data for energy,” said Olivier Lhemann, president of INT. “With this release, we bring that full circle — users can now access their data using the power of the OSDU Data Platform, perform machine learning and processing models, and visualize the results.”


IVAAP’s workflow integration opens up a brand new user experience where now data scientists, modelers, geophysicists, and data managers can search data in the cloud, select data of interest, and launch computation from a single platform. IVAAP is providing new ways for operators, services, and energy technology software providers to enrich their digital solutions with powerful visualization and integration capabilities to OSDU Data Platform and machine learning for further automation. 

Learn more about IVAAP at int.com/ivaap.

For more information, please visit int.flywheelstaging.com or contact us at intinfo@int.com.


Filed Under: IVAAP Tagged With: 3D, basemap, ivaap, machine learning, ml, OSDU, seismic, workflows

Apr 15 2021

INT to leverage IBM, Red Hat Open Technologies to Enhance Efficiencies in Oil & Gas Exploration and Drilling Workflows

The latest version of INT’s data visualization platform, IVAAP, integrates with IBM Open Data for Industries, IBM’s hybrid cloud implementation of the Open Group OSDU data.

HOUSTON, TX — April 15, 2021 — INT today announced that IVAAP — a leading enterprise subsurface data visualization platform — integrates with IBM Open Data for Industries for Cloud Pak for Data built on Red Hat OpenShift. These open technologies will enable the upstream industry to visualize exploration and drilling data across hybrid cloud environments to drive efficiencies and speed decision making.

As the oil and gas industry undergoes unparalleled transformation, members of the value chain are seeking solutions to maximize digital opportunities across their operations. Data is a critical asset and when leveraged with artificial intelligence, can yield mission-critical insights and competitive advantage.  However, quite often, domain-specific data exists in silos — limiting workflow efficiencies that leverage data insights for real-time decision-making.

Today’s announcement focuses on open technologies for the IVAAP platform that remove these barriers:

  • IVAAP leverages IBM Open Data for Industries for IBM Cloud Pak for Data, a data platform enabling seamless integration of data sources with the flexibility to deploy across any infrastructure that leverages The Open Group OSDU Forum data standard. The Open Group OSDU Forum is an industry organization that brings together technology leaders, producers and members of the oil and gas value chain to build a data foundation based on data standards making subsurface data easier to find, combine, and use across geoscience workflows.
  • IVAAP integrates with IBM Open Data for Industries for IBM Cloud Pak for Data powered by Red Hat OpenShift, the industry’s leading open source Kubernetes platform. This will enable INT customers to run IVAAP on-premise, unlocking speed and agility for local operations as well as remote locations through the cloud, yet all with one consistent architecture. This provides upstream operators greater value and flexibility for real-time operational decision-making, as well as consistency to the enterprise operations.

“We are extremely excited about the work we are engaging in with The Open Group OSDUTM Forum and our collaboration with IBM. For clients who manage hybrid cloud environments, our goal is to bring the technology to where they need it — in the cloud and in their locally hosted environment.”

— Olivier Lhemann, President of INT.


“Our collaboration with INT enables choice and flexibility in deploying subsurface data visualization across hybrid cloud environments. By leveraging IBM Open Data for Industries for IBM Cloud Pak for Data, INT and the oil and gas community can leverage an enterprise-grade, open-source platform based on the OSDU data foundation, improving access to subsurface data across any infrastructure, including public cloud, local country cloud and on-prem,” says Dariusz Piotrowski, Global Solutions Leader,
IBM Industrial Sector.

IVAAP is a sophisticated domain visualization and analytics platform that provides central access to data regardless of where it is — stored in the cloud and on-premise. Users can access, view, search, visualize, and analyze their subsurface data — wellbore, seismic, schematics, log, and more — in a web browser.

About INT:

INT software empowers the largest Oil & Gas (IOC/NOC) and services companies in the world to visualize their complex subsurface data (seismic, well log, reservoir, and schematics in 2D/3D). INT offers a visualization platform (IVAAP) and libraries (GeoToolkit) developers can use with their data ecosystem to deliver subsurface solutions (Exploration, Drilling, Production). INT’s powerful HTML5/JavaScript technology can be used for data aggregation, API services, high-performance visualization of G&G and petrophysical data in a browser. INT simplifies complex subsurface data visualization.

Read the press release on PRWeb.

For more information about IVAAP or INT’s other data visualization products, please visit https://int.flywheelstaging.com.

INT, the INT logo, and IVAAP are trademarks of Interactive Network Technologies, Inc., in the United States and/or other countries.

Red Hat, the Red Hat logo and OpenShift are trademarks or registered trademarks of Red Hat, Inc. or its subsidiaries in the U.S. and other countries.


Filed Under: IVAAP, Press Release Tagged With: IBM, ivaap, log, OSDU, schematics, seismic, subsurface data visualization, wellbore

Apr 08 2021

Extended Well Data: How to Use the New Well Data Structure in INTViewer 2021

LAS format is the industry-standard format to store and exchange well log curve data. Despite its simplicity and usability, it has some strong limitations: log curves must have the same Z sampling for instance.

The latest INTViewer 2021 introduces a new well data structure, the Extended Well Data (EWD). Like the existing well data based on LAS files, EWD can be displayed in the Well Log Window. They can be displayed in Map views, 3D, and seismic viewers as well (provided the trajectory is well defined). 

This new format allows more complex edition operation, heterogeneous log curves in the same well data, and a new time/depth conversion process. 

Synthesis Window

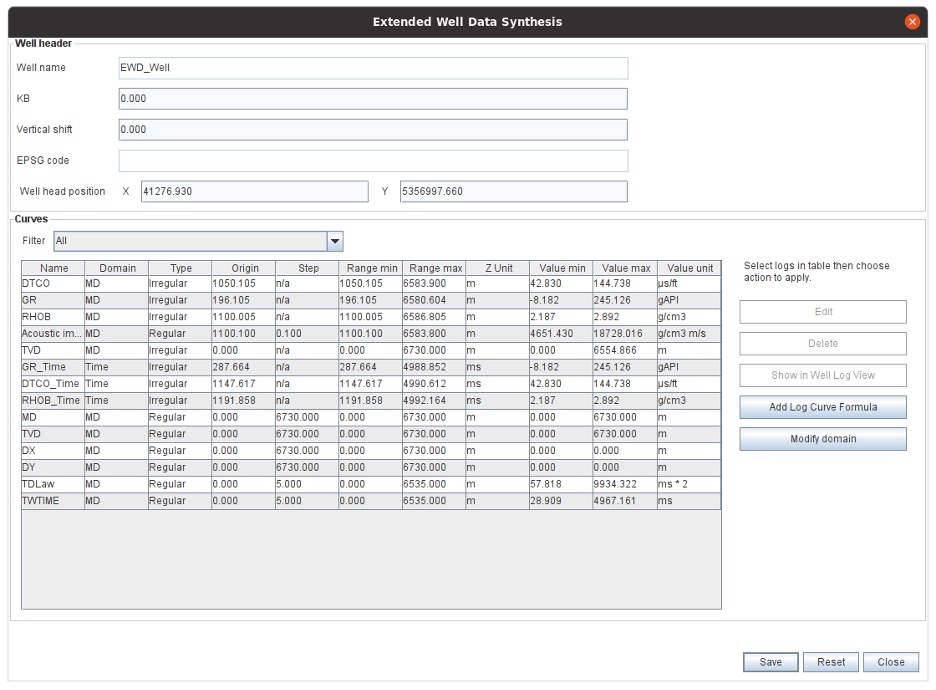
The EWD structure allows more flexibility in log and well edition. The EWD Synthesis window exhibits all logs and well metadata.

Extended Well Data Synthesis

On this window some actions are available:

  • Metadata edition
  • Add curves with formula
  • Remove curves
  • Open Well Log Window with selected curves

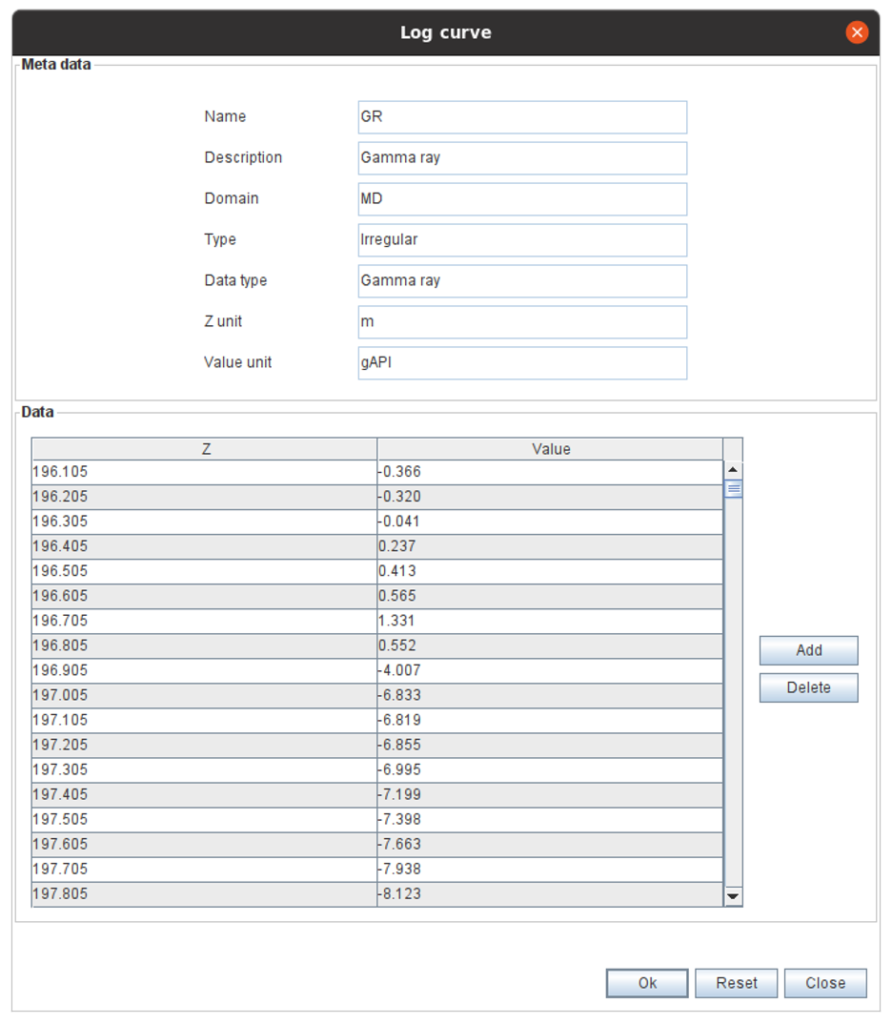
Curve data can be edited using the Log Curve editor.

log-curve

Z and values can be edited, samples can be added or removed, and data can be copied in an external spreadsheet, then pasted back in the editor after modification.

Contrary to standard LAS data, EWD allows log curves to have heterogeneous Z columns, and various samples count. Each log curve can then be edited individually without affecting other curves sampling.

To learn more about how to edit wells in INTViewer, check out our video tutorial:


Log Curve Formula

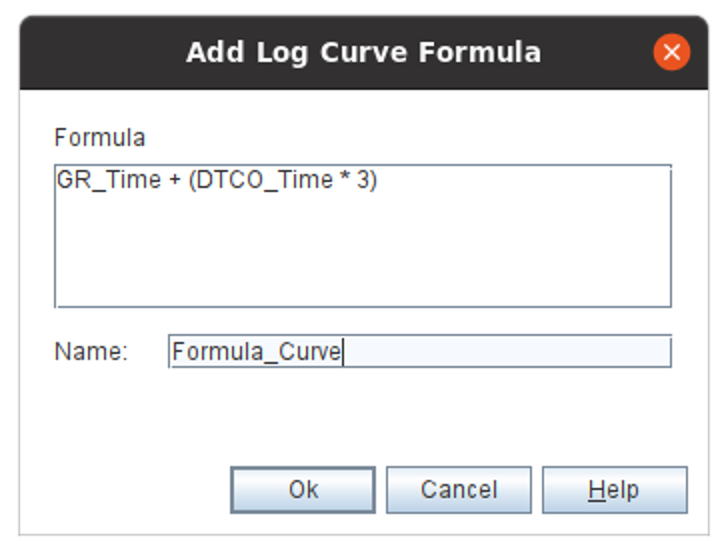
Like with standard LAS-based well data, curves can be added using a formula. Since log curves can have different Z units, users will be forbidden to mix time and depth curves using formulas.

Log Curve Formula

Since curves can be edited individually and have different sampling, the result curve, and all other curves used as input, will be resampled to the sampling of the first data found in the formula (in the image above GR_Time will be used).

Formula editor can be started from the main synthesis window, and also from the popup menu on the EWD node.

Time / Depth Conversion

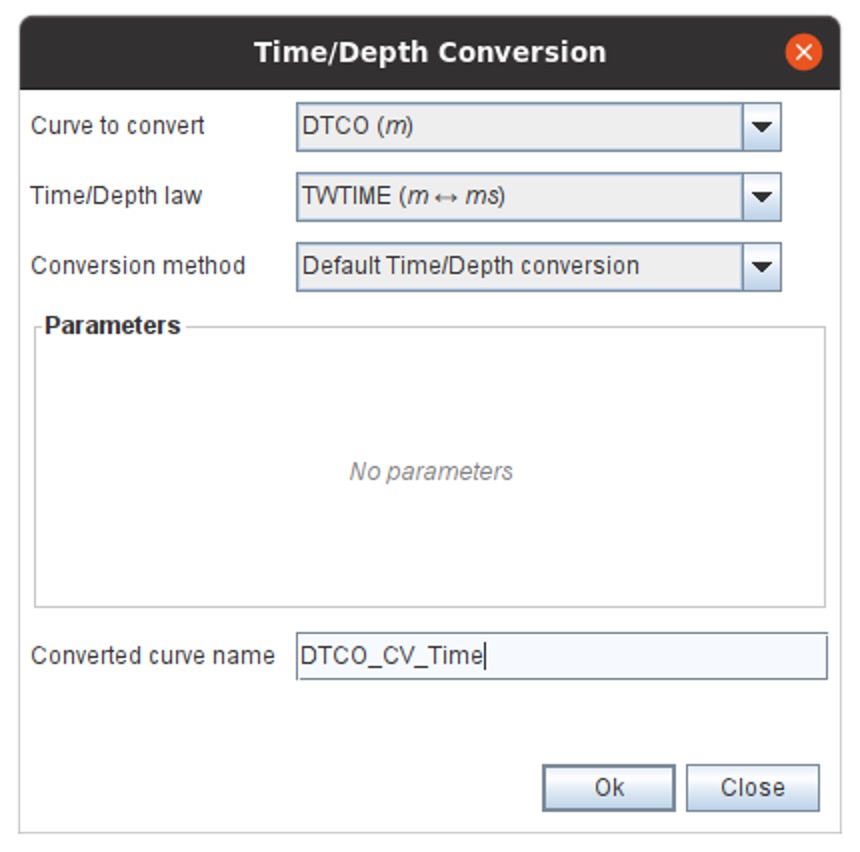
By defining a curve as Time / Depth law (typically a curve that will have time or depth unit for data values, and opposite unit for Z values), EWD offers the ability to perform Time/Depth conversion. A simple editor to choose the data to convert and the law to use is opened when Time Depth conversion action is launched:

Time Depth Conversion


Time / Depth conversion can be performed on logs, but also on Markers. The EWD format can hold several Markers set, each having time or depth unit.

markers


Time/Depth conversion action can be found on the main EWD synthesis window, but it’s also available from the EWD contextual menu in Well Log Window.

The Time/Depth conversion process is a simple sample-by-sample linear interpolation using the Time/Depth law as reference. A more complex process, eventually with parameters, can be added with customization.

LAS Import/Export

EWD can be created from LAS files and exported to LAS files after edition. LAS data can then be imported as EWD in INTViewer 2021. Users can perform various editions, time/depth conversion, and other actions, then export the result in standard LAS to use the data outside INTViewer 2021. 

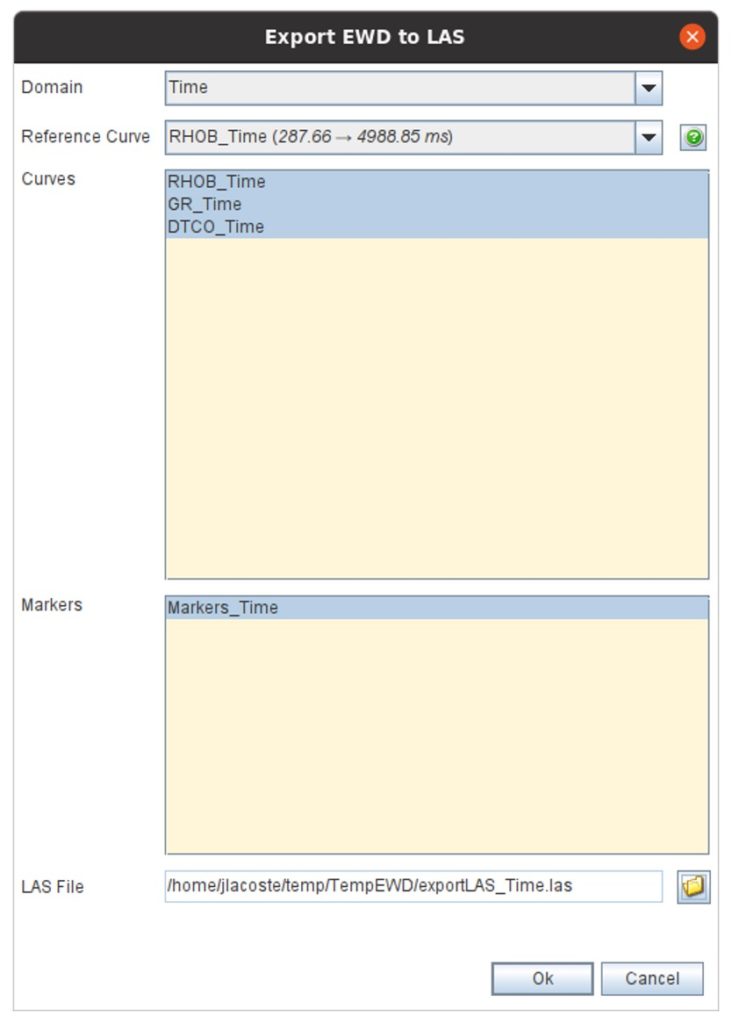
Export EWD to LAS

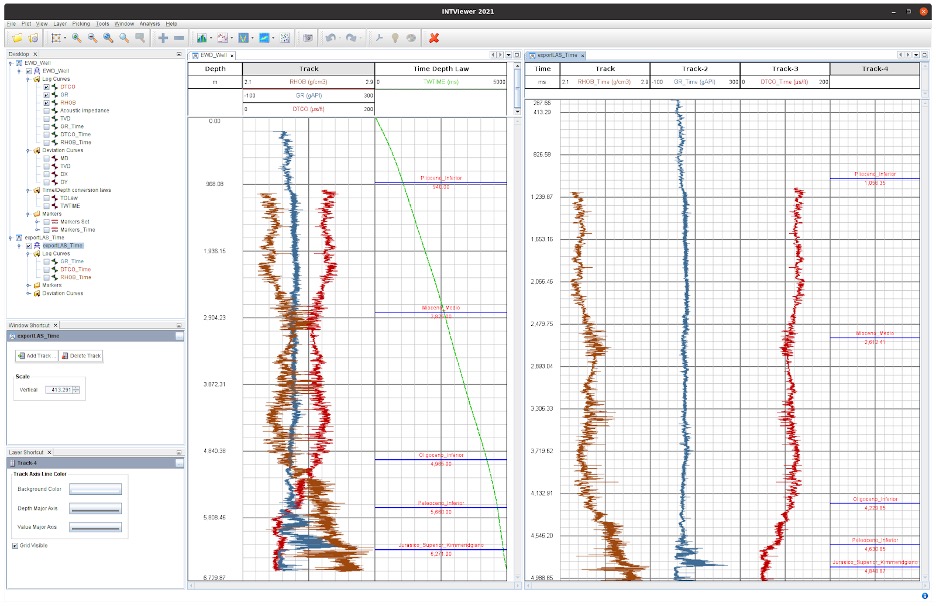
When exporting to LAS, the data domain must be specified (a LAS can only contain data sharing the same Z unit). Users can also choose which data to export. The following screenshot shows an EWD data and the exported LAS side by side. 

In the EWD view log curves and markers are in depth, the time depth law is displayed in green. Converted and exported data are in time.

INTViewer 2021 SS

Users have the choice with EWD to display or not in the same view time and depth data. 

Customization

The Extended Well Data GUIs can be customized to offer more specific behaviour to the standard EWD functionalities. So a specific plugin will be able to modify:

  • EWD Synthesis customization 
    • Specific header panel 
    • Custom table filters
    • Custom table control (available units, domain, validation)
  • Time/Depth conversion
    • Conversion process and parameters can be added

For more information on INTViewer, please visit int.flywheelstaging.com/products/intviewer/


Filed Under: INTViewer Tagged With: 3D, Extended Well Data, INTViewer, maps, seismic

  • Page 1
  • Page 2
  • Go to Next Page »

Footer

Solutions

  • Real-Time Visualization
  • Visualization Components
  • New Energy Visualization
  • OSDU Visualization
  • Machine Learning
  • Developer Tools
  • Cloud Partners
  • Customer Success Stories

Products

  • IVAAP
  • GeoToolkit
  • INTViewer
  • IVAAP Demos
  • GeoToolkit Demos

About

  • News
  • Events
  • Careers
  • Management Team

Resources

  • Blog
  • FAQ

Support

  • JIRA
  • Developer Community

Contact

INT logo
© 1989–2024 Interactive Network Technologies, Inc.
Privacy Policy
  • Careers
  • Contact Us
  • Search

COPYRIGHT © 2025 INTERACTIVE NETWORK TECHNOLOGIES, Inc