• Skip to main content
  • Skip to footer

INT

Empowering Visualization

COMMUNITY BLOG
CONTACT US SUPPORT
MENUMENU
  • Solutions
    • Overview
    • Real-Time Visualization
    • Visualization Components
    • New Energy Visualization
    • OSDU Visualization
    • Machine Learning
    • Developer Tools
    • Cloud Partners
  • Products
    • IVAAP™
          • SOLUTIONS

            Real-Time Visualization

            OSDU Visualization

            Visualization Components

            New Energy Visualization

            Upstream Data Visualization

          • SUCCESS STORIES

            WEATHERFORD
            Well delivery optimization software

            BARDASZ
            Data management, data quality monitoring

            ANPG / SATEC-MIAPIA
            Virtual data room

            MAILLANCE
            High-performance visualization of ML algorithms

            SEE ALL >

          • SUPPORT

            DEVELOPER COMMUNITY
            Join or log in to the INT Developer Community.

            GET SUPPORT
            Log a ticket for an issue or bug.

            CONTACT US

          • DEMOS

            IVAAP DEMOS
            Cloud-Based Demos

            FIRST TIME HERE?
            Register to access our
            IVAAP demos

    • GeoToolkit™
          • SUCCESS STORIES

            CAYROS
            Field development planning

            TOTALENERGIES
            High-performance large dataset reservoir rendering

            IFP ENERGIES NOUVELLES
            Seismic and structural interpretation validation

            SEE ALL >

          • SUPPORT

            DEVELOPER COMMUNITY
            Join or log in to the INT Developer Community.

            GET SUPPORT
            Log a ticket for an issue or bug.

            CONTACT US

          • DEMOS

            GEOTOOLKIT DEMOS
            Geoscience Demos

    • INTViewer™
          • SUCCESS STORIES

            STRYDE
            Fast seismic QA/QC in the field

            SILVERTHORNE SEISMIC
            Efficient 2D/3D seismic data delivery

            WIRELESS SEISMIC
            Drones, IoT, and Advanced Onsite Seismic Data Validation

            SEE ALL >

          • SUPPORT

            GET SUPPORT
            Log a ticket for an issue or bug.

            CONTACT US

          • PLUG-INS

            EXTEND INTVIEWER
            More than 65 plugins available

  • Demos
    • GeoToolkit Demos
    • IVAAP Demos
  • Success Stories
  • Resources
    • Blog
    • Developer Community
    • FAQ
    • INT Resources Library
  • About
    • Overview
    • News
    • Events
    • Careers
    • Meet Our Team
    • About INT

seismic

Nov 06 2020

How to Get the Best Performance out of Your Seismic Web Applications

One of the most challenging data management problems faced in the industry is with seismic files. Some oil and gas companies estimate that they acquire a petabyte of data per day or more. Domain knowledge and specific approaches are required to move, access, and visualize that data.

In this blog post, we will dive deep into the details of modern technology that can be useful to achieve speed up. We will also cover: common challenges around seismic visualization, how INT helps solve these challenges with advanced compression and decompression techniques, how INT uses vectorization to speed up compression, and more.

What Is IVAAP?

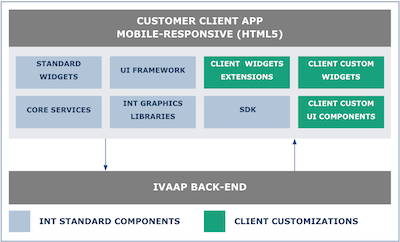
IVAAP is a data visualization platform that accelerates the delivery of cloud-enabled geoscience, drilling, and production solutions.

  • IVAAP Client offers flexible dashboards, 2D & 3D widgets, sessions, and templates
  • IVAAP Server side connects to multiple data sources, integrates with your workflows, and offers real-time services
  • IVAAP Admin client manages user access and projects

Screen Shot 2020-11-04 at 2.37.45 PM


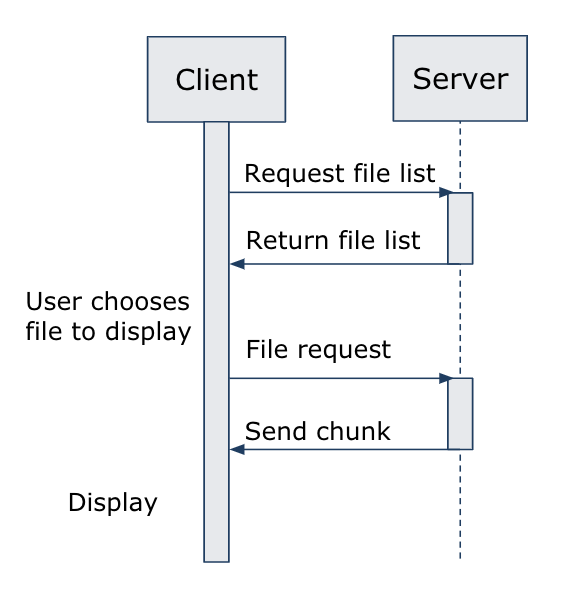
Server – Client Interaction

Interaction occurs when the client requests a file to display from the server, the server returns the file lists, the user chooses a file to display, and then the server starts sending chunks of data while it displays this data.

Screen Shot 2020-11-04 at 2.42.21 PM

Some issues encountered with this scheme include:

  • Seismic data files are huge in size — they can be hundreds of gigabytes or even terabytes.
  • Because of the file size, it takes too much time to transfer files via network.
  • The network can have too much bandwidth.

The goals of this scheme are to:

  • Speed up file transfer time
  • Reduce data size for transfer
  • Add user controls for different network bandwidth

And the solution:

  • We decided to implement server-side compression and client-side decompression. We also decided to provide the client parameter that we call acceptable error level after the seismic data file compression/decompression process.

Screen Shot 2020-11-04 at 2.43.13 PM


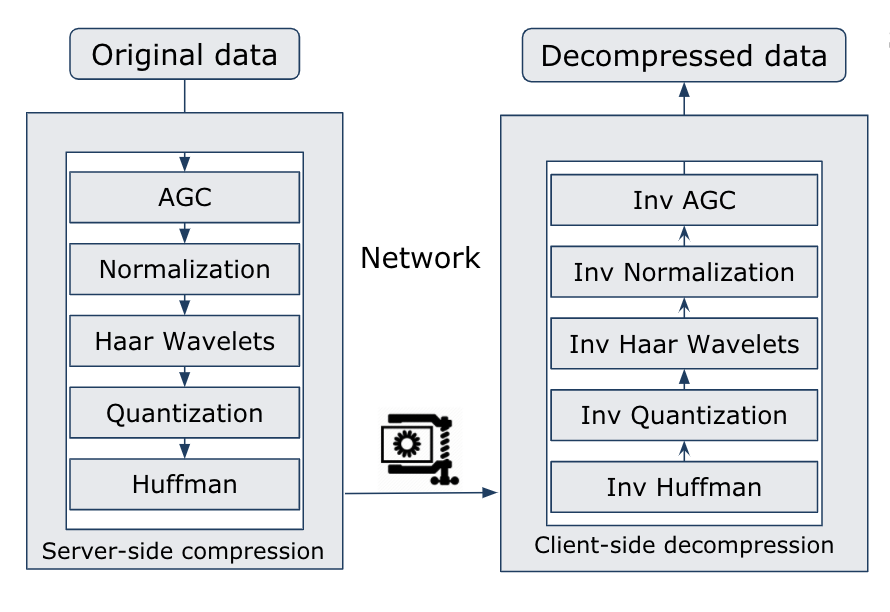
By taking a closer look at compression and decompression data, we can see that the original seismic data goes through a set of five transformations — AGC, Normalization, Hear Wavelets, Quantization, and Huffman. As a result of this transformation, we get a compressed file that can be sent to clients via network. And on the client’s side, there is a decompression process that goes in different directions — from inverse Huffman to inverse AGC. This is the way that clients get original data. It does not get precise, original data. But it gets data after the compression and decompression process. That’s why we added an acceptable error level after the compression and decompression process. This is because we have different scenarios where clients don’t always require the full original data with the full level of precision. For example, sometimes the client only needs to review the seismic data. So using this acceptable error level, they can control how much data will be passed by a network and, of course, speed up this process. 

The resulting scheme looks like this:

Screen Shot 2020-11-04 at 2.44.32 PM


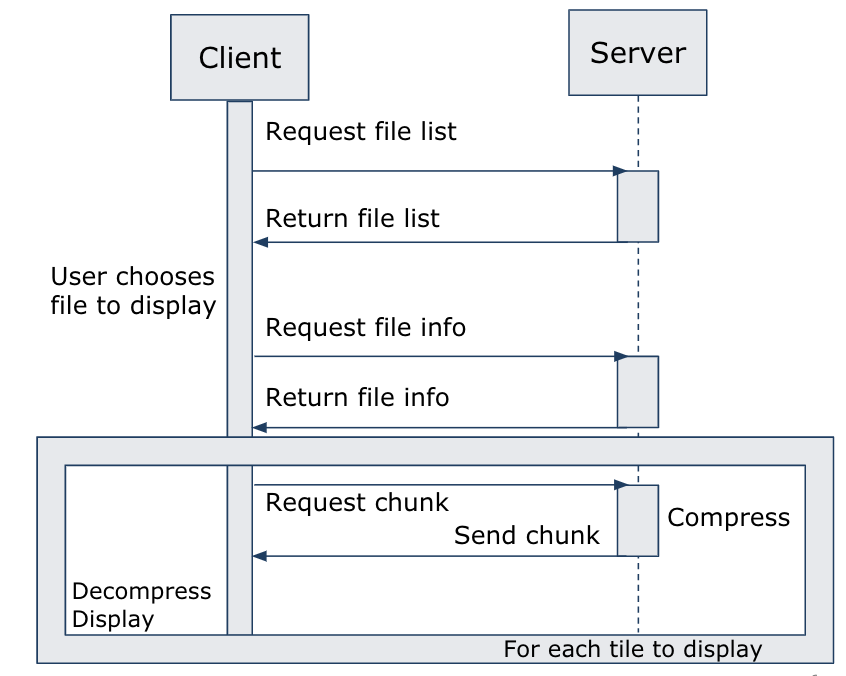
The client requests a file list from the server, the user chooses a file to display, and then the server starts sending the data and compresses it. The server then sends it to the client, the client decompresses, and finally, it displays the data. This is repeated for each tile to display.

So why not use any other existing compression, like GZIP, LZ Deflate, etc.? We tried these compressions, but we found out that this type of compression is not as effective as we’d like it to be on our seismic data.

Server-Side Interaction

The primary objective was to speed up the current implementation of compression and decompression on both the server and client side.

The proposal:

  • Server-side compression is implemented in Java, so we decided to create C++ implementation of compression sequence and use JNI layer to call native methods. For the client-side decompression, we implemented in JavaScript to create C++ implementation of decompression and use WebAssembly (WASM) proposal for integrating C++ code into JS.
  • We implemented both compression and decompression algorithms in C++, but after comparing the results and performance of C++ and Java, we discovered that C++ was just 1.5 times faster than “warmed up JVM”. That’s why we decided to move on and apply SIMD instructions for further speedup.

Single Instruction Multiple Data (SIMD)

Screen Shot 2020-11-04 at 2.51.30 PM

SIMD architecture performs the same operation on multiple data elements in parallel. For Scalar operation, you have to perform four separate calculations to get the right result. For SIMD operations, you apply one vector value calculation to get the correct result.

SIMD benefits:

  • Allows processing of several data values with one single instruction.
  • Much faster computation on predefined computation patterns.

SIMD drawbacks:

  • SIMD operations cannot be used to process multiple data in different ways.
  • SIMD operations can only be applied to predefined processing patterns with independent data handling.

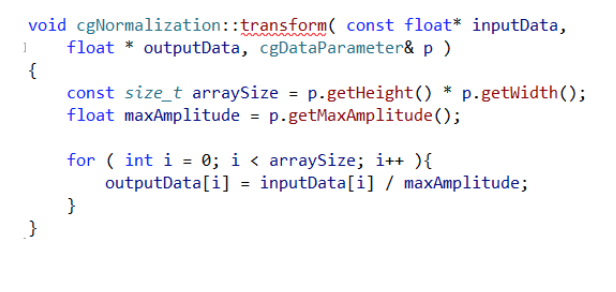
Normalization: C++ scalar implementation

Screen Shot 2020-11-04 at 2.47.45 PM

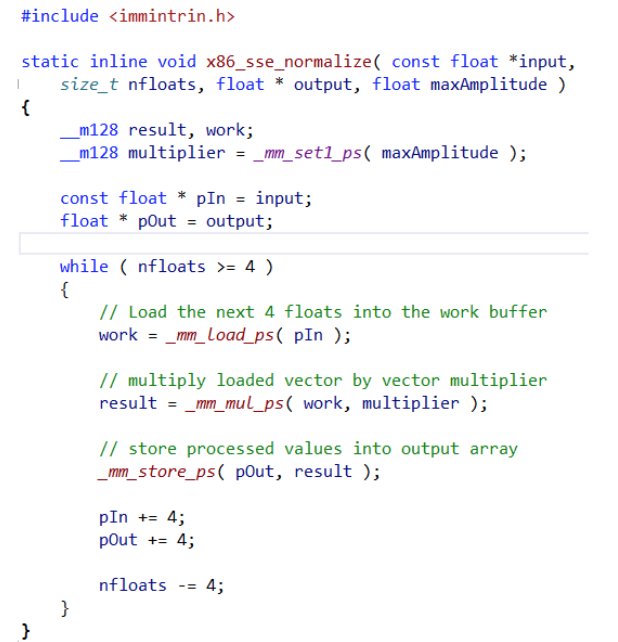
Normalization: C++ SIMD SSE implementation

Screen Shot 2020-11-04 at 2.48.09 PM

Server-Side Speedup Results

There are different types of speedup for different algorithms:

  • Normalization is 9 times faster than the scalar C++ version
  • Haar Wavelets is 6 times faster than the scalar C++ version
  • Huffman has no performance increase (not vectorizable algorithm)

Overall, the server-side compression performance improvement is around 3 times faster than the Java version. This is applying SIMD C++ code. This was good for us, so we decided to move on to the client-side speedup.

Client-Side Speedup

For the client-side speedup, we implemented decompression algorithms in C++ and used WASM to integrate the C++ code in JavaScript.

WebAssembly

WASM is:

  • A binary executable format that can run in browsers
  • A low-level virtual machine
  • A high-level language compile result

WASM is not: 

  • A programming language
  • Connected to the web and cannot be run outside the web

Steps to get WASM working:

Screen Shot 2020-11-04 at 2.48.28 PM

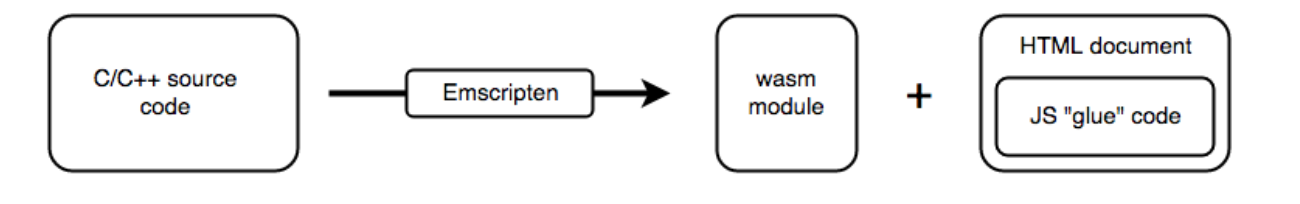
  • Compile C/C++ code with Emscripten to obtain a WASM binary
  • Bind WASM binary to the page using a JavaScript “glue code” 
  • Run app and let the browser instantiate the WASM module, the memory, and the table of references. Once that is done, the WebApp is fully operative. 

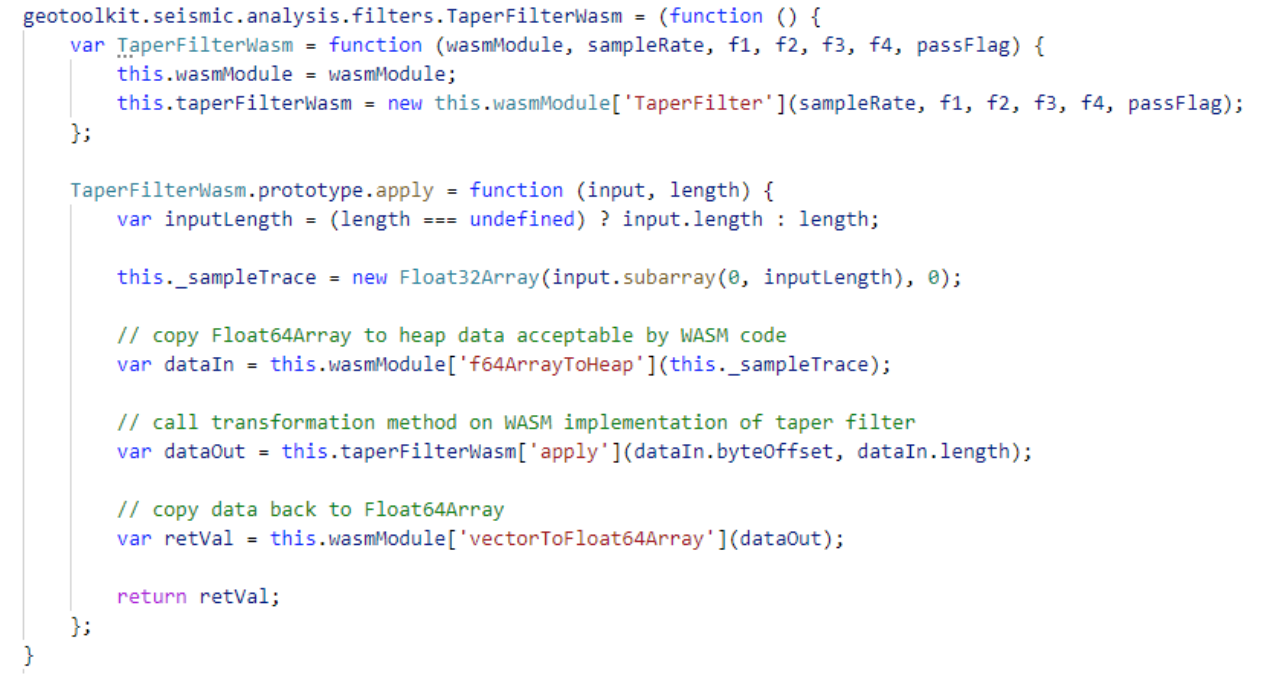
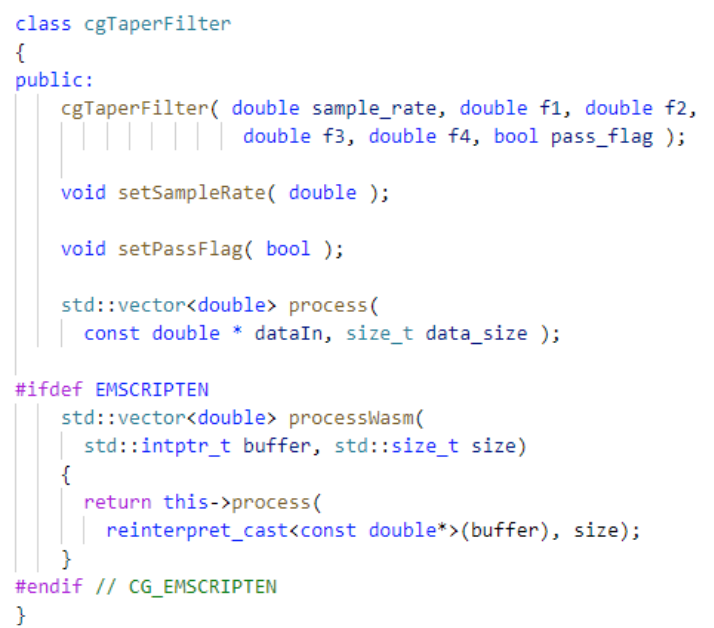
C++ Code to Integrate (TaperFilter.h/cpp)

Screen Shot 2020-11-04 at 2.48.55 PM

Emscripten Bindings 

Screen Shot 2020-11-04 at 2.49.12 PM

WebAssembly Integration Example

Screen Shot 2020-11-04 at 2.51.30 PM

Client-Side Speedup Takeaways:

  • Emscripten supports the WebAssembly SIMD proposal
  • Vectorized code will be executed by browsers
  • The results of vectorization for decompression algorithm are: 
    • Inv Normalization: 6 times speedup
    • Inv Haar Wavelets: 10 times speedup
    • Inv Huffman: no performance improvement (not vectorizable)

Overall, the client-side decompression performance improvement with vectorized C++ code was around 6 times faster than the JavaScript version.

For more information on GeoToolkit, please visit int.com/geotoolkit/ or check out our webinar, “How to Get the Best Performance of Your Seismic Web Applications.”


Filed Under: IVAAP Tagged With: compression, ivaap, java, javascript, seismic

Sep 09 2020

INT Adds Client SDK and Improves Seismic and Subsurface Visualization Performance with Latest Release of IVAAP 2.6

This release confirms IVAAP as a leader in the subsurface data visualization space, supporting Data Visualization and Data Management for Subsurface, Exploration, Drilling, or Production Applications in the cloud.

Houston, TX — INT is pleased to announce the newest release of its HTML5 upstream visualization platform, IVAAP™ 2.6, accelerating the pace of our release cycle to respond faster to the growing needs of our clients and partners.

IVAAP now offers a robust client SDK so users can extend the platform to meet their unique business objectives — now users can write new and extend existing widgets; add or remove existing modules; create new data connectors; extend the data model; and more. 

IVAAP 2.6 offers several key enhancements that mean better performance and faster data interaction in the cloud (Azure, AWS, Google): more interpretation capabilities with added fault picking in 2D seismic; improved map-based search with multiple criteria for OSDU R2; UI and navigation improvements; support for real-time wireline logging with decreasing depth; and a new connector to the Energy Information Administration (EIA) database.

“For this latest release, we wanted to focus on features and improvements that would complement our partnership with OSDU and enhance our cloud offerings,” said Hugues Thevoux-Chabuel, Vice President, Cloud Solutions at INT. “We gathered feedback from developers and end users to better understand their needs and worked hard to ensure IVAAP exceeds the current and near-future demands of our clients.”

IVAAP is an upstream visualization platform that enables search and visualization of geophysical, petrophysical, and production data in the cloud. It allows product owners, developers, and architects to rapidly build next-level subsurface digital solutions anywhere without having to start from scratch. 

Read the press release on PRWeb >

Check out int.com/ivaap for a preview of IVAAP or for a demo of INT’s other data visualization products. 

For more information, please visit int.flywheelstaging.com or contact us at intinfo@int.com.

Filed Under: IVAAP, Press Release Tagged With: faults, ivaap, SDK, seismic

May 07 2020

Interactive Network Technologies, Inc. (INT) Integrates Bluware Corp. Volume Data Store (VDS) into IVAAP

INT and Bluware are partnering to empower their upstream clients with true lossless, serverless storage and advanced data visualization in the cloud.

HOUSTON, TX – May 4, 2020 – Interactive Network Technologies, Inc. (INT) a leader in advanced domain visualization in digital exploration and production (E&P) and Bluware Corp., the digital platform that enables the oil and gas industry to accelerate digital transformation initiatives and adopt cloud computing for subsurface data, are pleased to announce the integration of Volume Data Store (VDS), a data format with adaptive streaming technology for seismic data storage, into IVAAP, an upstream data visualization platform. 

IVAAP is an HTML5 data visualization and collaborative platform for large Geoscience and petrophysical data sets in the cloud that empowers product owners, developers, and architects to accelerate the delivery of subsurface digital solutions for oil and gas. Deployable in any cloud environment (Azure®, GCP®, AWS®), IVAAP can scale to meet the needs of tens to thousands of users.


“Companies are pushed to the extreme in terms of remote collaboration and access, and, especially in the case of seismic visualization, finding the right tool to handle large datasets in the cloud can be even more challenging,” says Dr. Olivier Lhemann, President and Founder of INT. “Partnering with Bluware means INT can offer our clients true serverless, lossless storage to visualize their upstream data in the cloud.”


Bluware VDS manages all types of seismic data, including pre-stack, post-stack, WAZ, and more as demanded by an organization’s business needs, workflows, and infrastructure requirements. It can also transfer legacy formats such as SEG-Y or SEP using advanced on-the-fly transcoding on-premise or in the cloud.


“Bluware VDS cloud-native seismic data environment will provide customers with quick, cost-effective, remote access to their data, which is becoming imperative for organizations,” says Dan Piette, CEO at Bluware.


Read the press release on PRWeb >

About Bluware Corp.

Bluware enables oil and gas companies to solve the most challenging objectives in the petrotechnical world. E&P companies use Bluware to achieve previously unthinkable workflows using cloud computing, and artificial intelligence for subsurface data applications and workflows. For more information, visit www.bluware.com.

Filed Under: IVAAP Tagged With: AWS, Azure, Bluware, digital transformation, gcp, ivaap, seismic

Jan 26 2018

Simplifying the Learning Curve of the Seismic Unix Library

A graphical user interface to help jumpstart your SU Library adoption

The SU (Seismic Unix) Library is a well-known set of utilities used to research and process seismic data. Supported by the Center for Wave Phenomena (CWP) at the Colorado School of Mines (CSM), it is a powerful package that is widely used in the geoscience community.

Following the Linux philosophy, each utility within this package is a separate command. For example, the segyread command converts SEG-Y files to the SU format. With hundreds of commands at your disposal, and with each command having multiple parameters, it can be a daunting task to get started.

INTViewer provides a graphical user interface for the SU library, reducing the learning curve. The Seismic Workbench is a free plugin that has the documentation for the SU library built in, making it easy to find a particular command and all the parameters that this command requires. INTViewer builds the full command line for you based upon all individual commands selected. [See the Seismic Workbench plugin video walkthrough here.]

An example of generated command line

You can elect to run this command line from inside INTViewer or from your own terminal. Running inside INTViewer provides neat integration options: Not only you can leverage INTViewer’s built-in trace processors and generators, but you can also visualize in real time the datasets that each step creates. The workbench allows you to customize the display parameters of each output dataset, and save your set of steps as a complete job for later reuse.

An example of processing step configuration

While the SU Library was built with Linux in mind, Windows users are not without options. They typically use Cygwin to run native Linux applications, including the SU library utilities. [Stay tuned for our next blog describing the complete installation of Cygwin and the SU Library on Windows.] Users of the seismic workbench have reported that the graphical user interface and the integration with INTViewer made the SU Library much more accessible.

For more information about INTViewer, visit the INTViewer product page, or contact us for a free trial.


Filed Under: INTViewer Tagged With: INTViewer, seismic, unix

Jul 24 2017

Overlaying Shape Files on Seismic Surveys

In our post, “Closer Look at Coordinate Conversions,” we allude to the capabilities of INTViewer with coordinate system conversions. One benefit of on-the-fly conversions is the ability to see your seismic data in context. In the example below, a time slice is reprojected to the coordinate system used by Google Maps.


Side-by-side view of seismic dataset in original CRS projected to a Mercator-type CRS over satellite imagery. Data courtesy of Geophysical Pursuit Inc.


Showing satellite imagery is only one example of how you can use INTViewer to verify the geolocation of a seismic survey. INTViewer can visualize much more than seismic, and our customers often use INTViewer to compare seismic survey with shape files.

In the example below, the seismic is delimited in two regions, and each of these regions is delimited by a shape file.

Two shape files overlaid on a time slice layer with Bing Maps in the background.


The most basic shape files consist essentially of polygons. Each point of this polygon has coordinates relative to a CRS. The shape files in this example are referencing the NAD27 coordinate system. INTViewer automatically converts NAD27 locations to the CRS used by Google Maps, making it possible to view several datasets in the same map window.

Similar to layers in Adobe Photoshop, each dataset has its own layer. Layering allows you to visualize several objects at one, while keeping independent control of each object. This concept is used across the entire INTViewer experience to allow users to overlay data.

When users start a new session, they typically open the dataset from the File menu. Then, to overlay data, they select the Layer → Add Layer menu. For example, to produce the screenshot below, you would first:

One shape file overlaid on a time slice layer.

 
Open a seismic dataset as a time slice:

Seismic dataset as time slice.

 
Then add a GIS layer:

Adding a GIS Layer

 
INTViewer’s support for shape files goes beyond visualizing simple polygons. The example below describes oil and gas fields West of Norway.

Shape file showing Oil and Gas fields west of Norway.

 
INTViewer also lets users create their own shape file programmatically (see our help site here). Check out the subject of our next post — one of the most interesting uses of shape files in INTViewer—the Mineral Rights plugin. In this plugin, seismic surveys are cut along regions delimited by shape files.

Stay tuned!

Check back soon for more new features and tips on how to use INTViewer or contact us for a demo.


Filed Under: INTViewer Tagged With: INTViewer, seismic, shape files, time slice

  • « Go to Previous Page
  • Page 1
  • Page 2

Footer

Solutions

  • Real-Time Visualization
  • Visualization Components
  • New Energy Visualization
  • OSDU Visualization
  • Machine Learning
  • Developer Tools
  • Cloud Partners
  • Customer Success Stories

Products

  • IVAAP
  • GeoToolkit
  • INTViewer
  • IVAAP Demos
  • GeoToolkit Demos

About

  • News
  • Events
  • Careers
  • Management Team

Resources

  • Blog
  • FAQ

Support

  • JIRA
  • Developer Community

Contact

INT logo
© 1989–2024 Interactive Network Technologies, Inc.
Privacy Policy
  • Careers
  • Contact Us
  • Search

COPYRIGHT © 2025 INTERACTIVE NETWORK TECHNOLOGIES, Inc