For E&P companies, the next challenge in their digital transformation — once their data has been properly stored, indexed, enriched, and cataloged in the cloud — is to make it available in a collaborative way where users can easily interact with the data through exploration, computation, and analysis. To create this digital workspace, companies must fully integrate machine learning, along with advanced data visualization, in a single platform where users can search, select data from multiple data sources, execute models, and visualize the results.
Accelerating the Transition from R&D to Operations
While many companies have begun the shift toward using machine learning, many have not seamlessly integrated ML. Implementing ML is the goal, but many get stuck along the way, weighed down by cumbersome processes or siloed systems. So the first challenge is transitioning the ML process from R&D to operations, where the model is fully deployed and used by data scientists.

In a typical process, once the data is prepared and cleaned, it is split and labeled for training in order to understand whether the model is working properly or not. Then the model is moved into operations, data is fed into it, and finally, the user can see the output. The process from development to production, R&D to operations is very, very slow, even with continuous integration and deployment pipelines. This is where a centralized solution can help to eliminate the need to move data from one system to another or have to build another application to consume, compute, and visualize the data.

The Drivers for Centralizing Data Exploration, ML Execution, and Domain Visualization
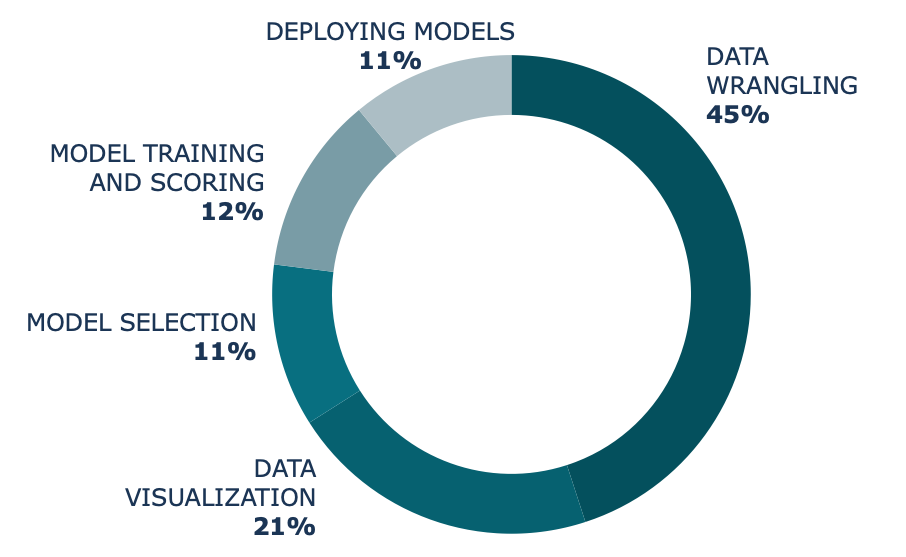
Integrating machine learning into geoscience workflows has traditionally posed many challenges for data scientists, from siloed, incomplete data to disjointed, disconnected systems. Even now, once geoscientists spend up to 45% of their time ensuring that the data is uniform, organized, and labeled correctly, they must then switch to another application to execute the model, another to view the results, and yet another to share the results with their team. By combining these processes in one place, companies can get the most from their data — the most accurate models, with the most accurate business insights.
The Emergence of New Visualization Technologies Leveraging ML to Power Data-Driven Decisions
For true ML integration, companies are challenged to rethink the user experience and find a way to utilize a single platform that can simplify this process, from collecting and cleaning data to training and evaluating the model to using the model to power data-driven business decisions. This is why many companies are looking at “re-platforming” existing apps or simply rebuilding new apps that can combine features spread across multiple applications. However, companies do not need to go down that path anymore with the emergence of a new generation of data visualization cloud-native platforms such as IVAAP.
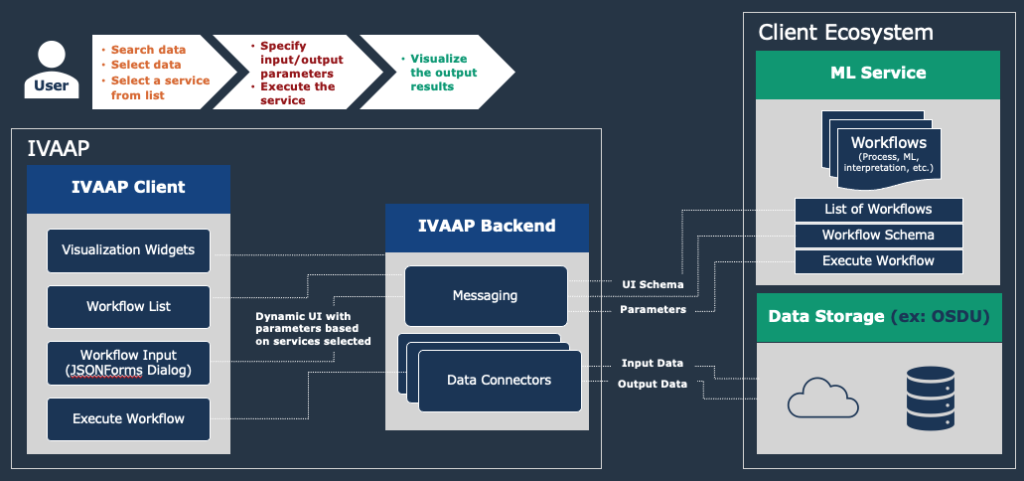
IVAAP is a new way to connect the dots. The cloud-native client is creating a single place for users such as geoscientists and data scientists to conduct all necessary steps in MLOps: data exploration, ML execution, and visualization. The platform offers a digital workspace connecting to the various back-end systems seamlessly for end-end users.

In the example above, the user can access search functions, data sources, and various ML environments such as AWS SageMaker to create a true end-to-end machine learning integration. Streamlining and simplifying the geoscience workflow starts with the end-user experience: the user can be presented with specific data input/output dynamically based on the processing function or ML programs he is executing. IVAAP’s dynamic UI delivers a powerful way for data scientists to execute ML in geoscience.
If you are interested in learning more, you can also check out the recent AWS/INT webinar for a deeper dive into how the technology works, dynamic UI, and ML integration.
Learn more about IVAAP here or contact us at info@int.com.
