• Skip to main content
  • Skip to footer

INT

Empowering Visualization

COMMUNITY BLOG
CONTACT US SUPPORT
MENUMENU
  • Solutions
    • Overview
    • Real-Time Visualization
    • Visualization Components
    • New Energy Visualization
    • OSDU Visualization
    • Machine Learning
    • Developer Tools
    • Cloud Partners
  • Products
    • IVAAP™
          • SOLUTIONS

            Real-Time Visualization

            OSDU Visualization

            Visualization Components

            New Energy Visualization

            Upstream Data Visualization

          • SUCCESS STORIES

            WEATHERFORD
            Well delivery optimization software

            BARDASZ
            Data management, data quality monitoring

            ANPG / SATEC-MIAPIA
            Virtual data room

            MAILLANCE
            High-performance visualization of ML algorithms

            SEE ALL >

          • SUPPORT

            DEVELOPER COMMUNITY
            Join or log in to the INT Developer Community.

            GET SUPPORT
            Log a ticket for an issue or bug.

            CONTACT US

          • DEMOS

            IVAAP DEMOS
            Cloud-Based Demos

            FIRST TIME HERE?
            Register to access our
            IVAAP demos

    • GeoToolkit™
          • SUCCESS STORIES

            CAYROS
            Field development planning

            TOTALENERGIES
            High-performance large dataset reservoir rendering

            IFP ENERGIES NOUVELLES
            Seismic and structural interpretation validation

            SEE ALL >

          • SUPPORT

            DEVELOPER COMMUNITY
            Join or log in to the INT Developer Community.

            GET SUPPORT
            Log a ticket for an issue or bug.

            CONTACT US

          • DEMOS

            GEOTOOLKIT DEMOS
            Geoscience Demos

    • INTViewer™
          • SUCCESS STORIES

            STRYDE
            Fast seismic QA/QC in the field

            SILVERTHORNE SEISMIC
            Efficient 2D/3D seismic data delivery

            WIRELESS SEISMIC
            Drones, IoT, and Advanced Onsite Seismic Data Validation

            SEE ALL >

          • SUPPORT

            GET SUPPORT
            Log a ticket for an issue or bug.

            CONTACT US

          • PLUG-INS

            EXTEND INTVIEWER
            More than 65 plugins available

  • Demos
    • GeoToolkit Demos
    • IVAAP Demos
  • Success Stories
  • Resources
    • Blog
    • Developer Community
    • FAQ
    • INT Resources Library
  • About
    • Overview
    • News
    • Events
    • Careers
    • Meet Our Team
    • About INT

widgets

Apr 18 2017

Extend INTViewer with Java

The inspiration for this blog comes from this poster that was recently added to our walls at the office.

So, how does INTViewer help developers empower users?

INTViewer provides many features off-the-shelf, but its extensibility is unique. Developers can customize numerous aspects of INTViewer by extending the INTViewer platform. And one way to extend this platform is to write Java plugins.

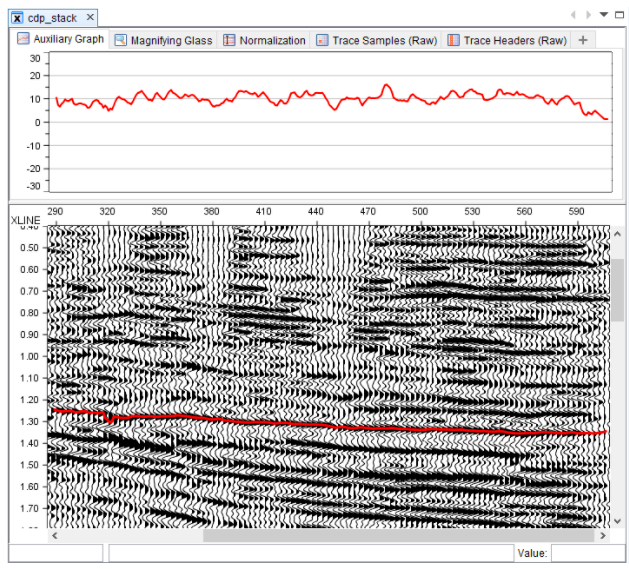
Here’s an example: INTViewer 5.2 has a new feature called Auxiliary Widgets which allows content to be displayed above XSection windows. I also mentioned this feature when I introduced the Normalization widget.
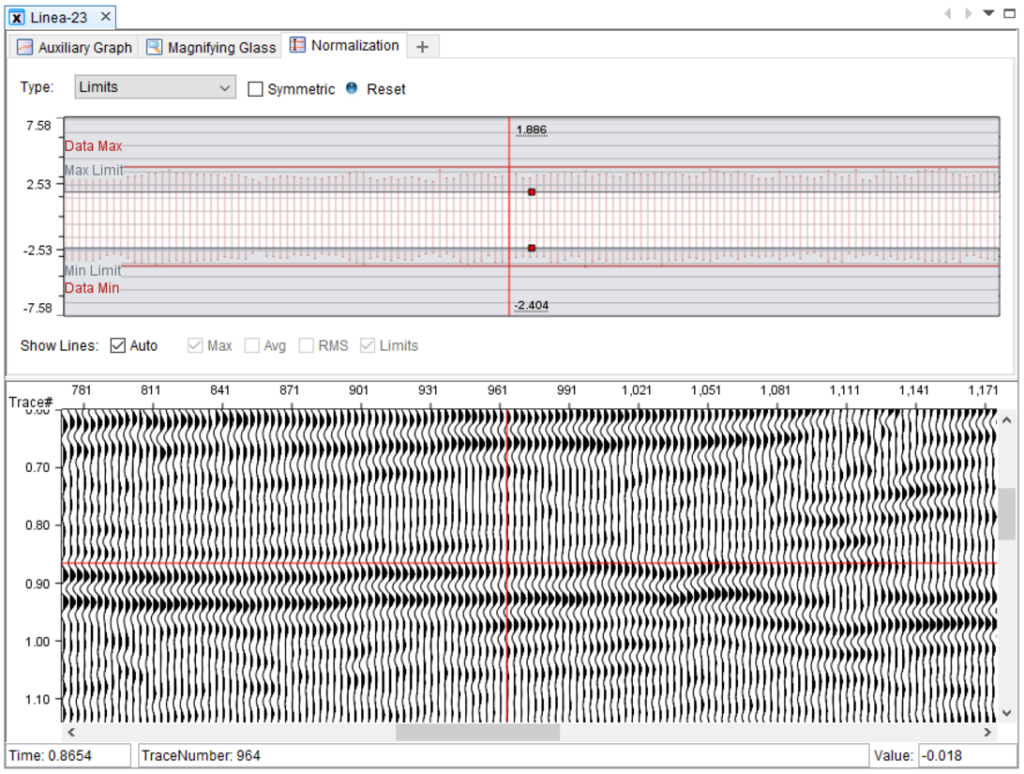
An example of the auxiliary widget allowing interactive limits normalization
Because INTViewer is an extensible platform, customers can add their own widget to the set already built in, meaning they can write their own widget for XSection windows.

We maintain a dedicated site for developers to find tutorials and other reference material to learn how to write plugins. For example, here’s the step-by-step guide to help developers add their own auxiliary widget.
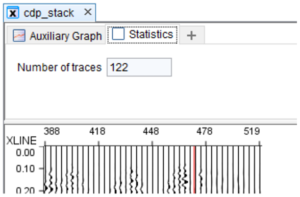
The “Statistics” auxiliary widget added by plugin

What’s remarkable about this example is that it only takes three small files to plug this fully functional feature. Meaning that not only is INTViewer an extensible platform, but it is also a platform that is simple to extend. We spent many hours on the public API to make sure it is easy to understand and easy to use, yet powerful.

Now, why is the ability to add content on top of XSection windows valuable? Hardware vendors are one example of a company that would want to leverage this feature. Companies who sell acquisition hardware need to provide a tool for their customers to visualize the proprietary data captured by their instruments. The auxiliary widgets area is an ideal place for showing additional data specific to acquisition hardware. As end users visualize a seismic dataset recently captured, they also visualize vital parameters of the acquisition session without having to open another dialog or window.

Extending INTViewer is a broad topic, impossible to cover in just one post, so check back often for more articles on this topic and more. Or to get started with plugins, check out this architecture article.

Check back soon for more new features and tips on how to use INTViewer or contact us for a demo.

Filed Under: INTViewer Tagged With: INTViewer, widgets, XSection

Apr 15 2017

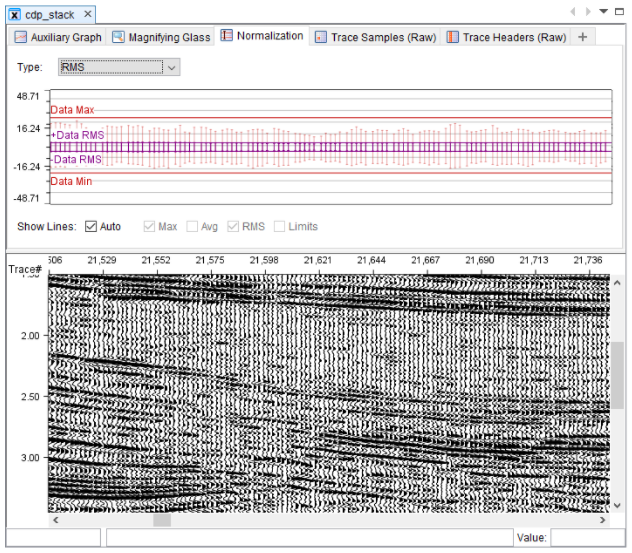
Introducing the Normalization Widget

The release of INTViewer 5.2 is just around the corner. With it, there are around 100 new features and improvements. As a quick preview, I’d like to focus on one of them, a favorite of mine, the Normalization widget.

The Normalization widget is part of the new “Auxiliary Widget” feature set. If you are familiar with INTViewer, you have probably used the Auxiliary Graph before to inspect variations of amplitudes along horizons or just seismic header values. INTViewer 5.2 generalizes the concept of an area located right above a XSection window. Not only is this area now resizable, but it can also show multiple tools.

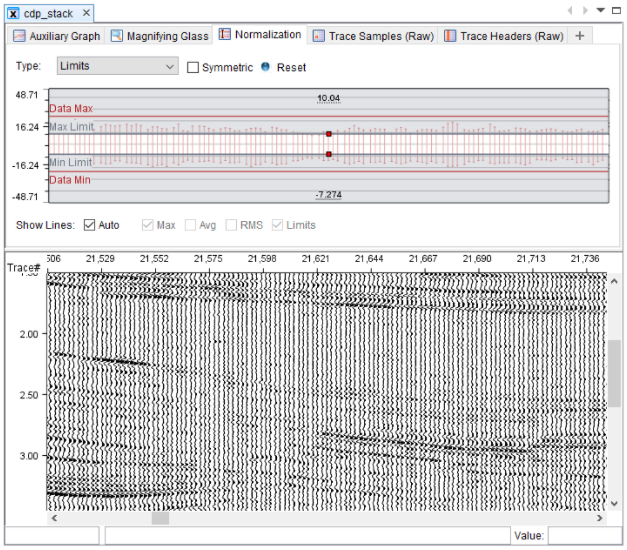
The Normalization widget is one of these tools. It shows graphically how your current selection relates to the minimum and maximum amplitudes of the entire dataset. There are several normalization options in INTViewer: RMS, Maximum, Limits, etc. Until now, there wasn’t a graphical way to decide which option works best for your data. The widget’s plot shows the minimum and maximum of each trace displayed. If you picked the RMS option, the RMS of your dataset is shown as a horizontal line, and the RMS of each trace is displayed as a vertical line.

The Limits normalization type is often used when you perform a rapid QA of your data. Some customers even make Limits the default normalization type. The Limits normalization requires the entry of a minimum and maximum. The Normalization widget makes the selection of this range graphical and interactive. You no longer have to enter arbitrary values blindly. Just drag the minimum and maximum curtains in the widget and your visualization will update automatically.

As part of the preparation for the INTViewer 5.2 release, we worked with a few professors at Texas A&M and found that the Normalization widget is a great tool for teaching the different types of normalization. All seismic packages have nearly identical normalization capabilities. INTViewer is the only application of its kind providing such an effective way to make an informed decision about which normalization type to pick.

INTViewer 5.2 is a major release with many new features deserving a closer look. One of our next posts will talk about how developers can easily add their own auxiliary widget.


Filed Under: INTViewer Tagged With: INTViewer, normalization, widgets

Footer

Solutions

  • Real-Time Visualization
  • Visualization Components
  • New Energy Visualization
  • OSDU Visualization
  • Machine Learning
  • Developer Tools
  • Cloud Partners
  • Customer Success Stories

Products

  • IVAAP
  • GeoToolkit
  • INTViewer
  • IVAAP Demos
  • GeoToolkit Demos

About

  • News
  • Events
  • Careers
  • Management Team

Resources

  • Blog
  • FAQ

Support

  • JIRA
  • Developer Community

Contact

INT logo
© 1989–2024 Interactive Network Technologies, Inc.
Privacy Policy
  • Careers
  • Contact Us
  • Search

COPYRIGHT © 2025 INTERACTIVE NETWORK TECHNOLOGIES, Inc