• Skip to main content
  • Skip to footer

INT

Empowering Visualization

COMMUNITY BLOG
CONTACT US SUPPORT
MENUMENU
  • Solutions
    • Overview
    • Real-Time Visualization
    • Visualization Components
    • New Energy Visualization
    • OSDU Visualization
    • Machine Learning
    • Developer Tools
    • Cloud Partners
  • Products
    • IVAAP™
          • SOLUTIONS

            Real-Time Visualization

            OSDU Visualization

            Visualization Components

            New Energy Visualization

            Upstream Data Visualization

          • SUCCESS STORIES

            WEATHERFORD
            Well delivery optimization software

            BARDASZ
            Data management, data quality monitoring

            ANPG / SATEC-MIAPIA
            Virtual data room

            MAILLANCE
            High-performance visualization of ML algorithms

            SEE ALL >

          • SUPPORT

            DEVELOPER COMMUNITY
            Join or log in to the INT Developer Community.

            GET SUPPORT
            Log a ticket for an issue or bug.

            CONTACT US

          • DEMOS

            IVAAP DEMOS
            Cloud-Based Demos

            FIRST TIME HERE?
            Register to access our
            IVAAP demos

    • GeoToolkit™
          • SUCCESS STORIES

            CAYROS
            Field development planning

            TOTALENERGIES
            High-performance large dataset reservoir rendering

            IFP ENERGIES NOUVELLES
            Seismic and structural interpretation validation

            SEE ALL >

          • SUPPORT

            DEVELOPER COMMUNITY
            Join or log in to the INT Developer Community.

            GET SUPPORT
            Log a ticket for an issue or bug.

            CONTACT US

          • DEMOS

            GEOTOOLKIT DEMOS
            Geoscience Demos

    • INTViewer™
          • SUCCESS STORIES

            STRYDE
            Fast seismic QA/QC in the field

            SILVERTHORNE SEISMIC
            Efficient 2D/3D seismic data delivery

            WIRELESS SEISMIC
            Drones, IoT, and Advanced Onsite Seismic Data Validation

            SEE ALL >

          • SUPPORT

            GET SUPPORT
            Log a ticket for an issue or bug.

            CONTACT US

          • PLUG-INS

            EXTEND INTVIEWER
            More than 65 plugins available

  • Demos
    • GeoToolkit Demos
    • IVAAP Demos
  • Success Stories
  • Resources
    • Blog
    • Developer Community
    • FAQ
    • INT Resources Library
  • About
    • Overview
    • News
    • Events
    • Careers
    • Meet Our Team
    • About INT

XSection

Apr 18 2017

Extend INTViewer with Java

The inspiration for this blog comes from this poster that was recently added to our walls at the office.

So, how does INTViewer help developers empower users?

INTViewer provides many features off-the-shelf, but its extensibility is unique. Developers can customize numerous aspects of INTViewer by extending the INTViewer platform. And one way to extend this platform is to write Java plugins.

Here’s an example: INTViewer 5.2 has a new feature called Auxiliary Widgets which allows content to be displayed above XSection windows. I also mentioned this feature when I introduced the Normalization widget.

An example of the auxiliary widget allowing interactive limits normalization
Because INTViewer is an extensible platform, customers can add their own widget to the set already built in, meaning they can write their own widget for XSection windows.

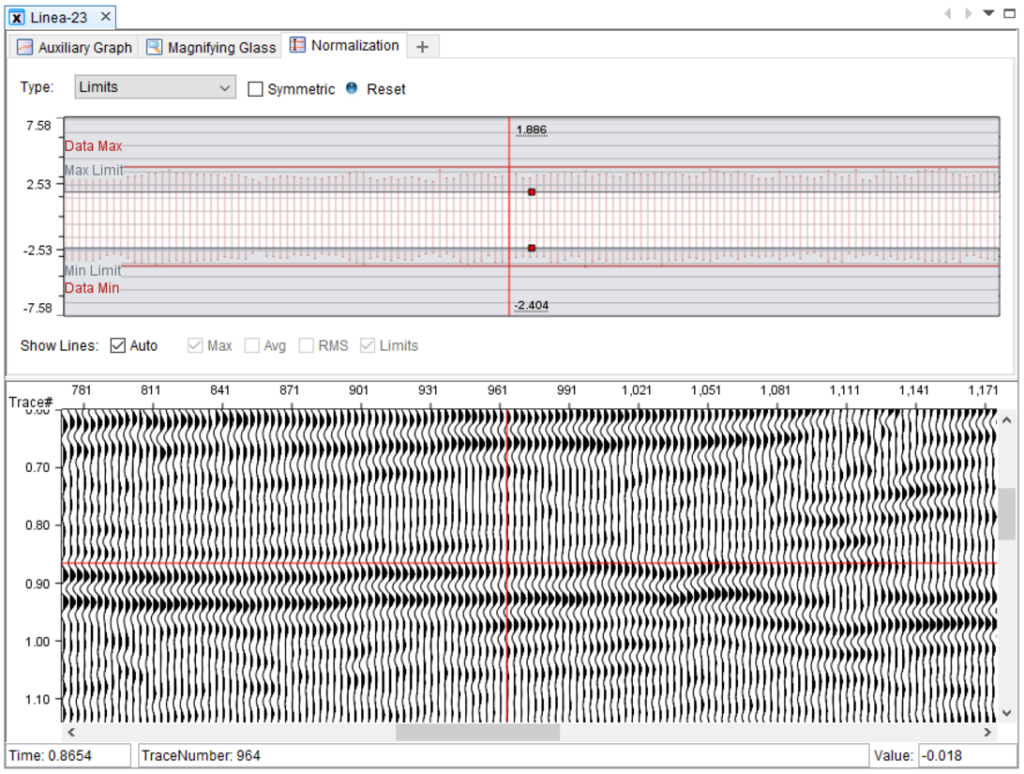
We maintain a dedicated site for developers to find tutorials and other reference material to learn how to write plugins. For example, here’s the step-by-step guide to help developers add their own auxiliary widget.

The “Statistics” auxiliary widget added by plugin

What’s remarkable about this example is that it only takes three small files to plug this fully functional feature. Meaning that not only is INTViewer an extensible platform, but it is also a platform that is simple to extend. We spent many hours on the public API to make sure it is easy to understand and easy to use, yet powerful.

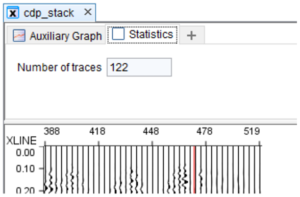
Now, why is the ability to add content on top of XSection windows valuable? Hardware vendors are one example of a company that would want to leverage this feature. Companies who sell acquisition hardware need to provide a tool for their customers to visualize the proprietary data captured by their instruments. The auxiliary widgets area is an ideal place for showing additional data specific to acquisition hardware. As end users visualize a seismic dataset recently captured, they also visualize vital parameters of the acquisition session without having to open another dialog or window.

Extending INTViewer is a broad topic, impossible to cover in just one post, so check back often for more articles on this topic and more. Or to get started with plugins, check out this architecture article.

Check back soon for more new features and tips on how to use INTViewer or contact us for a demo.


Filed Under: INTViewer Tagged With: INTViewer, widgets, XSection

Apr 18 2017

Choosing the Right Coordinate Reference System

INTViewer has been around for quite a while now. And over the last 8 years that I have worked on it, it has evolved a lot. As more and more users used the application, we were able to solicit and integrate their feedback, further maturing the application.

Sometimes, however, you don’t need to add new features to make a software great — just revisiting a design can sometimes add value. For INTViewer, the Coordinate Reference System (CRS) selection dialog is one of the areas we improved just by tweaking the design.

The most often used window of INTViewer is the XSection. When we surveyed our customers, we found that many didn’t know about the mapping capabilities of INTViewer. This is a shame since INTViewer makes it very easy to visualize your survey from a bird’s eye view in the map window.

To integrate satellite imagery and view your survey in context, you need strong coordinate reprojection capabilities. Five years ago, we worked to make INTViewer GIGS (Geospatial Integrity of Geoscience Applications) compliant. Actually, most of the work was done in J/CarnacGIS, a Java library designed for the visualization of Geographic Information System (GIS) data. INT developed this product separately, but it is included in INTViewer. I leverage its API often when I develop plugins, and customers do, too. CRS conversions done with INTViewer are very accurate — they use NADCON (North American Datum Conversion) and NTV2 (National Transformation version 2) grids when available. But a key to a valid conversion from one CRS to another is to pick the right CRSs in the first place!

Up until INTViewer 5.1.1, the CRS selection dialog looked like this:

This dialog essentially listed all CRS in the European Petroleum Survey Group (EPSG) database, prompting the user to choose the right code … among approximately 2,000 codes.

In INTViewer 5.2, the user interface has been enhanced to show a map that highlights the area of use of the CRS you are selecting:

When you perform quality analysis of your data before sending it for interpretation, you want to make sure that it is properly geolocated. This dialog allows you to check that the CRS you are picking is in the right region, and it highlights its area of use. If your data falls outside of this area of use, the validity of CRS conversions is compromised, leading to invalid visualizations.

INTViewer compares the bounding box of your data with the bounding box of the area of use. If the area of use fully contains your data, a green badge will be shown next to the CRS and in the map.

If there is only a partial match, a yellow badge will be shown.

This is a simple way to validate your selection. The CRS selection feature itself hasn’t changed, but the user experience has improved.

Users who work primarily on one survey won’t be affected by this change: they know by heart which CRS their survey uses. For me, as I often switch from one survey to another when I perform demos, this makes my task much simpler as I don’t always remember the EPSG code I need to enter. Customers who use INTViewer as a presentation tool (for example to showcase acquisition surveys) should also benefit.

Check back soon for more new features and tips on how to use INTViewer or contact us for a demo.


Filed Under: INTViewer Tagged With: CRS, INTViewer, XSection

Footer

Solutions

  • Real-Time Visualization
  • Visualization Components
  • New Energy Visualization
  • OSDU Visualization
  • Machine Learning
  • Developer Tools
  • Cloud Partners
  • Customer Success Stories

Products

  • IVAAP
  • GeoToolkit
  • INTViewer
  • IVAAP Demos
  • GeoToolkit Demos

About

  • News
  • Events
  • Careers
  • Management Team

Resources

  • Blog
  • FAQ

Support

  • JIRA
  • Developer Community

Contact

INT logo
© 1989–2024 Interactive Network Technologies, Inc.
Privacy Policy
  • Careers
  • Contact Us
  • Search

COPYRIGHT © 2025 INTERACTIVE NETWORK TECHNOLOGIES, Inc