Feedback is key to the improvement of any software. INTViewer has many long-time users, and one piece of feedback that I sometimes receive is that “it takes too many clicks to reach an often-used feature.” Fortunately, with many years of real-world usage under its belt, the usability of INTViewer has been fine-tuned. These “missing” shortcuts are already built-in, I just didn’t do a good job communicating these improvements to our users. So now I’ll try to address this by sharing the 5 most overlooked INTViewer shortcuts.
1. Customizing Header Annotations
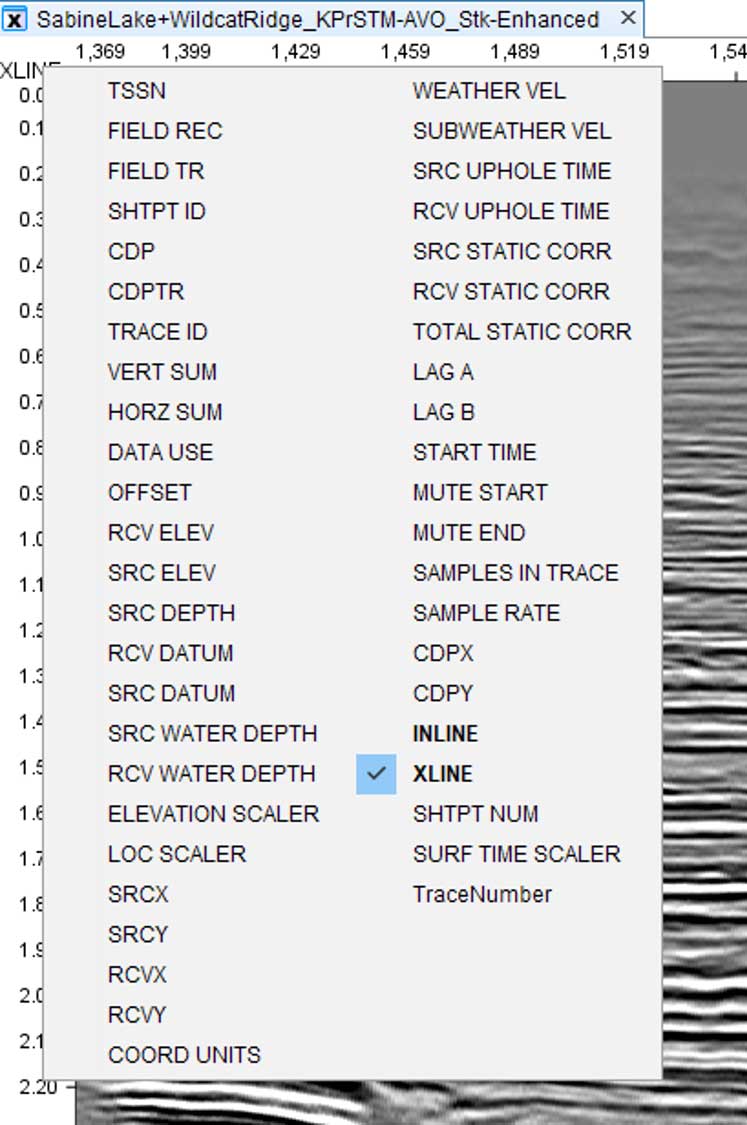
The most often-used window of INTViewer is the XSection window. The horizontal annotations are an efficient tool to inspect the seismic headers, but INTViewer tends to show one header at a time by default.
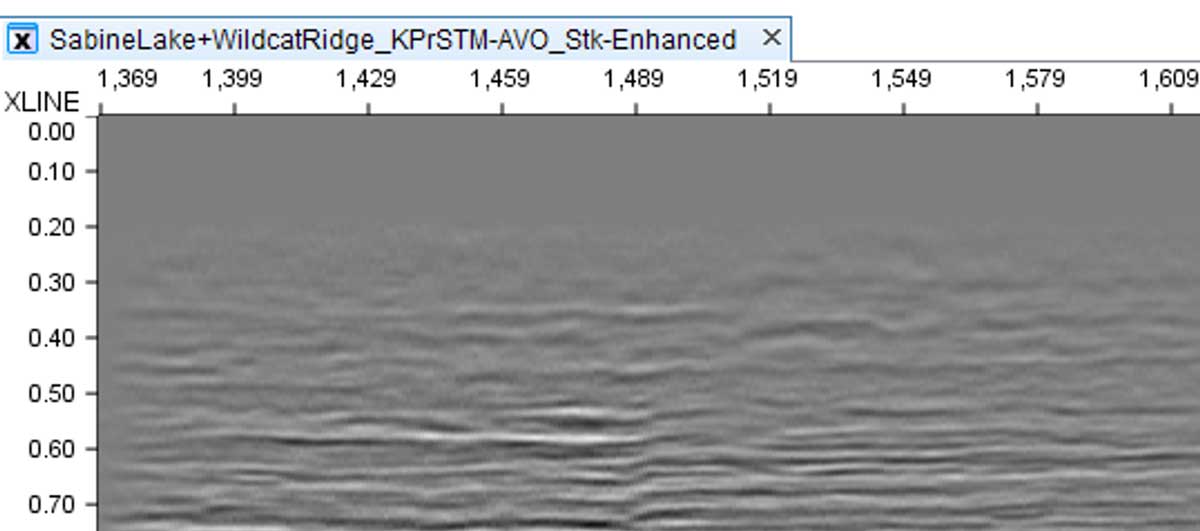
INTViewer veterans would typically reach for the Plot → Annotation menu, click the Horizontal tab, select a header, then press Ok. That’s five clicks. You can perform the same operation by right-clicking the top-left corner of your visualization, and selecting the header of your choice.
2. Customizing Color Bars
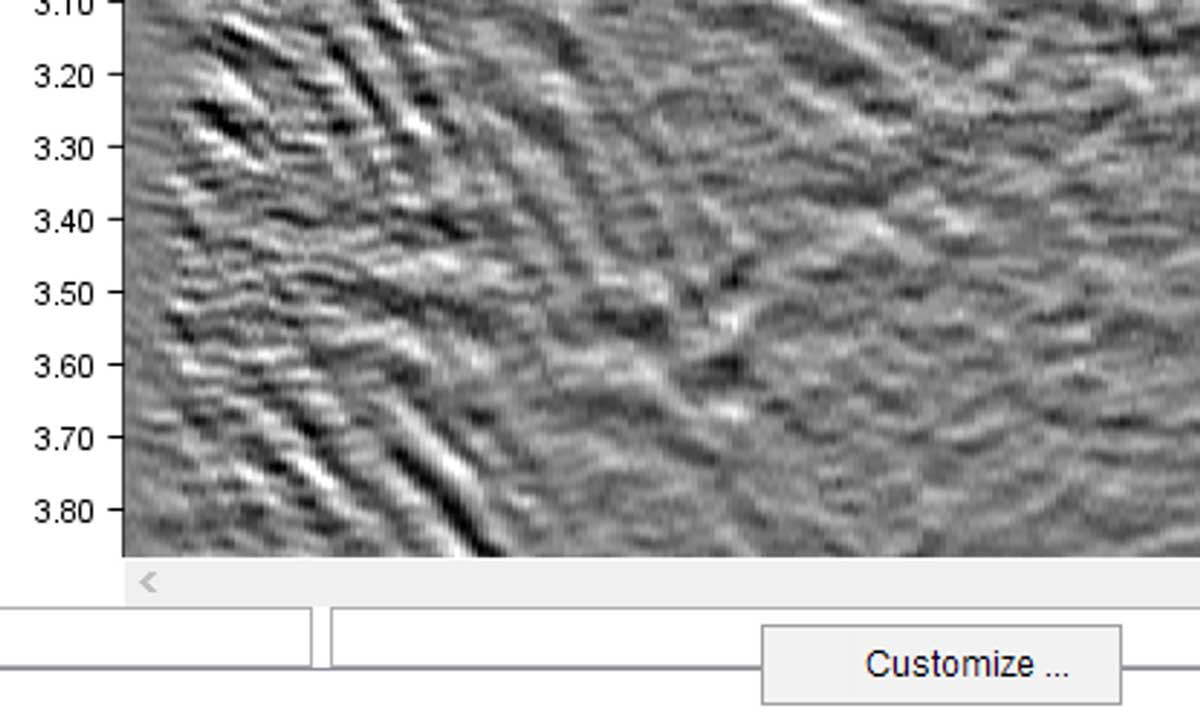
Another annotation that is quite popular is the color bar. Color bars can be customized from Plot → Annotation → Bars tab, but that’s three clicks just to open this dialog. A faster way is to right-click the bottom locator bar, and select Customize. This contextual menu item will open the Bars dialog directly.
3. Opening Menus
There are times where even opening a contextual menu is too time-consuming. The annotations dialog is one of the panels that users need to open frequently. If this is your case, you have the option to define a keyboard shortcut to open it.
Open the Tools → Options → Keymap tab and enter the shortcut you’d like to assign to your most-often used menu. In the example below, we choose pressing the Control key while pressing the K key as our keyboard shortcut.
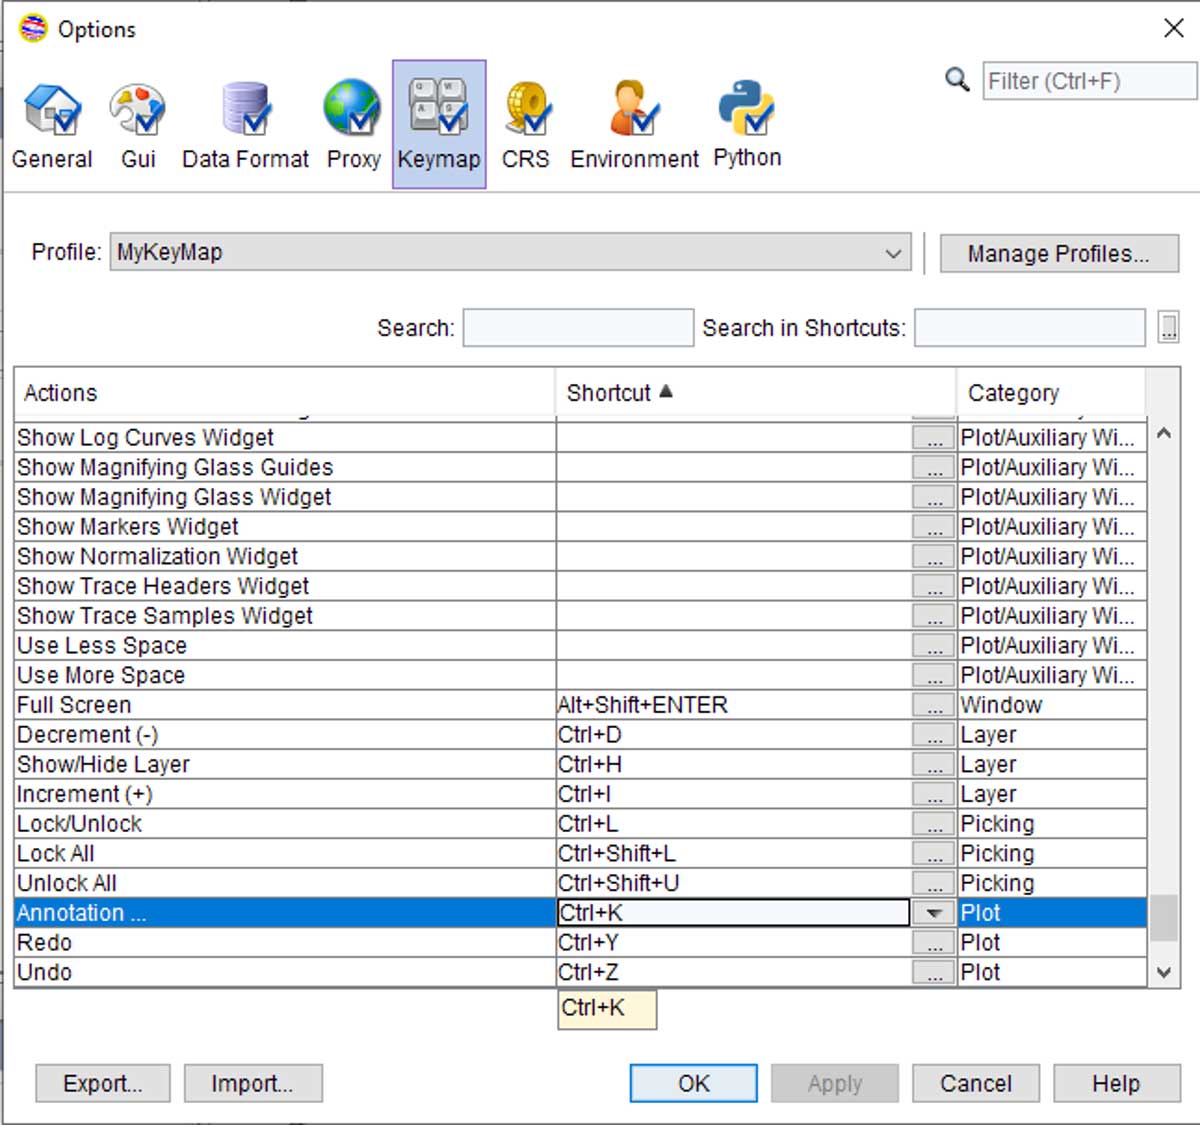
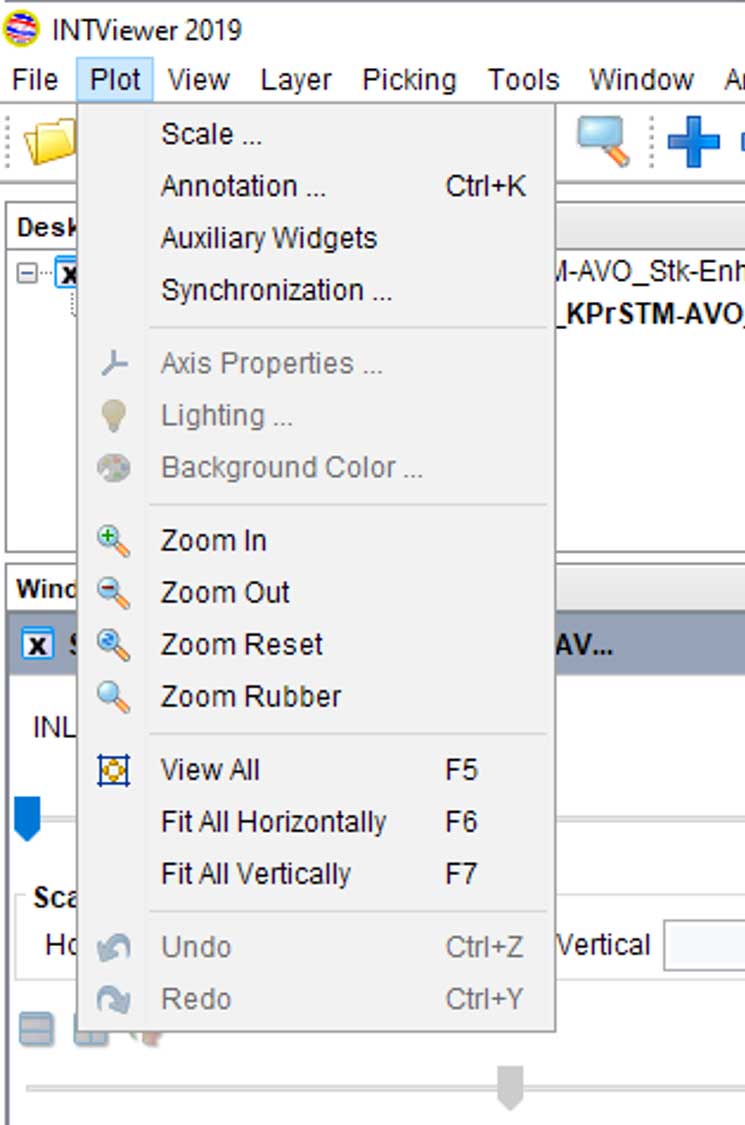
The annotation dialog will now automatically open from anywhere when using this combination of keys. The menu itself will also remind you of this shortcut.
4. Customizing Display Parameters
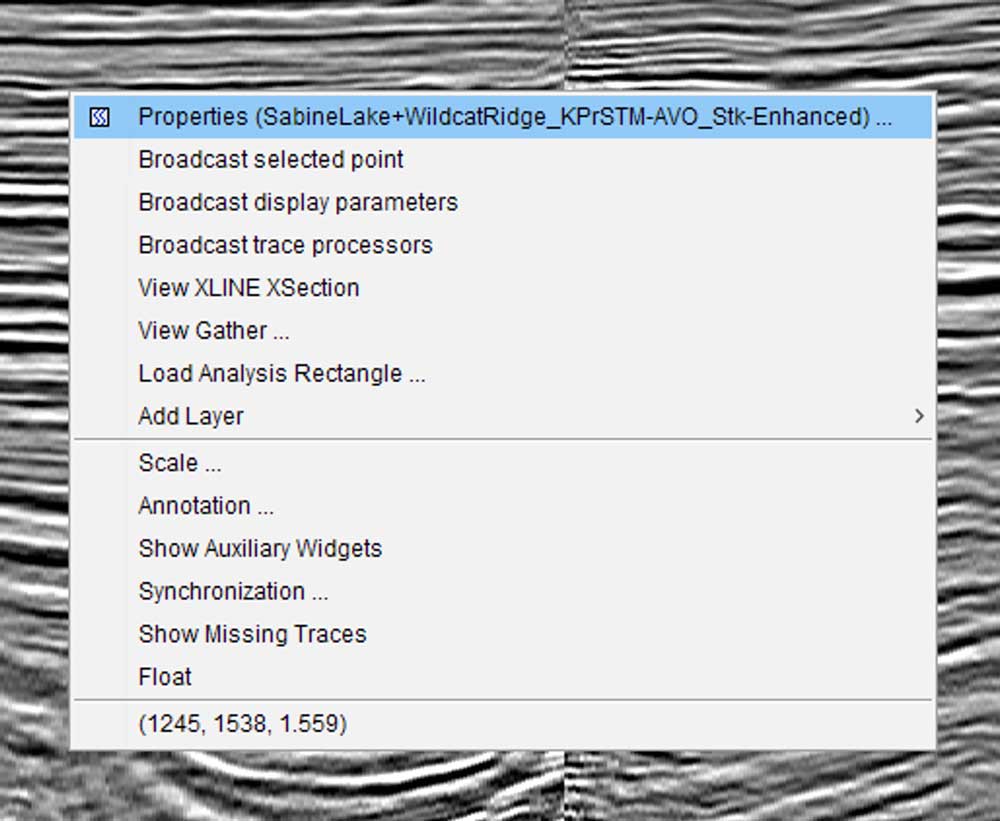
The classic way to customize the rasterization of a seismic visualization is to right-click the content of a XSection window, select Properties, select the Display Parameters tab, select a color bar, then press OK.
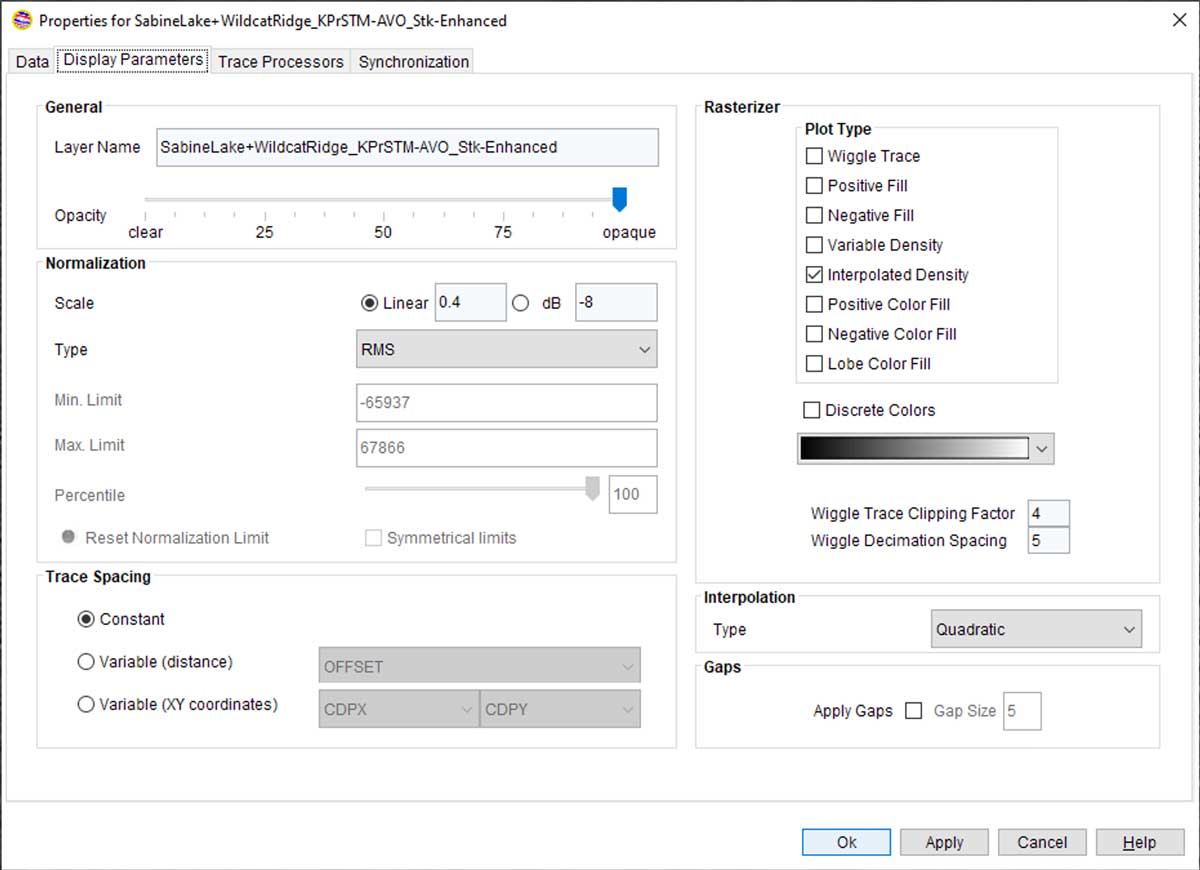
This often-used sequence of clicks can be reduced using profiles. Once you have selected a set of parameters, you can save them as a profile, then later apply these parameters by default or on demand.
The set of parameters that you can control goes beyond the display parameters. You can use it, for example, to define a standard scale—or even a standard set of seismic headers.
5. Automating Steps
Much of the geoscience QA work is repetitive. If you are familiar with Microsoft Excel and became a power user with its macros, you will probably benefit from INTViewer’s Python capabilities.
INTViewer empowers geoscientists by letting them automate their steps. For example, opening a 3D visualization, a XSection window, a map, and a spectrum analysis of one seismic dataset would require numerous clicks when performed manually. INTViewer makes this sequence of steps seamless with its easy-to-learn Python syntax. Here is actual script that prompts a user for a dataset on disk, then opens these four windows:
# prompt for a seismic file on disk
chooser=SeismicDataChooser()
seismicData=chooser.getSelectedData()

# open a 3D window with that dataset
window3D=Window3D('3D')
object3d=SeismicVolumeLayer3D(window3D, seismicData)
object3d.addDefaultSlices()

# open a XSection window with that dataset
xsectionWindow=XSectionWindow('XSection')
seismicLayer=SeismicLayer(xsectionWindow, seismicData)

# open a map window with that dataset
mapWindow=MapWindow('Map')
mapLayer=MapSeismicLayer(mapWindow, seismicData)

# open a spectrum window with that dataset
spectrumWindow=SpectrumWindow('Spectrum Analysis')
spectrumLayer=SpectrumLayer(spectrumWindow, seismicLayer)

# arrange all these windows as one
WindowManager().combineAll()
After dragging this Python script to INTViewer’s desktop, INTViewer will look like this:
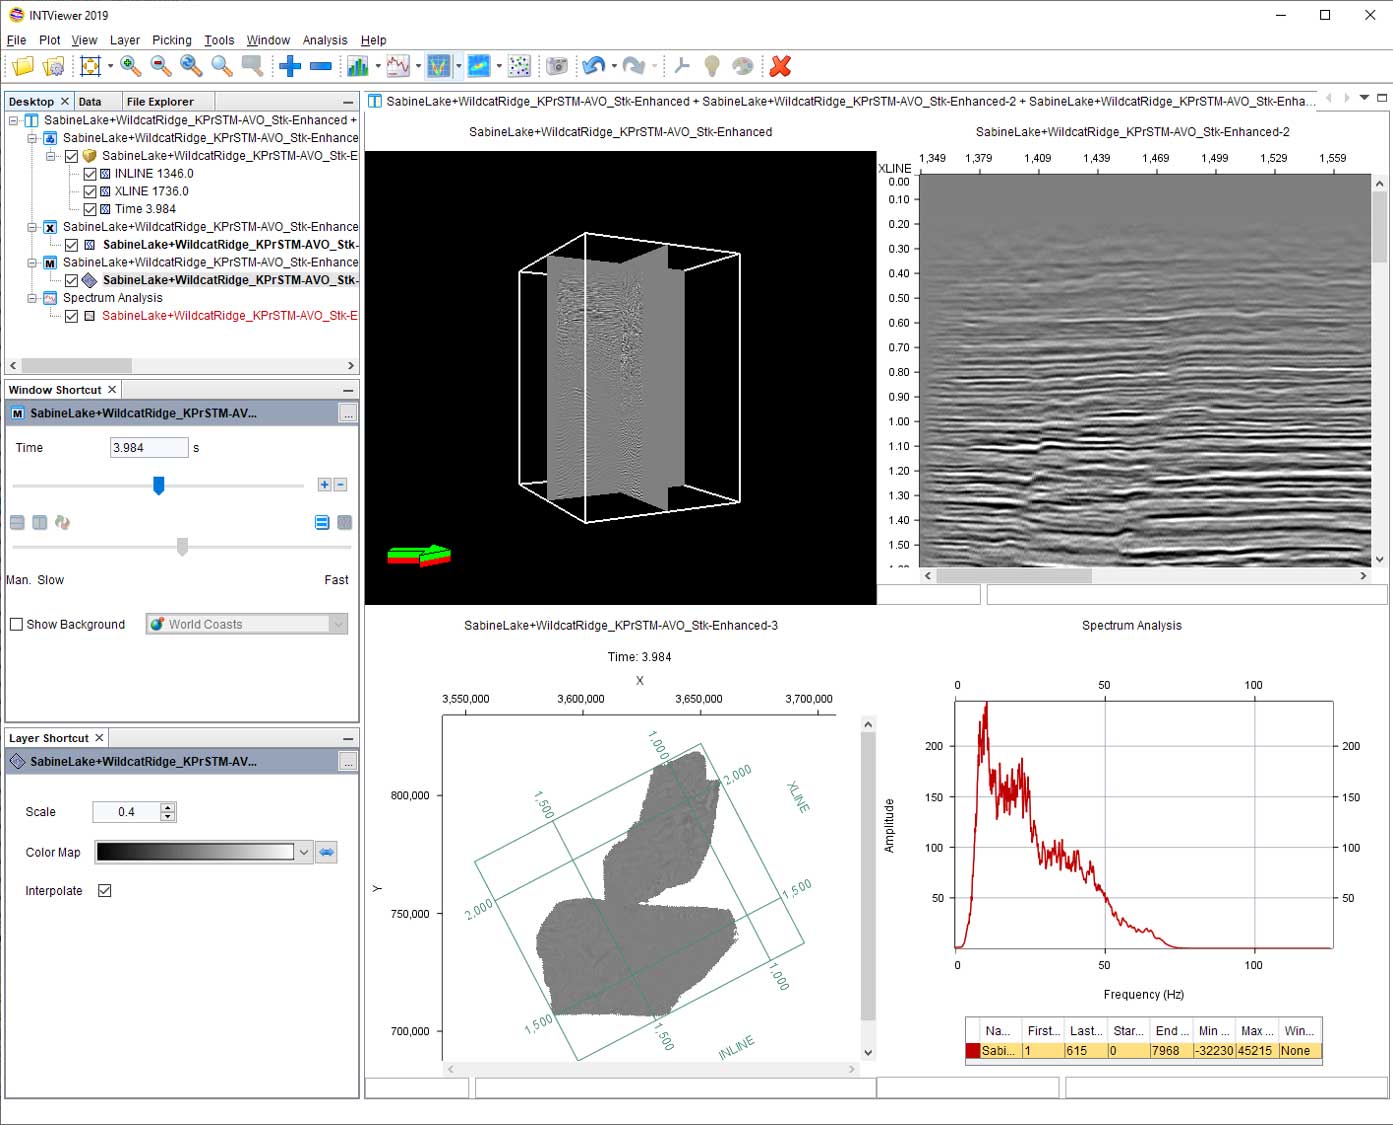
There are many more shortcuts to INTViewer than just the ones showcased in this article. (The ability to save the state of the desktop to session files is one!) But hopefully, both casual and power users of INTViewer will have discovered a new way to enhance their productivity with these tips. And if you’d like to suggest a new shortcut, we’re listening! Just email us at support@int.com.