Delivering Efficient Visualization to Optimize and Streamline Operations with IVAAP™
“One of our clients urgently required information on simultaneous visualization of some parameters, so they compared our Octopus platform—with integrated IVAAP functionality—with another software to see which platform allowed them to have the easiest, fastest, and most accurate response in one dashboard. Octopus was the ONLY platform that allowed them to include the required curves and analysis without needing to call a specialist.”
—Eilyn Rivera, Business Development Liaison, Bardasz
Accelerating and optimizing the development of a visualization platform is one of the biggest challenges in the oil & gas industry. Companies must balance choosing the right software with the right advanced capabilities with a smooth, intuitive user experience to ensure their engineers can focus on analyzing their data and streamlining operations.
Over the past several years, Bardasz has been developing, with its team of real-time data experts, the Octopus™ platform to provide customers with the right data at the right time while making sure the proper data governance and data quality, reliability, and interoperability are in place.
The goal of the Octopus project was to allow Bardasz’s team of developers and architects to customize dashboards according to the user’s needs, making the tools for data management, visualization, and analysis more efficient, as well as optimizing delivery times to the end customer. They also wanted a way to evaluate and monitor the data quality of all input streams and formats, such as WITSML, OSDU, LAS, MongoDB, among others.
Solution: Integration of IVAAP to Assess and Monitor a Variety of O&G Upstream Data
Finding the platform that could meet all of these needs without requiring significant development or implementation out of the box was not easy. After Bardasz tested the IVAAP platform, they decided to integrate it. The result was a seamless integration between Octopus and IVAAP that allowed them to quickly customize and extend the platform using the IVAAP back-end and SDKs, domain API, powerful widgets, and dynamic UI.
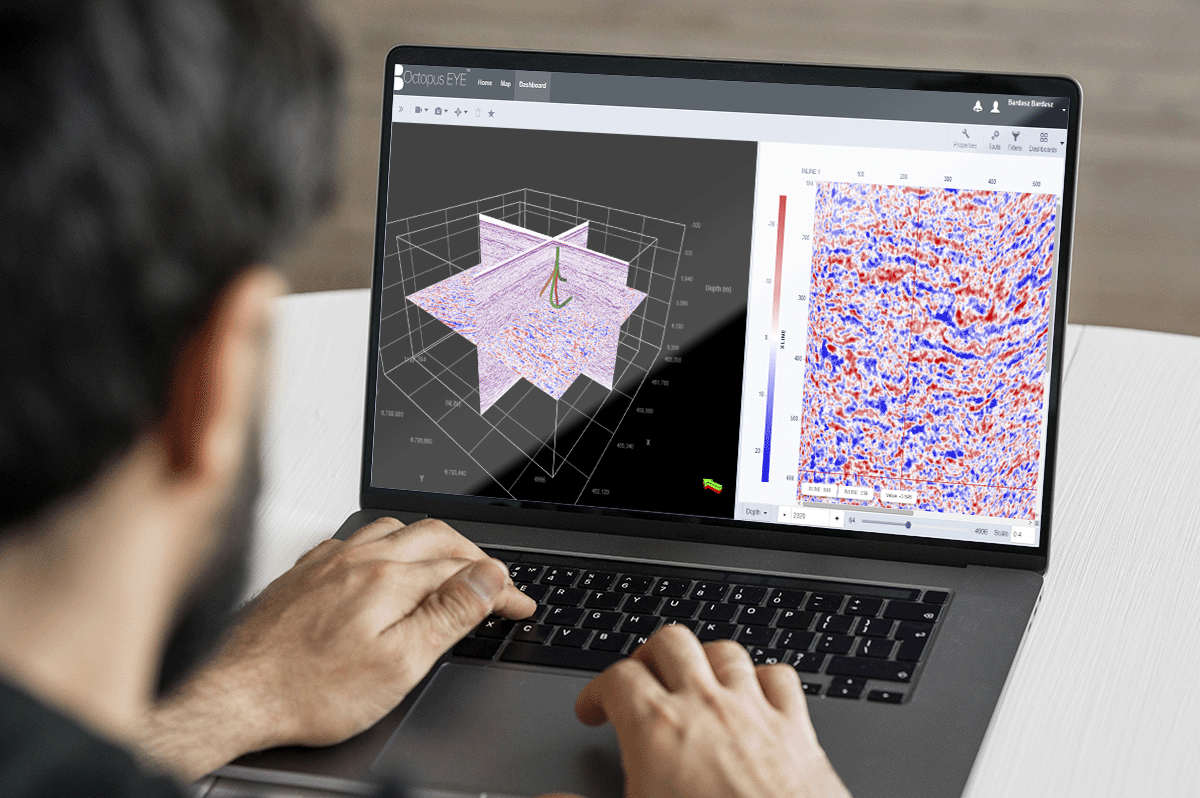
Managing seismic data from a well in the field can be difficult due to the size of the files and the robust equipment needed to access those files. However, with IVAAP, Bardasz is able to visualize their clients’ high-density data—such as a seismic cube—simply and quickly from any computer, tablet, or cell phone.

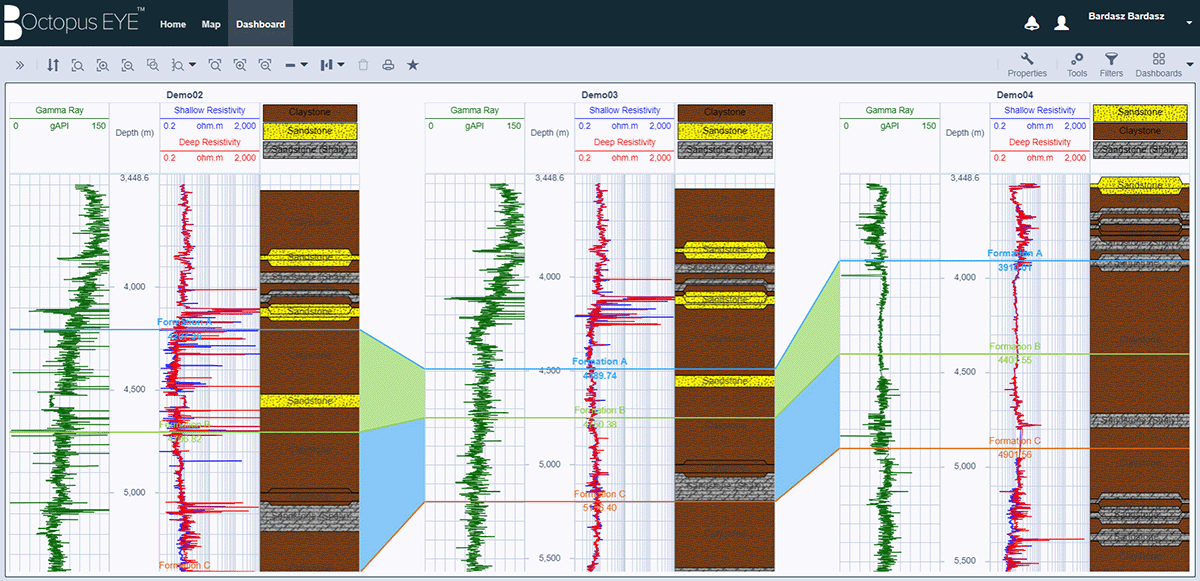
With the implementation of IVAAP, Bardasz can access and visualize a variety of O&G upstream data, including but not limited to: seismic, log, and schematics. As some platforms may include some types of data, but not all of them, this has allowed Bardasz’s customers to correlate more information simultaneously, obtaining a complete picture of the operation.
Benefits: Robust Platform to Securely Manage Any Real-Time Challenge
Bardasz, a company focused on innovation and delivering solutions to meet the real-time needs of their clients, has become a critical partner for companies wanting to accelerate the transition to digital oil fields and intelligent drilling systems. They are recognized for helping to drive the development and adoption of industry data transfer standards within the upstream sector.
Implementing the IVAAP visualization platform in Octopus has made it easier for Bardasz’s developers and architects to aggregate and display data from any data source, real-time or static, in the cloud or on-premise. More importantly, it has allowed them to offer many standard data connectors, and it provides them with powerful APIs and SDK to develop custom connectors for their platforms according to the client’s needs.
As for their clients, IVAAP has allowed them to have control over their data coming from the well site, generating calculations, customizing dashboards and reports, and changing scales, curves, and dynamic correlations on the fly, without the need to call a specialist for help, making their decision- making process accessible, intuitive, and more dynamic.
The effort made by Bardasz to enhance their Octopus platform with robust domain visualization has been reflected in their clients’ satisfaction and in the security of their operations. They have been able to optimize their response times, streamline workflows, and analyze any parameter that they want to visualize. All without having to develop the visualization component from scratch.