
CAYROS’ Field Development Planning Tool Enhanced with GeoToolkit Visualization
“Without INT’s GeoToolkit, we wouldn’t be where we are right now with C-Fields. We have high expectations that this tool will become the standard in Field Development planning and that we will be able to accomplish a lot with this tool. There’s nothing in the market like C-Fields right now.”
—Francisco Caycedo, Regional Director Latin America, CAYROS
Optimizing the development and production of a field is a critical component of maintaining wells in the oil and gas industry, but without the proper tools and software, it can be complicated, time-consuming, and error-prone. Siloed teams, delays in sharing information, and incorrect data all make the process more cumbersome and inefficient.
In 2014, CAYROS developed the first iteration of C-Fields©, a field development planning tool that could optimize the FDP workflow, reducing time to complete projects for their clients from one project per year to three projects in six months. Over time, however, this tool needed improvements to fully take it to the next level and expedite interaction between teams and disciplines. CAYROS completed the redevelopment and reprogramming — including new technology, new programming language, new cloud-based architecture, multilingual and multi user capabilities — in-house, which took time and resources. The last piece of the puzzle was to add the visualization components to fully complete the project’s digital transformation.
Adding an in-house fully developed solution for high-performance graphical geoscience visualization would add another two years to the development of the software, delaying the project and potentially risking the market opportunity.
Solution: Robust Capabilities, Faster Time to Decision
CAYROS chose to accelerate their development by leveraging software that was already available, and through their research, they discovered INT.
INT’s GeoToolkit offers robust, complex visualization capabilities for subsurface data that empowered CAYROS to not only accelerate the development of C-Fields, but also to expand the initial scope of the project by taking advantage of the wide range of libraries and widgets included in GeoToolkit.
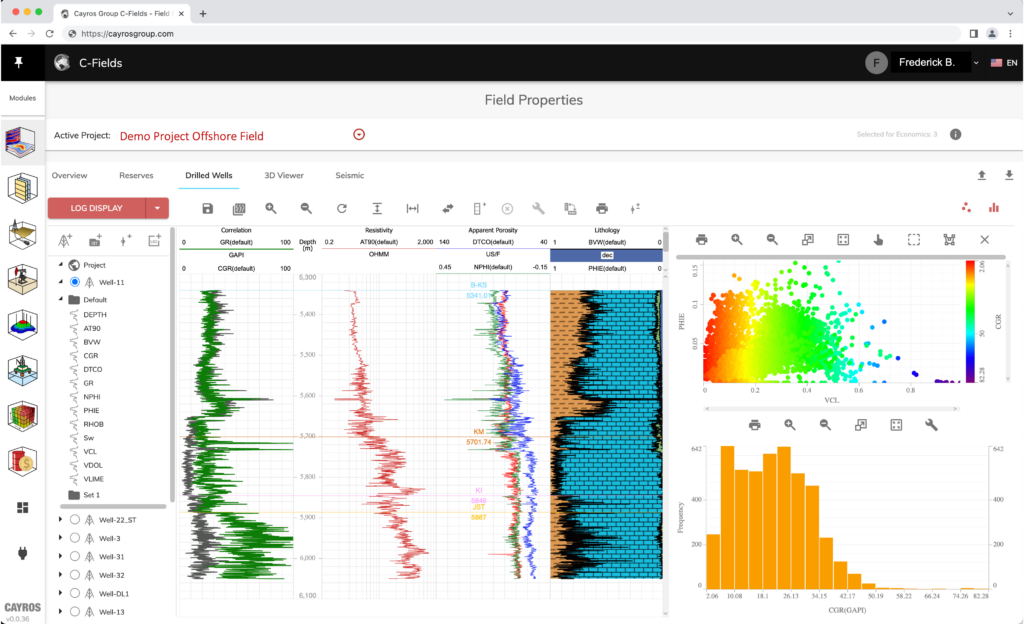
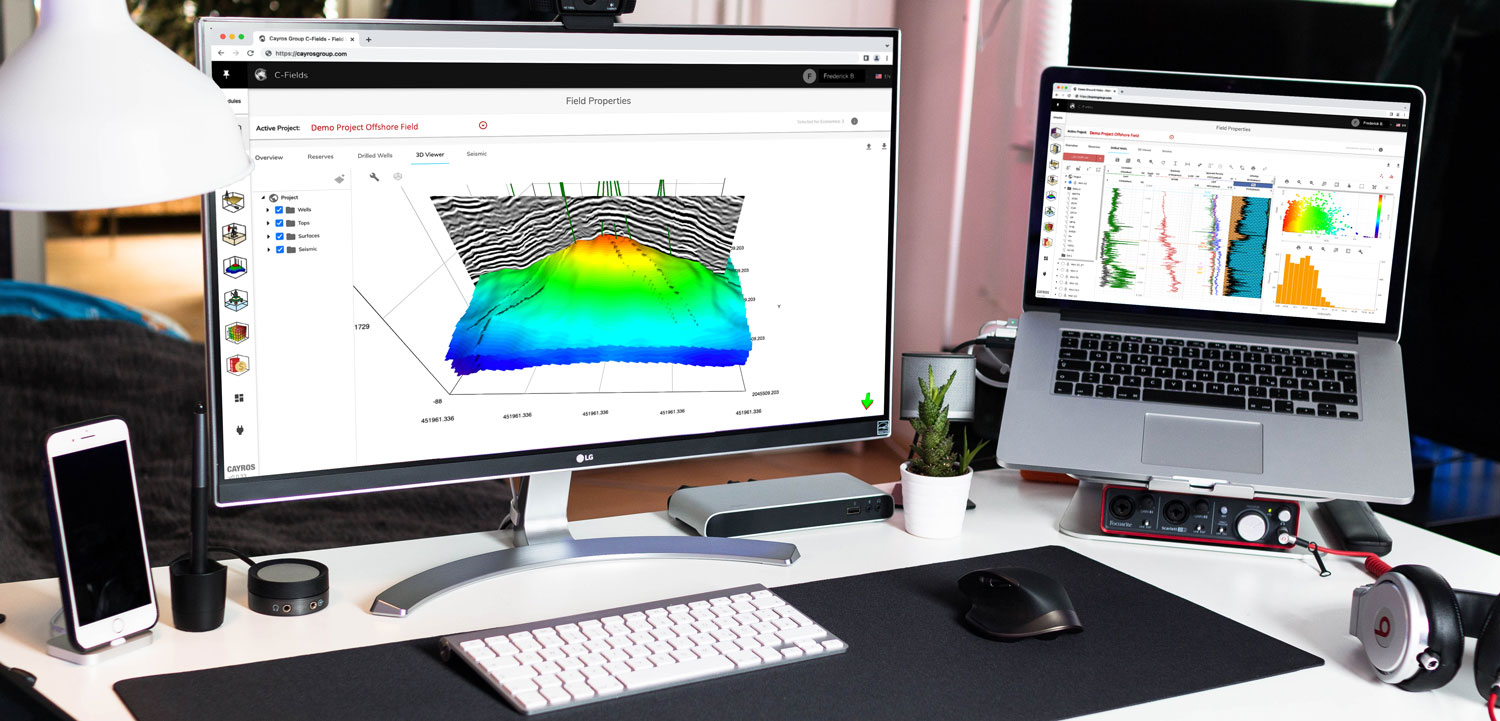
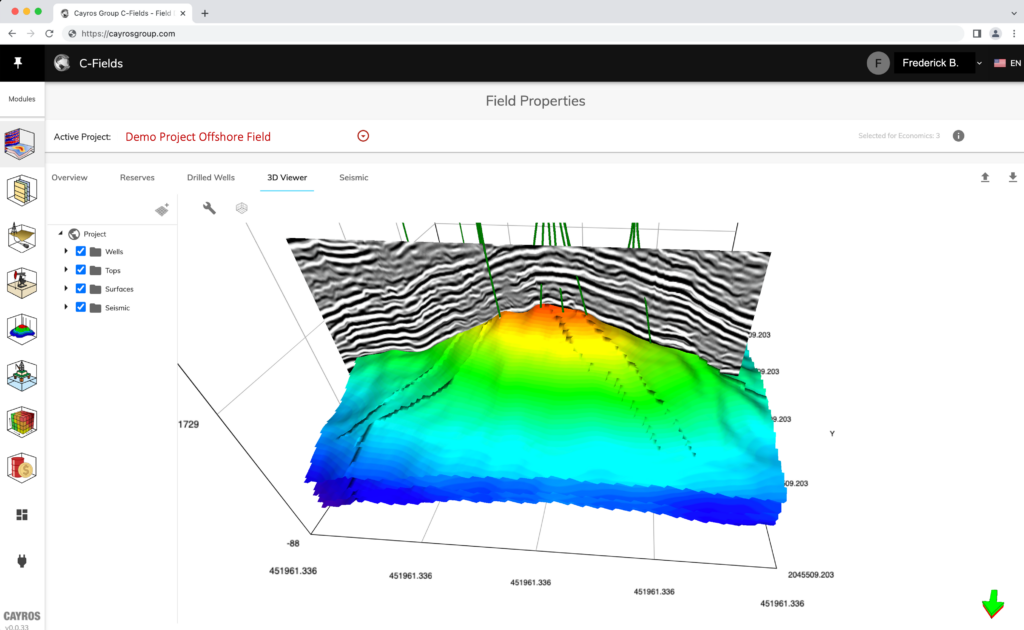
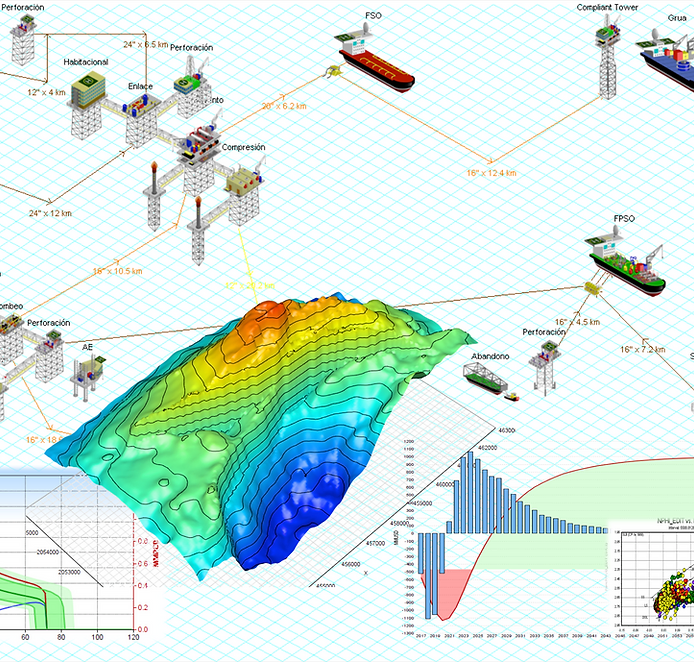
Now, C-Fields takes the information from geoscience, reservoir engineers, artificial lift, surface, risk analysis, and more, generates scenarios, updates all economic indicators on the fly, and allows analysts to complete their analysis in a single environment. By centralizing all subsurface data interactions and visualizations in one cloud-based environment, there is no data transfer and no mistakes in the data, which translates to a lower risk, higher return on investment at a lower cost, fully optimizing field development and planning for their clients.
Benefits: Optimized Field Planning and Recovery
C-Fields has the potential to significantly improve the planning phase of field development for offshore projects. The technology behind C-Fields was designed to assist companies with making better decisions faster and more confidently. The ability to generate and analyze multiple scenarios systematically ranked, enables proper planning and time optimization, reduces the margin of error, and helps to mitigate some of the risks inherent to the industry.
Backed by INT’s visualization, C-Fields removes bias and ensures that a trusted methodology is applied consistently across all fields. It reduces time and cost and minimizes risk, allowing companies to make the best data-driven decisions for the field.
Interactive Network Technologies, Inc. (INT), provides Data Visualization software using the latest technologies such as HTML5 and JavaScript to create cloud-enabled and mobile-responsive solutions and platforms for the leading oil & gas and service companies. Our expert visualization solutions offer unparalleled flexibility for both scientific industries and business, and our web-enabled display technologies empower best-in-class business applications for seismic acquisition, geoscience, well intelligence, drilling, production, asset management, and more. Visit int.flywheelstaging.com or email info@int.com to learn more.