Democratizing Machine Learning and AI for Production Optimization and Carbon Footprint Reduction
“IVAAP is the best visualization solution on the market, with the most options for customizing workflows, and for what we want to accomplish, the visualization element is critical. We looked at other software and commercial platforms, but if you want to display oil and gas data, INT is the best choice.”
—Jean-Paul Dessap, CEO, Maillance
Maillance is a global Software-as-a-Service company working to empower oil and gas companies to optimize production and reduce carbon footprint through integrated, collaborative augmented intelligence (AI) business applications.
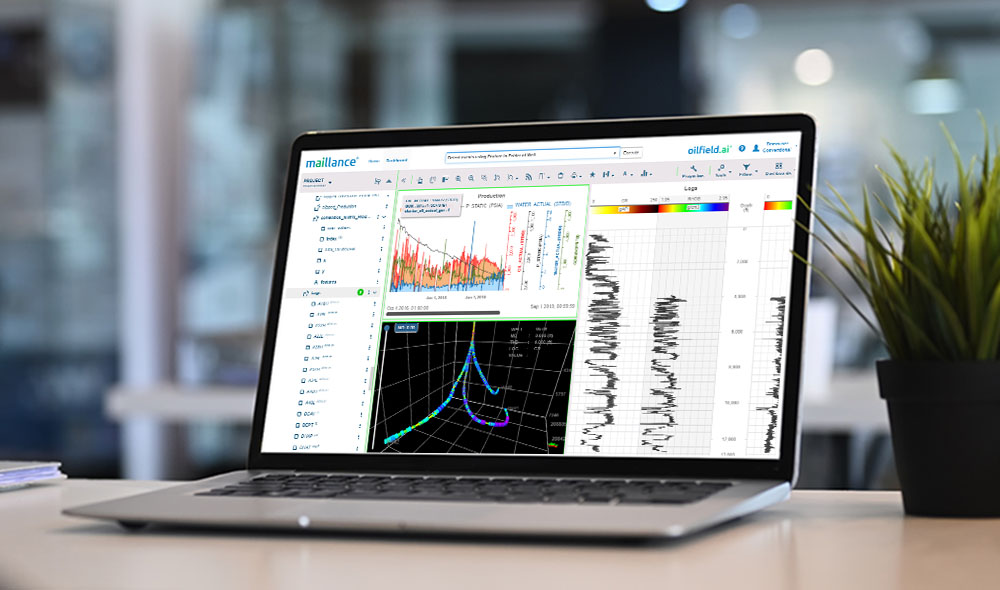
As part of this initiative, Maillance wanted to create high-performance predictions in a cloud-native software solution for their clients that would help them visualize the inputs and results of their hybrid machine learning algorithms. Since their expertise is in AI, not data visualization, Maillance wanted to find a platform that could visualize a variety of specialized domain data out of the box and could be customized to fit their unique needs easily. Maillance had developed the processing and data curation workflows, so the key was to find the right visualization solution so they could offer clients this service to prepare their data in a frictionless manner and quickly view the results of running Maillance algorithms on them.
Solution: Advanced, Cloud-Native Visualization Platform with Dynamic UI
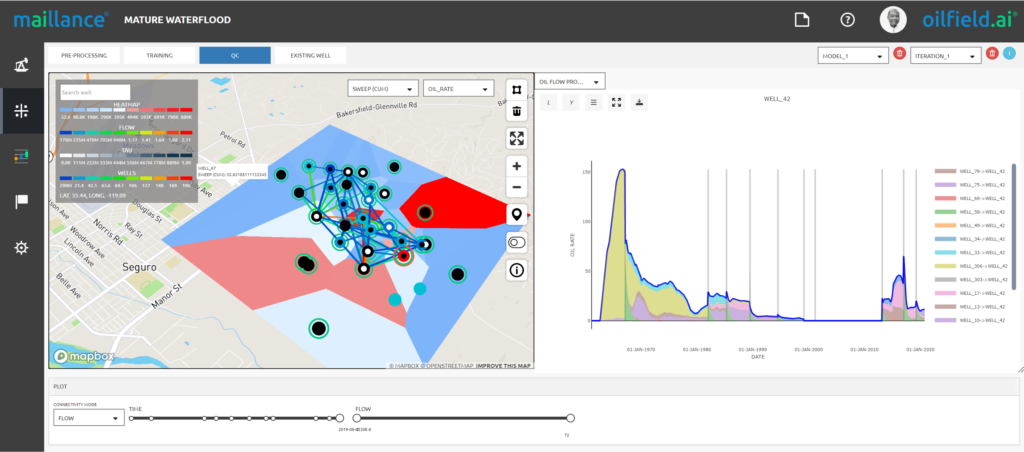
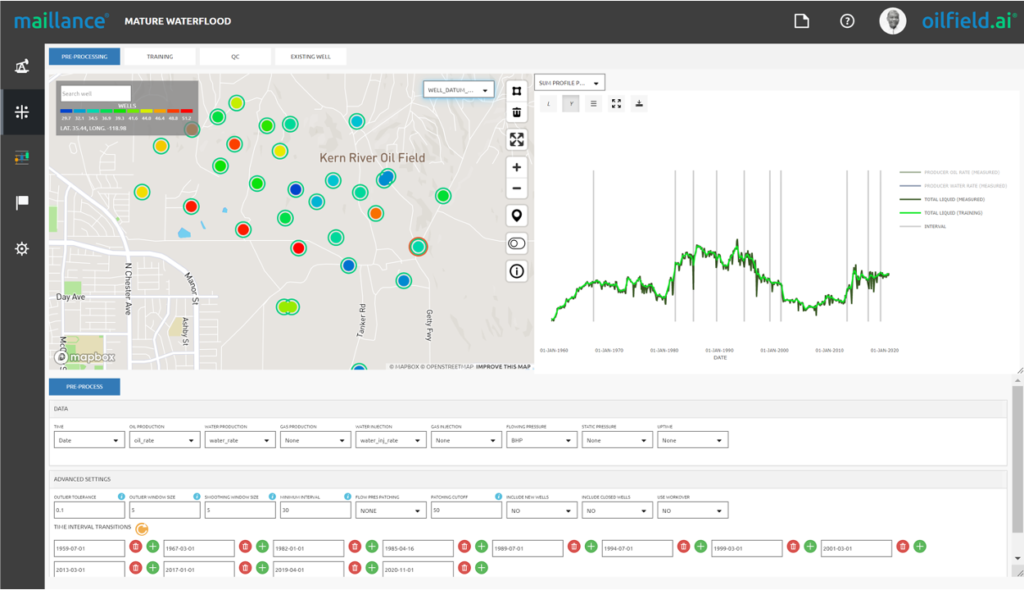
Searching for a solution that could integrate diverse, multi-domain input data, predict and display ML results in seconds, and visualize optimized scenarios in near real-time, all in the cloud, seemed a tall order for most business intelligence platforms.
Maillance learned about IVAAP from a major oil and gas company with a long-standing relationship with INT. IVAAP’s SDK, data connectors — including to the OSDU™ Data Platform — and integration environment were attractive differentiators that positioned IVAAP to be the best option to empower Maillance to quickly customize a platform.
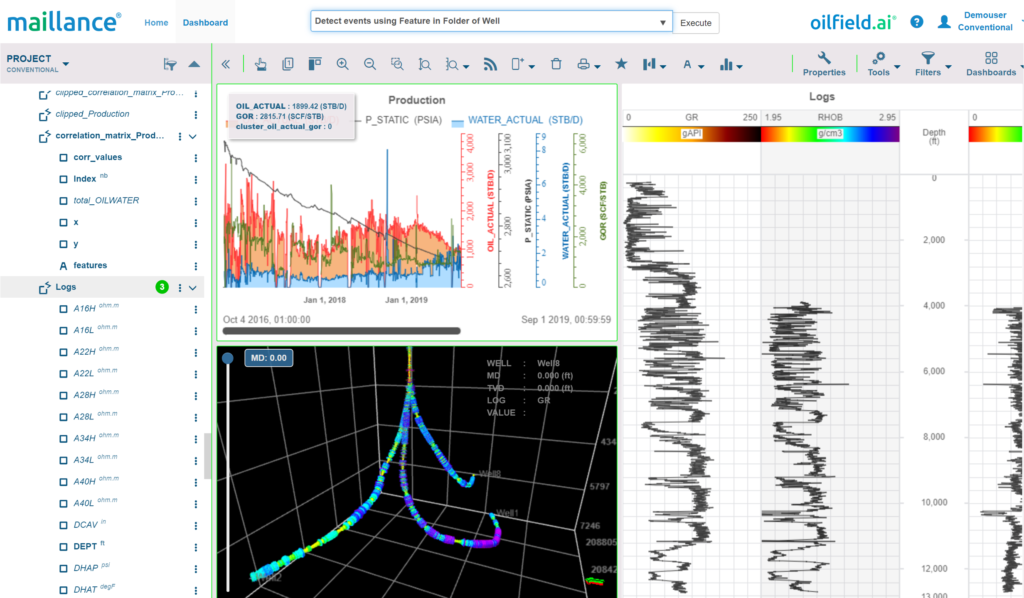
Out of the box, IVAAP offers the ability to deliver new models continuously and scale to meet any number of users in a variety of cloud and cloud-hybrid environments. Backed by a strong team of engineers with specialized expertise, IVAAP can be customized to work with nearly any data type to display advanced domain data in 2D and 3D.
Results: Fast Visualization of End-to-End ML/AI Workflows
Within a short period of time, Maillance worked with INT’s engineering team to add a layer of automation of data processing, cleansing, and preparation and aggregation to IVAAP’s robust data visualization UI. All the data — input data and curated data — is loaded into IVAAP, visualized, and processed to prepare it for the application of Maillance algorithms. Once the user is satisfied with the preparation rendering of his data, the files are pushed into the Maillance predictive space, which integrates the processing algorithms and predictive tools developed by Maillance.
Using INT’s IVAAP meant that Maillance — without committing significant time and money to build their own data visualization solution from scratch — could offer their users a comprehensive solution with one of the most advanced visualizations on the market. Working closely with INT also opened the door for more interesting workflows to be developed in the near future, an opportunity not available with standard BI tools.
Watch Maillance CEO Jean-Paul Dessap describe working with INT:
Learn more about Maillance and their oilfield.ai solution at oilfield.ai.
See how IVAAP offers a rich diversity of connectors to a comprehensive set of industry data sources and domain-specific visualization widgets to represent nearly all E&P data types with a free demo.