• Skip to main content
  • Skip to footer

INT

Empowering Visualization

COMMUNITY BLOG
CONTACT US SUPPORT
MENUMENU
  • Solutions
    • Overview
    • Real-Time Visualization
    • Visualization Components
    • New Energy Visualization
    • OSDU Visualization
    • Machine Learning
    • Developer Tools
    • Cloud Partners
  • Products
    • IVAAP™
          • SOLUTIONS

            Real-Time Visualization

            OSDU Visualization

            Visualization Components

            New Energy Visualization

            Upstream Data Visualization

          • SUCCESS STORIES

            WEATHERFORD
            Well delivery optimization software

            BARDASZ
            Data management, data quality monitoring

            ANPG / SATEC-MIAPIA
            Virtual data room

            MAILLANCE
            High-performance visualization of ML algorithms

            SEE ALL >

          • SUPPORT

            DEVELOPER COMMUNITY
            Join or log in to the INT Developer Community.

            GET SUPPORT
            Log a ticket for an issue or bug.

            CONTACT US

          • DEMOS

            IVAAP DEMOS
            Cloud-Based Demos

            FIRST TIME HERE?
            Register to access our
            IVAAP demos

    • GeoToolkit™
          • SUCCESS STORIES

            CAYROS
            Field development planning

            TOTALENERGIES
            High-performance large dataset reservoir rendering

            IFP ENERGIES NOUVELLES
            Seismic and structural interpretation validation

            SEE ALL >

          • SUPPORT

            DEVELOPER COMMUNITY
            Join or log in to the INT Developer Community.

            GET SUPPORT
            Log a ticket for an issue or bug.

            CONTACT US

          • DEMOS

            GEOTOOLKIT DEMOS
            Geoscience Demos

    • INTViewer™
          • SUCCESS STORIES

            STRYDE
            Fast seismic QA/QC in the field

            SILVERTHORNE SEISMIC
            Efficient 2D/3D seismic data delivery

            WIRELESS SEISMIC
            Drones, IoT, and Advanced Onsite Seismic Data Validation

            SEE ALL >

          • SUPPORT

            GET SUPPORT
            Log a ticket for an issue or bug.

            CONTACT US

          • PLUG-INS

            EXTEND INTVIEWER
            More than 65 plugins available

  • Demos
    • GeoToolkit Demos
    • IVAAP Demos
  • Success Stories
  • Resources
    • Blog
    • Developer Community
    • FAQ
    • INT Resources Library
  • About
    • Overview
    • News
    • Events
    • Careers
    • Meet Our Team
    • About INT
Experience Interactive INT Visualizations

Interactive IVAAP Demos

CONTACT US

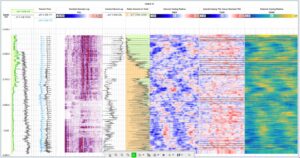
Well Cement and Casing Integrity

IVAAP
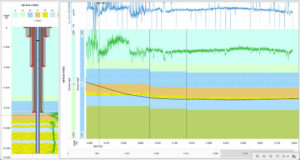
NEW demo! This example of well cement and casing integrity uses sonic tool (DSLT) and ultrasonic tool (USIT) using data from the Volve Data Village dataset.
EXPERIENCE IVAAP

Geosteering with Schematics

IVAAP
NEW demo! Easily combine horizontal well sections with vertical projection and schematics to help with geosteering and more.
EXPERIENCE IVAAP

3D Poseidon

IVAAP
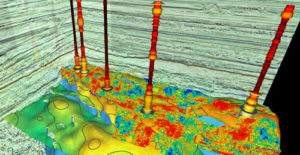
Aggregate data to combine 3D seismic, contour, reservoir, well log, and more in one dashboard.
EXPERIENCE IVAAP

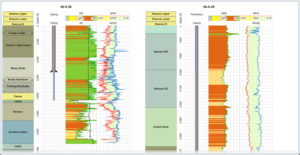
Complex Well Correlation

IVAAP
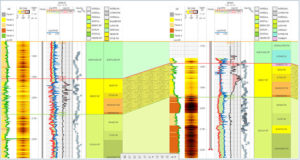
Combine into a single template: well log curves, formation dips, lithostratigraphy, facies and casing information, and markers.
EXPERIENCE IVAAP

Production Dashboard

IVAAP
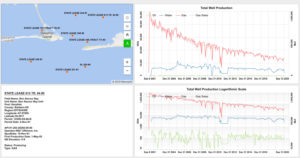
Monitor total well and total well logarithmic production with this IVAAP dashboard using the Alabama dataset.
EXPERIENCE IVAAP

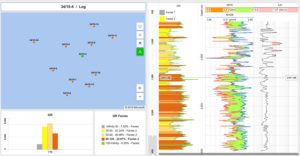
Map Interface and Well Logs

IVAAP
View map data, logs, charts, table data, and more in this dashboard using the North Sea dataset.
EXPERIENCE IVAAP

PPDM – Stratigraphic Column

IVAAP
With IVAAP, you can combine all your data—casing, log, map, and more—in a single dashboard.
EXPERIENCE IVAAP

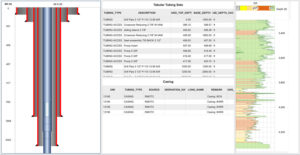
Well Design/Architecture

IVAAP
Using PPDM data, this dashboard combines schematics, table data, logs, and charts all in one view.
EXPERIENCE IVAAP

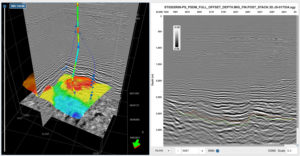
Interactive 2D/3D Dashboard

IVAAP
This IVAAP dashboard combines 3D seismic and well logs using the Volve dataset.
EXPERIENCE IVAAP

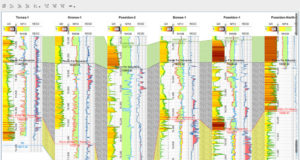
Well Correlation

IVAAP
This well correlation dashboard combines well logs, 3D wells, and map views with table data using the Poseidon dataset.
EXPERIENCE IVAAP

Ready to get started? Contact us today for a free demo/trial!

REQUEST LIVE DEMO/TRIAL

Footer

Solutions

  • Real-Time Visualization
  • Visualization Components
  • New Energy Visualization
  • OSDU Visualization
  • Machine Learning
  • Developer Tools
  • Cloud Partners
  • Customer Success Stories

Products

  • IVAAP
  • GeoToolkit
  • INTViewer
  • IVAAP Demos
  • GeoToolkit Demos

About

  • News
  • Events
  • Careers
  • Management Team

Resources

  • Blog
  • FAQ

Support

  • JIRA
  • Developer Community

Contact

INT logo
© 1989–2024 Interactive Network Technologies, Inc.
Privacy Policy
  • Careers
  • Contact Us
  • Search

COPYRIGHT © 2025 INTERACTIVE NETWORK TECHNOLOGIES, Inc


Visualization for OSDU with IVAAP

Register now to access all of our IVAAP demos—production, well correlation, energy, seismic, 3D, and more. Once you sign in, you’ll have view-only access to the demos for 7 days.

Already registered? Login Here