IVAAP:
The Next-Generation Upstream Data Visualization Platform
IVAAP™ is built to empower product owners, developers, and architects to accelerate the development of subsurface digital solutions for energy.

Scalable, Cloud-Ready HTML5 Enterprise Visualization Framework
IVAAP is a data visualization and collaboration platform designed specifically for the energy industry. It is designed to work with the OSDU Data Platform and provides a unified view of all subsurface data from multiple sources. Rather than develop a new application from scratch, companies can customize and implement IVAAP in their organization in a fraction of the time. Deployable in any environment (private, in cloud, Docker, hybrid etc.), IVAAP can scale to meet the needs of tens to thousands of users. INT has partnered with the OSDU™ Consortium and made the IVAAP platform available as part of the OSDU Mercury Release.
Benefits

Adopt Advanced Visualization as a Shared Service
Support multiple exploration, drilling & production workflows in one platform
Architects and developers can leverage IVAAP’s flexible architecture and standard APIs to build digital solutions that use the same HTML5 visualization technology to create diverse workflows. These workflows satisfy each group’s requirements: explorationists, drilling engineers, and anyone who needs to display complex, domain-specific data with the functionality to centralize, aggregate, search, and interact with different data types—seismic, well log, schematics, drilling, real time, and more—in one browser.
Empower Your Digital Transformation with ML/AI
Enable Integrated ML and AI Workflows
The current industry focus is on improving subsurface characterization and finding better opportunities through machine learning (ML) and artificial intelligence (AI). Product owners can accelerate time to delivery by integrating IVAAP to search and visualize geophysical, petrophysical, and production data, select the right data, launch their analytics, and visualize the results. Plug your data science and automate various analytical tasks, including picking, crawling, and more. IVAAP integrates with any ML or processing service to build, train, and deploy ML models to help make better use of data.


Visualize Your Data in Real Time
Accelerate Development of Real-Time Solutions
Augment your digital applications in the cloud with powerful real-time data visualizations. Connect to your WITSML™ server and other real-time production or drilling data sources to access and visualize offset well databases, and geological and geophysical data, all in one platform. Provide your users with the ability to build comprehensive and interactive dashboards to view time- and depth-based data — well logs, surveys, gauges, line charts, BHA and drill-string components, crossplots, pie charts, well location, tool-face screens, and more.
Develop the Right User Experience in the Cloud
Extend the platform with IVAAP’s powerful SDKs
Developers can rely on IVAAP’s intuitive user interface to deliver higher user adoption, as well as its robust SDK to extend and scale functionality. Create data connectors to seamlessly integrate with external frameworks or add and remove existing modules to create a solution that perfectly fits your needs. Upload data, choose your datasets, select dashboards, and create custom dashboards and templates to analyze and share findings with your team, all without involving your IT department. And IVAAP’s robust Admin means complete control over which users can access which data.

Features
Your Own IP, Science, & Workflow
Integrate your proprietary workflows, data, and analytics to create a complete digital application that can be deployed on a private server or in the cloud.
Powerful Admin/Security
Manage users, projects, and data connectors quickly and easily with IVAAP’s robust admin interface. IVAAP includes various security features, including the ability to monitor usage.
Geoscience Data Integration
IVAAP aggregates and streams multiple data sources simultaneously in real-time, including WITSML and Peloton. And INT’s INTGeoServer distributes seismic, well data, and more securely over the web.
Microservices Architecture
IVAAP leverages microservices technology to allow users to extend the system, augment functionality, and integrate with services and application stacks.
HTML5 Domain Visualization
A browser-based HTML5 client leverages all proven GeoToolkit libraries, with drag-and-drop functionality to create custom dashboards so users can see and analyze their data at a glance.
Simplified Deployment
Deployable on-premise or on your cloud tenant, IVAAP enables DevOps and Agile Dev with a simple approach to deployment using a Docker Engine or Kubernetes.
IVAAP Cloud Partners
IVAAP is deployable on all the major cloud providers: AWS, Azure, GCP, and IBM Red Hat OpenShift. IVAAP supports each cloud provider’s integration with the OSDU Data Platform. IVAAP offers the highest performance of any data visualization platform on the market by optimizing large data volume access to S3 Bucket, Google Bucket, Blob storage. and Red Hat OpenShift to ensure better performance for our customers as they transition to cloud storage. As the industry undergoes a digital transformation, IVAAP offers a hybrid cloud/on-premise deployment option to help bridge the gap between cloud and legacy applications. IVAAP can also be deployed on-premise if a no-cloud option is preferred.


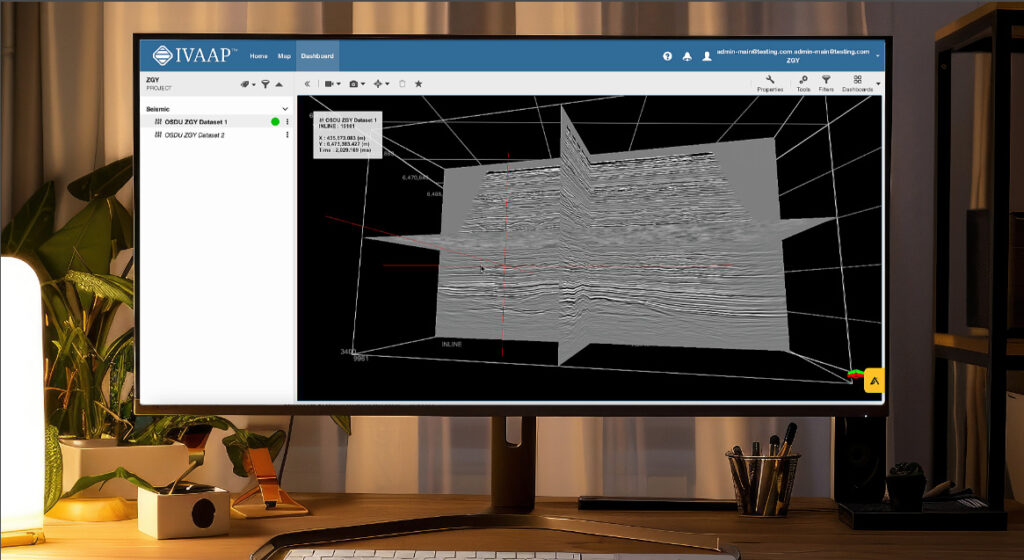
What Is IVAAP?
- Advanced upstream visualization platform with intuitive user-defined dashboards for engineers, geophysicists, and managers
- Display most common domain data formats such as DLIS, LAS, SEG-Y, and VDS
- Simplify connections to data sources with an API and SDK
- Create custom workflows with visualizations that can be modified, extended as needed, and/or embedded in your digital application
IVAAP Architecture Components:
Domain Visualization, Real-Time, Microservices, and Security
IVAAP is a highly flexible and customizable platform, allowing developers to modify or eliminate existing implementations through the use of its Software Development Kit (SDK). The SDK comprises a JakartaEE container (such as Apache Tomcat), compiled Java libraries in the form of .jar files, sample code, Java API Documentation (including JavaDoc and a wiki), as well as REST Web service documentation following the Swagger/OpenAPI specification. This comprehensive toolkit empowers developers to effortlessly incorporate their own data sources and web services, thereby creating a truly bespoke platform in a fast and streamlined manner.
The backend of IVAAP can be deployed in two distinct ways. Firstly, by leveraging the Play framework, developers can take full advantage of cutting-edge technologies optimized for concurrent and distributed deployments. Alternatively, the JakartaEE container can be utilized as a deployment option. Both approaches offer robust and reliable backends for the IVAAP platform.
To ensure the security and protection of proprietary data, IVAAP includes a range of advanced security features. These features encompass SAML (Security Assertion Markup Language), Single Sign-On (SSO), two-factor authentication, Active Directory integration, and more. These security measures collectively safeguard sensitive information within the IVAAP ecosystem, granting users peace of mind.

Discover IVAAP Architecture on OSDU

AWS Video Series:
This Is My Architecture
Discover the remarkable seismic data visualization platform, IVAAP, developed by INT for Oil and Gas exploration. Gain valuable insights into the architectural aspects of this innovative solution as INT’s own expert, Steven Reynolds, shares his expertise in an engaging video series hosted on AWS.
Ready to see IVAAP in action? Request a free demo today!
IVAAP Features and Functionalities
Support for single-data, multi-data, multi-parent mode
Time or depth-indexed data
View log curve/array curve / discrete curve
Array log vertical interpolation
Log curve line/symbol/value with micro-positioning
Lithologies, annotations, stacked curves, tops, schematics, perforations, casing
Open Hole section
Real-time updates with ascending or descending depth index
Vertical/horizontal orientation
Tadpole
Symbol color filling
Autofit to quickly scan multiple wells
PDF Printing
Curve value tooltip at the cursor position
Cutoff mode
Multiple index with different unit
Drag & Drop a log to display all curves
3D View
2D seismic, multiple inlines, crossline, time slice/depth slices, arbitrary line
Surface map, horizons, faults and fault sets, reservoir grid, and properties
Wellhead, well tops, correlation, and trajectory fence
Trajectory line & tube
Survey stations
Drag & drop multiple objects from the data tree
Curve tube, cylinder log, and plane log
Inlines/crosslines and horizons, surfaces, faults, triangle mesh, reservoir
Highlight selected object
Property change to objects
Trajectory vertical elevation
3D crosshair with projection on 2D plans
AGC noise reduction
Data with no CRS
Seismic support for transparency
Contour lines on horizons and grid surfaces
Well casing, casing shoe, tubing, perforations
Calculate reservoir volume
Seismic support for ZFP compression
2D Seismic
Inline, crossline, horizons
SEG-Y / SU / SEP / JavaSeis / ProMAX / SEGD / SEG2 / OpenZGY / OpenVDS
Seismic compression
Seismic survey
Wiggles
Variable and interpolated density
Positive and negative fill with solid color or gradient
Reverse polarity and gradient option
Display gaps in seismic profile
Binary/EBCDIC copy to clipboard
EBCDIC information
VDS 2D dataset support
Header information dialog
Filter / AGC / Reverse processors
Fault display support and editing
Support for ZFP compression and overlay display
Seismic data spectrum
Multiple parts of data in one chart
Time and depth domain data
Amplitude, dB Linear, Phase, Wrapped Phase, Power Modes
Filtering / Windowing / Smoothing / Phase Trend Removal processors
Time Series Chart
Display one or multiple time series
Drag & drop log displays all curves
Change the display order of data series
Well Section
Vertical fence (TVDSS v. Measured Depth)
Option for project ahead trajectory display
Seismic background
Welllog template
Well tops
Correlation Display
Add/remove wells
Apply well log template
Zoom in/out individually or all wells
Scroll up/down individually or all wells
Reset well position
Synchronize spacing between wells
Apply well log template
Horizontal scale
Add/remove tops
Raster log support
Switch raster log
Curve dictionary and curve aliases
Create correlation fence from Correlation widget and edit in Map widget
Interval name in top state definition
Ghost curve
Align Wells to top or bottom measure depth
Definition for colors and pattern created from displayed tops
Switchindex between MD, TVD, TVDSS
Top unconformity
Display well group in well header
Flatten on top
Flatten on index value
Print to PDF
Drilling Status
Real-time BHA position
Zoom in and out
Pre-defined BHAs
Schematics
Display schematic data
Casing, tubing, and BHA
Animated BHA (fluid, debris…)
Cursor tracking with WellLog
Open Hole section and deviated schematics
Tracking with 3D widget
Tabular version display in table widget
Line Chart
XY line chart with option for markers display
Multiple data series
Wellpath in 3D View widget
Annotations
Log curve
Multi-dataset
Real-time updates
State definitions
Lock on name
State definition from the widget
Column (filter, align)
Header wrapping
Column sorting
Formatting for each column
Display top set table
Cell wrapping
Pivot table
Calculate statistics
Spreadsheet table
Curve dictionary and Curve aliases
Shapefile and GeoTIFF in tabular form
Drag and drop a log displays all curves
Lock on Type
Duplicated curve names
Map
Web Map Tile Service (WMTS): Google, Bing, OpenStreetView…
GeoJSON
Multiple Feature Layers
ArcGIS Feature layer
Seismic lines
Bing Aerial Maps
Wellhead location
Well correlation fence
Seismic line and wells
Individual or area selection
Shapefiles
GeoTiff
Well symbols
Basemap
Seismic slices, inline, cross-lines
Horizons, grid surfaces, triangle mesh, faults
Reservoir layer
Well locations, well trajectories
Drag & drop multiple objects
Contours & transparency
Export to PDF
Correlation fence line
Create and edit arbitrary lines
Well symbols
Reservoir property support for logarithmic mode
Bar Chart
Discrete curve
Continuous curve with state definition
Table data
Real-time update
Pie Chart
Tabular data
Discrete curve
Continuous curve with state definition
Real-time update
Histogram
Analyze seismic data distribution
Support frequency types: absolute, normalized, relative
Export to PDF
State definition
Curve dictionary and Curve aliases
Calculate statistics
Aggregate table data
Scatter Plot / Crossplot
Third dimension using gradient color or state definition
Curve dictionary and Curve aliases
Regression line linear and non-linear
Discrete editing
Export to PDF
Value Tracker
Log curve value
Multi-dataset
Real-time updates
State definition
Report
Custom reporting dashboards
Tables and metadata
Gauge
Real-time updates
Visual alarms
Gauge types:
Digital
Full Circular
Half Circular
Quarter Circular
Multiple Tracking
Vertical Bar
Horizontal Bar
Real-time gauge to display activity status
Statistic
Support multi-dataset
HTML
iFrame support
Time or Depth indexed data
Display PDF files
Title Widget
Display data set name
Option for free text
Metadata keywords
Image Widget
PNG, JPEG, and TIFF files
Diagram Widget
SVG files
Animations
Dynamic binding
Tabular data
OSDU™
PPDM™
WITSML
OSIsoft PI™
INTGeoServer
Cloud Platforms (AWS, Microsoft Azure, Google Cloud Platform)
ArcGIS Server
Relational Query Access
Import files (CSV, DLIS, LAS, ASCII)
OpenWorks®
ProSource
Peloton WellView® / ProdView®
MongoDB
SQL
CSV
LAS
DLIS
VDS / OpenVDS
RESQML
ASCII
ASCII OSDU
ASCII R5000/OSDU
WITSML 1.3.1 & 1.4.1
TIFF
Raster log (TGS SmartRASTER®)
Seismic dataset
PDF
SEG-Y
OpenZGY
Customized, proprietary formats
TESTIMONIALS
“IVAAP is the best visualization solution on the market, with the most options for customizing workflows, and for what we want to accomplish, the visualization element is critical. We looked at other software and commercial platforms, but if you want to display oil and gas data, INT is the best choice.”
—Jean-Paul Dessap, Maillance
“Considering the current challenges in O&G, companies must look for ways to improve operations and find efficiencies. The IVAAP platform eliminates redundant applications, streamlines data access and analysis, and improves our operational efficiency significantly. We expect to find 30% improvement across the board.”
—Vikash Rambaran Mishre, E&P Information Management & Technology Administrator, Staatsolie N.V.
REQUEST A FREE DEMO
Let us demonstrate how IVAAP can help you and your team deliver powerful upstream data visualization and empower data search, visualization, and ML analysis in your E&P workflows in the cloud with IVAAP.
VIEW LATEST IVAAP RELEASE NOTES
Featured Blog Posts
INT Supports OpenZGY and OpenVDS to Enhance Workflows and Data Collaboration
At INT, we are strong advocates of open data standards in the geoscience realm. Our work with and early adoption of the OSDU Data Platform and our integration of OpenVDS and OpenZGY formats exemplify this dedication.
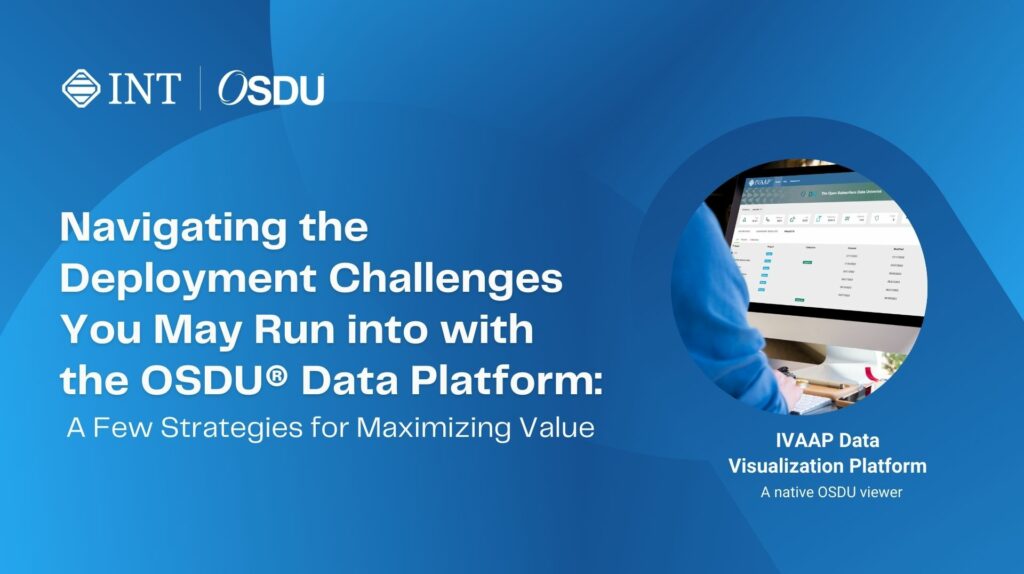
Navigating the Deployment Challenges You May Run into with the OSDU® Data Platform: A Few Strategies for Maximizing Value
Learn how to navigate the complexities of OSDU® Data Platform deployment and transform your oil and gas operations. This blog offers expert insights and strategies to maximize the platform’s value, ensuring a smooth transition.
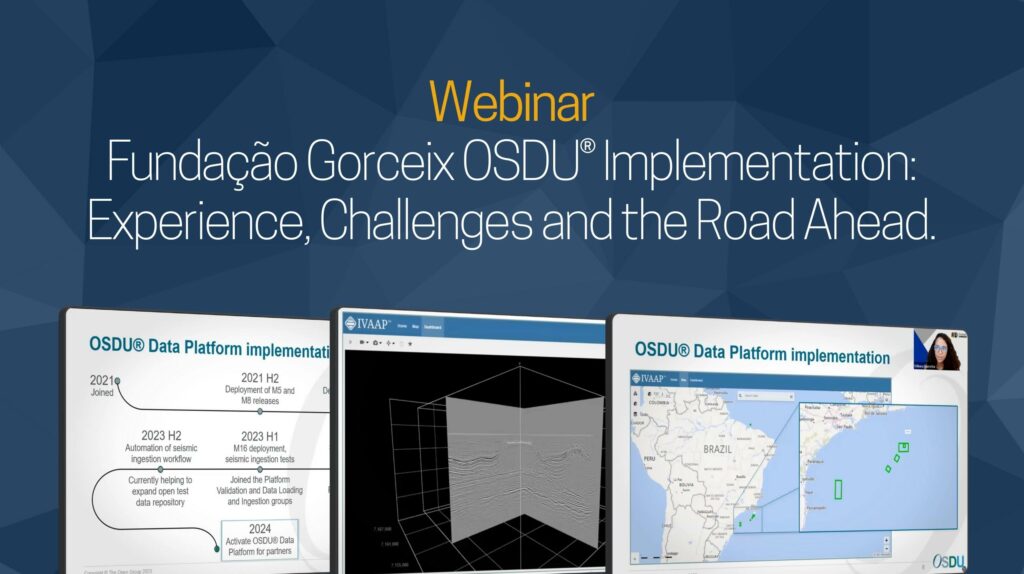
Fundação Gorceix OSDU® Implementation: Experience, Challengers and the Road Ahead.
In our recent webinar, we had the privilege of featuring Débora Ribeiro Barretto, Geophysicist, and OSDU® Focal Point, who shared insights into their OSDU® implementation […]