GeoToolkit
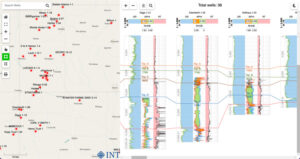
NEW demo! Display more than 10,000+ wells in seconds! Select 1 or more wells on a map to display in the well track.
GeoToolkit
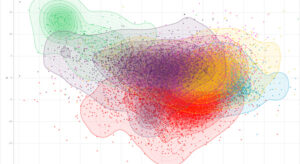
Understand the complexity, relationship, and distribution of your data with this density contour crossplot visualization. Project onto each 2D or 3D space and rotate to see your data from any angle.
GeoToolkit
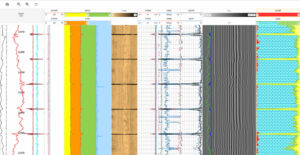
This GeoToolkit demo shows a set of single value curves and array logs from the Volve project, including casing radius, casing thickness, depth, and variable density.
GeoToolkit
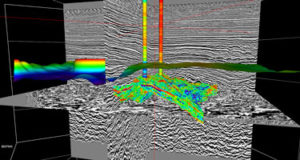
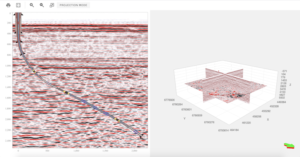
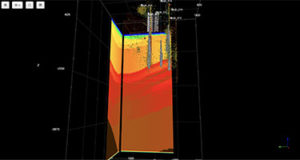
Intersect your 3D reservoir grid with seismic data and add well logs, horizons, and more.
GeoToolkit
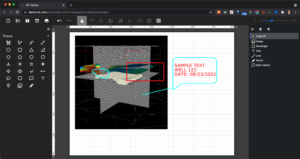
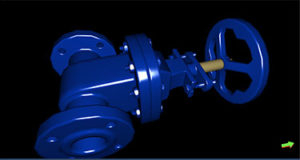
Quickly draw solutions and diagrams, upload images (JPEG), and directly add text labels/comments.
GeoToolkit
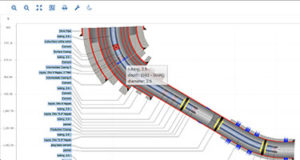
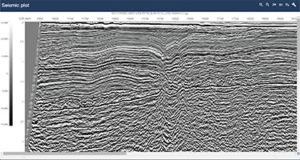
Combining wellbore architecture with seismic profiles, this tool allows you to identify zones of interest in relation to each hole section and cementing sections versus formations crossed.
GeoToolkit
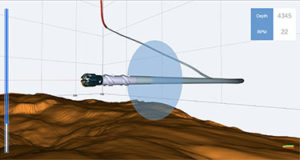
Paired with depth and RPM data, this real-time 3D schematic demo shows an animated view of the directional drilling path to help drillers visually understand the BHA, drillstring, and well casing.
GeoToolkit
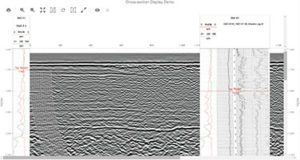
View logs and raster logs and easily overlay deviated logs and more over seismic. Cross-section displays provide insights for well correlation and geosteering.
GeoToolkit
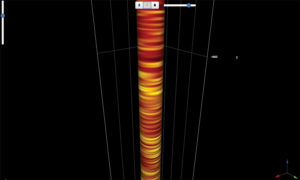
Gamma Ray image log display with 56 channels in 3D built using INT Carnac3D.JS library.
GeoToolkit
3D demo for monitoring microseismic data built with INT Carnac3D.JS library.
GeoToolkit
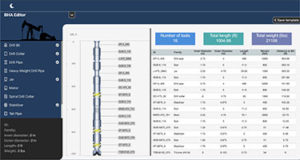
Improved interactive demo to build a bottom hole assembly. Drag and drop new schematic components, rearrange, filter, delete, and save as a template. Includes new dark mode option.
GeoToolkit
Well positioning demo including vertical, horizontal, and 3D log display.
GeoToolkit
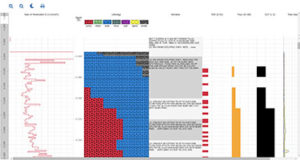
Improved mudlog display, now with export to PDF, better footer and header, and improved lithology.
GeoToolkit
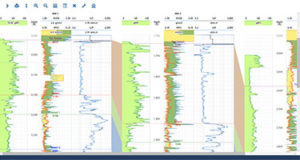
A multi-well demo that shows the ability to correlate well data, use different display templates, and drag and drop curves or wells dynamically.
GeoToolkit
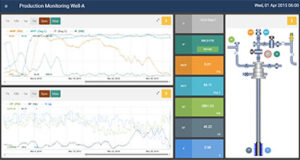
Live time-series well data. Navigate to historical data, synchronize, and add new curves to the plots.
GeoToolkit
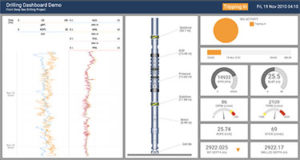
Real-time drilling dashboard built with HTML5 Carnac widgets, gauges, and well log widgets.
GeoToolkit
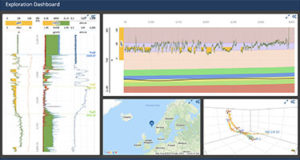
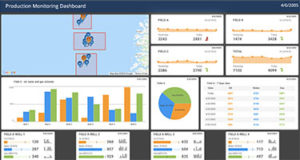
Real-time interactive dashboard built with HTML5 Carnac widgets and Google Maps.
GeoToolkit
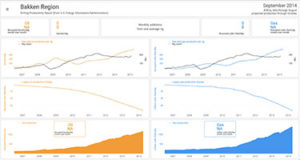
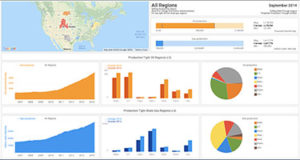
Interactive dashboard built with HTML5 Carnac widgets describing drilling productivity in US tight oil & shale gas regions.
GeoToolkit
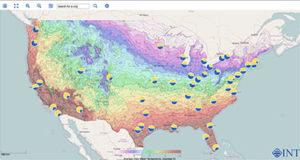
This demo shows the average daily mean temperature across the United States as a contour map. Additionally, pie charts show the average percentage of sunny days by city.
GeoToolkit
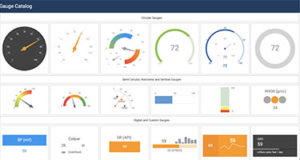
GeoToolkit offers a wide range of gauge types. Choose from our catalog or customize your own.
GeoToolkit
Interactive dashboard built with HTML5 Carnac widgets and Google Maps.