Visualize Your Data in Real-Time
For oil and gas companies, real-time monitoring of drilling and production is crucial to ensure safe and efficient operations. IVAAP data visualization platform can help you achieve this goal by providing you with a powerful and flexible tool to visualize and analyze your drilling and production data in real time.

Accelerate Development of Real-Time Solutions for the Field
A powerful tool that can help you monitor and analyze your drilling and production operations in real-time, IVAAP offers customizable visualizations, collaboration and sharing options, and historical data analysis to help you make data-driven decisions, optimize your operations, and ensure safe and efficient oil and gas production.
Combine Real-Time and G&G Data to Create Powerful Co-visualizations
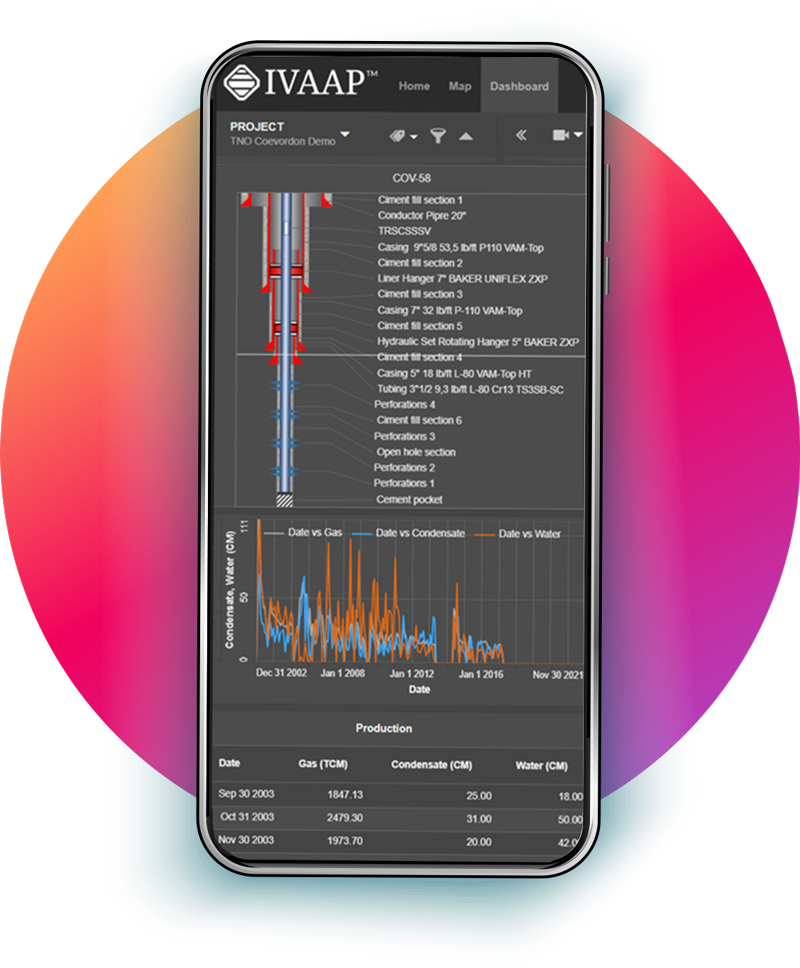
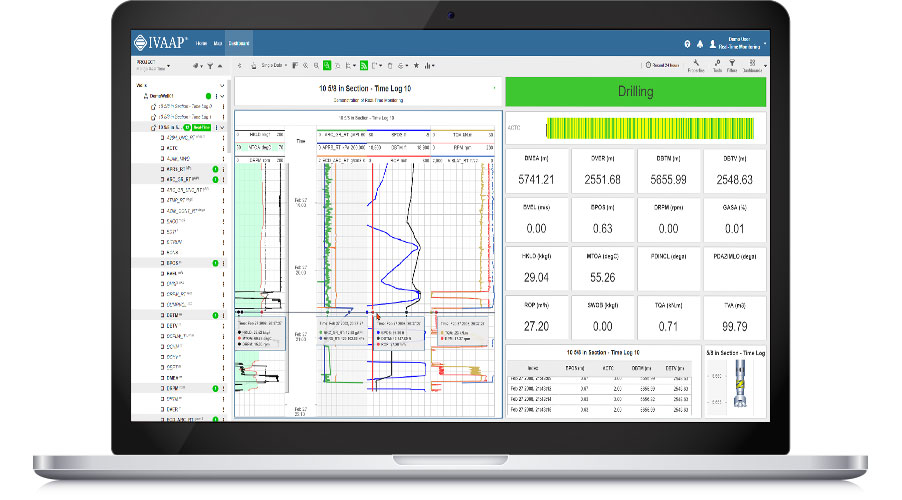
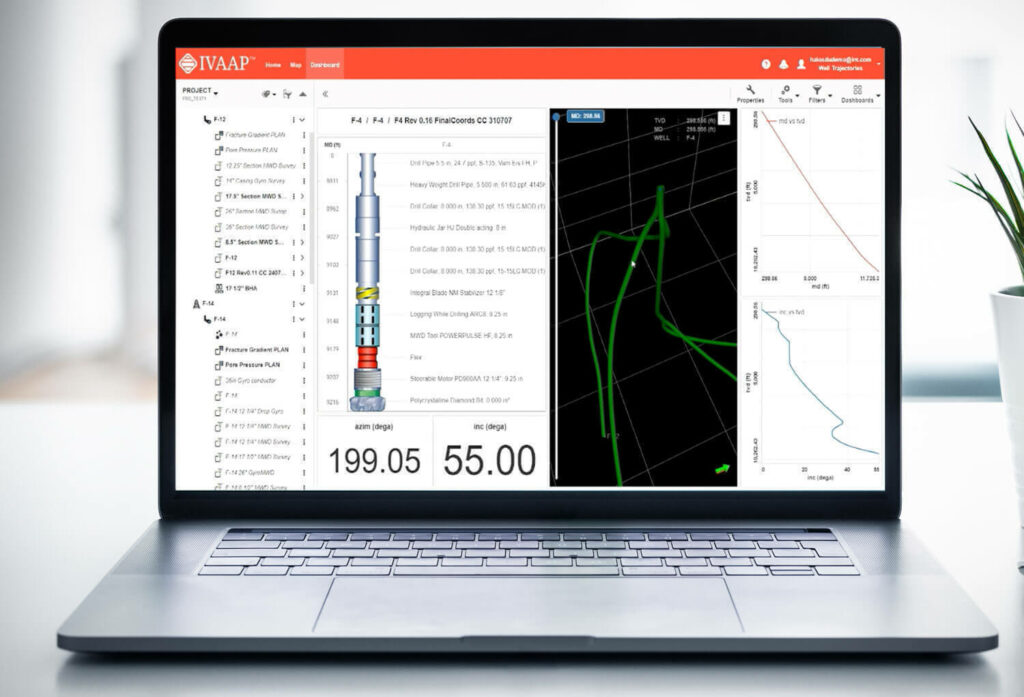
Create and share robust dashboards with well logs, gauges, cross plots, BHA, schematics, rig states, alarms, messages, multiwell correlation, and more. Teams can collaborate and interpret data no matter their location, working with the same data in the same dashboard, reducing the possibility of errors or delays in decision-making.


Integrate ML and Processing Workflows
IVAAP can also be used to automate processes and workflows, which helps to ensure that data is processed and analyzed in real-time, and that decisions can be made quickly based on the results. By using IVAAP for real-time visualization and analysis of subsurface data, teams can make more informed decisions, reduce risks, and improve operational efficiency.
Real-time Data Streaming
Connect to multiple real-time data streams, extract drilling and production data—wellbore pressure, temperature, and flow rate—and display the data as it arrives. IVAAP supports WITSML 1.31, 1.41, 2.0, and more.
Real-Time Processing
IVAAP Enterprise can perform real-time processing of subsurface data. For example, it can perform real-time analysis of seismic data as it is being acquired to identify potential drilling targets.
Alerts and Notifications
Visualize data in real time, monitor drilling and production operations, identify trends and anomalies, and make data-driven decisions quickly. Notify your team with alerts and notifications.
Combine RT and Static Data
Aggregate your real-time data with your proprietary data to create comprehensive covisualization dashboards. Include legacy or historical data to create a full picture.
Why Companies Choose IVAAP

Vikash Rambaran Mishre
E&P Information Management & Technology Administrator
Staatsolie N.V.
“Considering the current challenges in O&G, companies must look for ways to improve operations and find efficiencies. The IVAAP platform eliminates redundant applications, streamlines data access and analysis, and improves our operational efficiency significantly. We expect to find 30% improvement across the board.”

Lúmen Sebastião
GAD Director
ANPG
“ANPG is very pleased with the implementation of the Virtual Data Room solution, a strategic tool for the promotion of Angola’s oil potential and the attraction of foreign investment, as well as the digital transformation of the organization itself.”

Gustavo Urdaneta
Drilling Software Global Manager
Weatherford
“One of the key components in Centro’s efficiency is IVAAP. With IVAAP, Centro is able to provide solutions and operational insights to make quick, informed decisions. The proven E&P data visualization and open architecture design was a critical factor in selecting the IVAAP framework to enhance the value of user-centric visualizations in our well delivery software.”
REQUEST A FREE DEMO
Ready to learn more? Request a free demo to get a personalized walkthrough of our software and learn more about the platform.
Features
- Real-time feed of drilling, completion, wireline, and intervention data
- Well data dashboarding: Well log, gauges, cross plot, tool face, BHA, mud logs, schematics, rig states, alarms, messages, multi-well
IVAAP Supports
- WITSML 1.31
- WITSML 1.41
- WITSML 2.0
