Exploration, Drilling, and Production Visualization
Energy Industry-Standard Data Visualization Tools
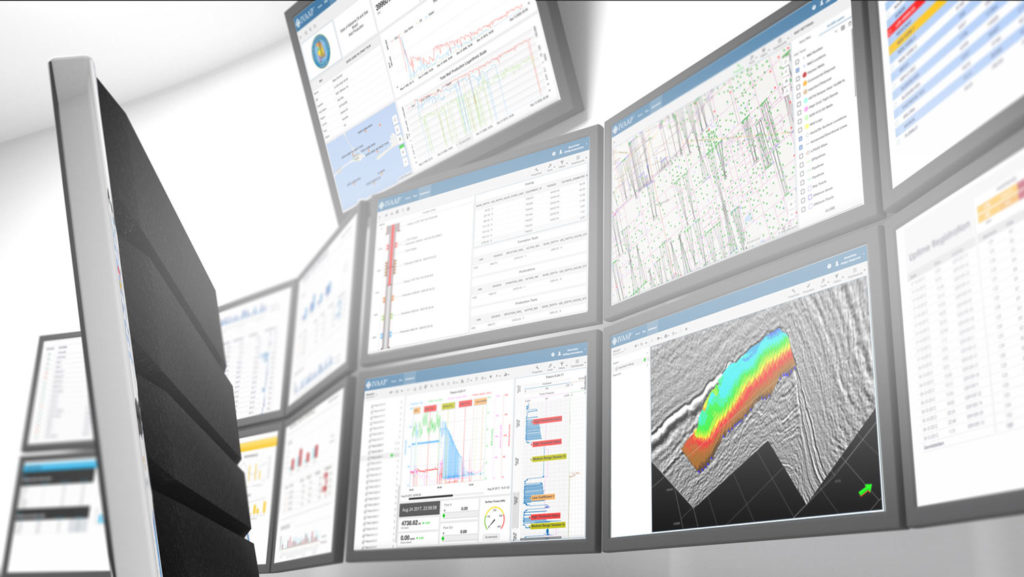
Majors, National Oil Companies (NOC) and Oilfield Service companies can accelerate their digital transformation to the cloud with our real-time subsurface data visualization platform IVAAP™ that provides a robust framework of cloud viewers so that geoscientists and data scientists can search, explore, aggregate, analyze, run Machine Learning (ML) and display seismic, well data and more simultaneously in one dashboard and collaborate amongst their team and clients.
For developers, GeoToolkit™ offers a comprehensive set of high-performance 2D/3D visualization tools and libraries to quickly embed advanced domain-specific solutions into their cloud subsurface workflow applications.
And whether you simply need to quickly import and QC geoscience data or you want to view multiple data sets in a variety of ways, INTViewer™ is a customizable desktop platform and application that can extend to fit your QC needs of a lightweight tool, easily deployable in a server or on a laptop.
Beyond E&P: Building New Energy Visualization
Developers building new applications to manage CCUS (Carbon Capture Utilization and Storage), geothermal, wind farm and other new energy sources can leverage GeoToolkit advanced visualization libraries to display required views for geoscientists and operators.
GeoToolkit can be used to visualize reservoirs and surfaces and display IIOT from any data type—from water levels, pressure, flow, fluids and polarity. GeoToolkit’s flexibility means a smoother transition to new energy software applications in a fraction of the time.


Accelerate Digital Transformation with Proven Capabilities
Today, digital is key in oil and gas to reduce costs, make faster and better decisions, and increase workforce productivity with remote access and cloud technology.
INT software runs securely in your browser with no installation necessary. The cloud-ready HTML5 visualization solution supports multiple exploration, drilling, and production workflows.
With its latest platform, IVAAP, INT offers out-of-the-box capabilities to connect, aggregate, and stream multiple data sources simultaneously in real-time that the upstream business user needs.
For application portfolio owners, these proven capabilities can help reduce time to bring solutions to their business stakeholders.
Explore IVAAPDeliver Usable Applications to Geoscientists
We understand that fast turnover is important when it comes to your G&G application.
That’s why over the years we have designed unique capabilities that allow geoscientists, petroleum engineers, and data scientists to take advantage of powerful subsurface data visualization interaction features, such as:
- Visualizing data aggregated from various data sources in one place.
- Collaborating on the same project via shareable dashboards that are customizable to each view, each dataset by the end user versus IT.
- Co-visualizing data in context in a single dashboard. For instance, by combining seismic, well, and schematics data.
- Combining historical, static, and real-time data on the fly, streamed from each data source.

Ensure Success with Interoperability
Interoperability is a key factor in not only increasing efficiency and accuracy, but also in facilitating collaboration. INT actively works with other major companies in the industry to transform the way subsurface data is captured and made available across applications to enable automation, processing, machine learning, and interoperability. To help achieve these goals, INT is an active member of the OSDU™ consortium.
INT technology offers numerous standard data connectors for the most used data types, files formats and commercial databases, and CSP offerings in the Energy industry, such as: PPDM, Amazon S3, Azure Cloud, GCP Bucket, WITSML server, SQL, ProdML, and Osi PI connectors.
Watch the latest OSDU VideoDemos
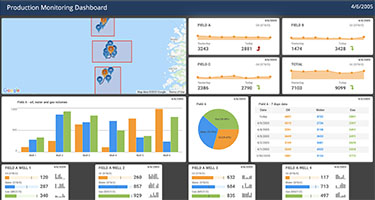
Trend Dashboard
Realtime interactive dashboard build with HTML5 Carnac widgets and Google Maps.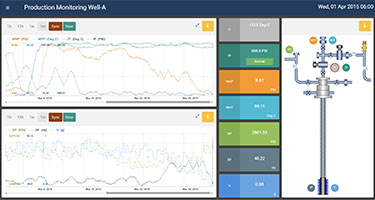
Production Dashboard
Live time-series well data. Navigate to historical data, synchronize, and add new curves to the plots.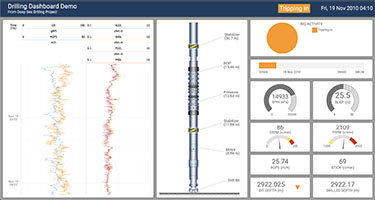
Real-Time Drilling
Real-time drilling dashboard built with HTML5 Carnac widgets, Gauges and WellLog widgets.Customer Stories
The INT Blog
Check out our blog, where we feature posts written by our expert developers who share trends, tips, product news, and behind-the-scenes insights.
Visit the blog